Yesterday (Jan 8) I have run out of time to make a proper realignment of the EDB OMC in LN2. I have just done a 5 minute check that there is no obvious way to make a large improvement in the transmitted power when locked on the 56MHz USB TEM00, and then proceeded with a scan of the EDB OMC with the same parameters as in the past few months: freq 0.002Hz, ampl 0.5, offset 23.27.\
17:59 UTC (40min) EDB OMC scan with standard paratmers
18:40 UTC (20min) EDB OMC scan with the speed reduced by a factor 4 to more easily see on the camera which mode is which peak
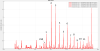
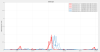
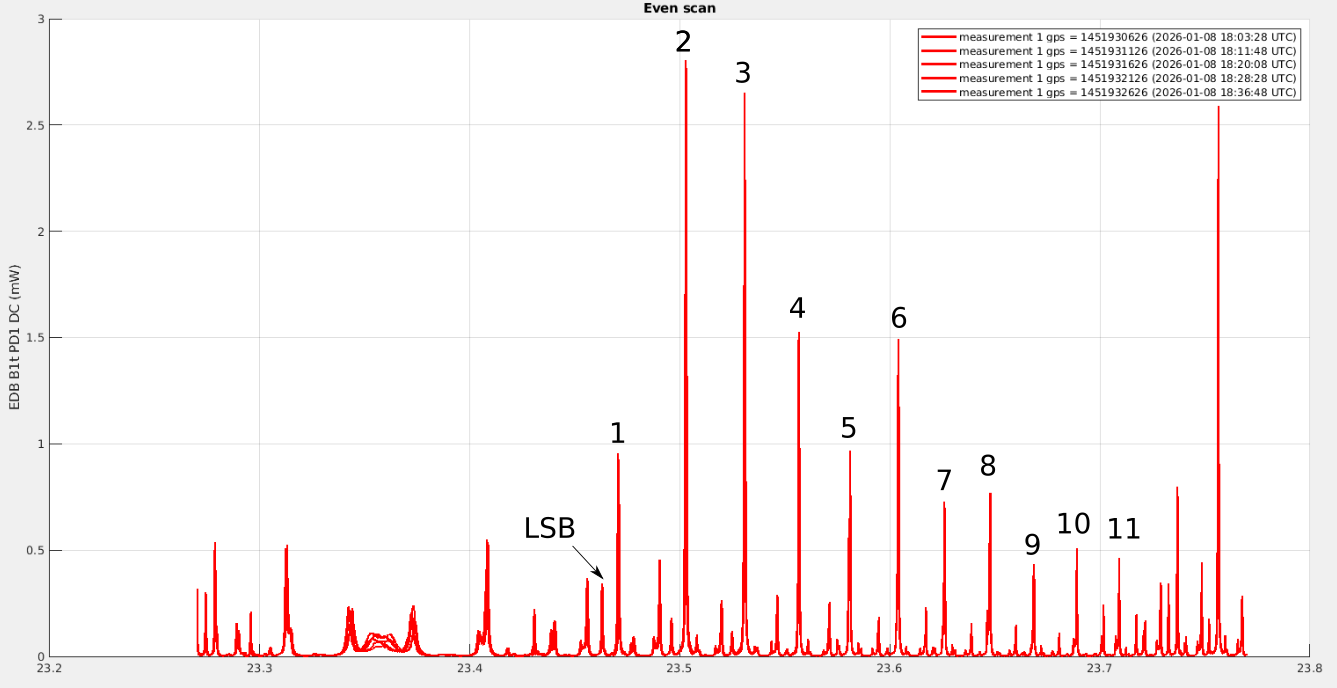
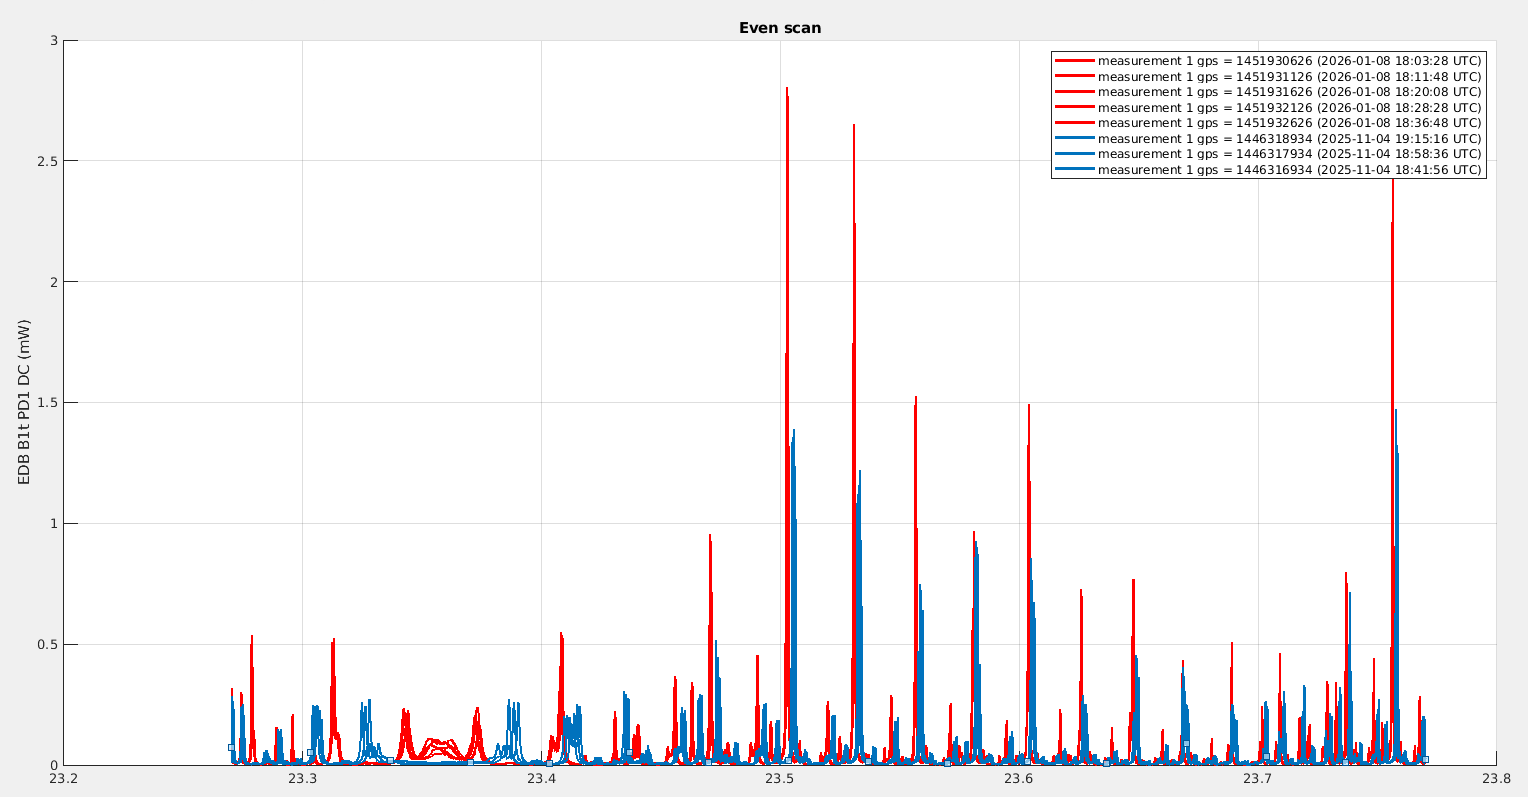
Figure 1 shows the scan with the carrier HOM and the 56MHz USB TEM00 highlighted. The alignment of the EDB OMC is not great, as the order 1 mode of the 56MHz has about half the power of the TEM00.
This could be compared to a previous detailed study from July: https://logbook.virgo-gw.eu/virgo/?r=67382, but the EDB B1t photodiode has been changed in the meantime, and I am not sure its calibration is correct anymore, so the absolute power cannot be compared. It is more directly comparable to the measurement from November: https://logbook.virgo-gw.eu/virgo/?r=68097.
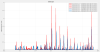
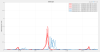
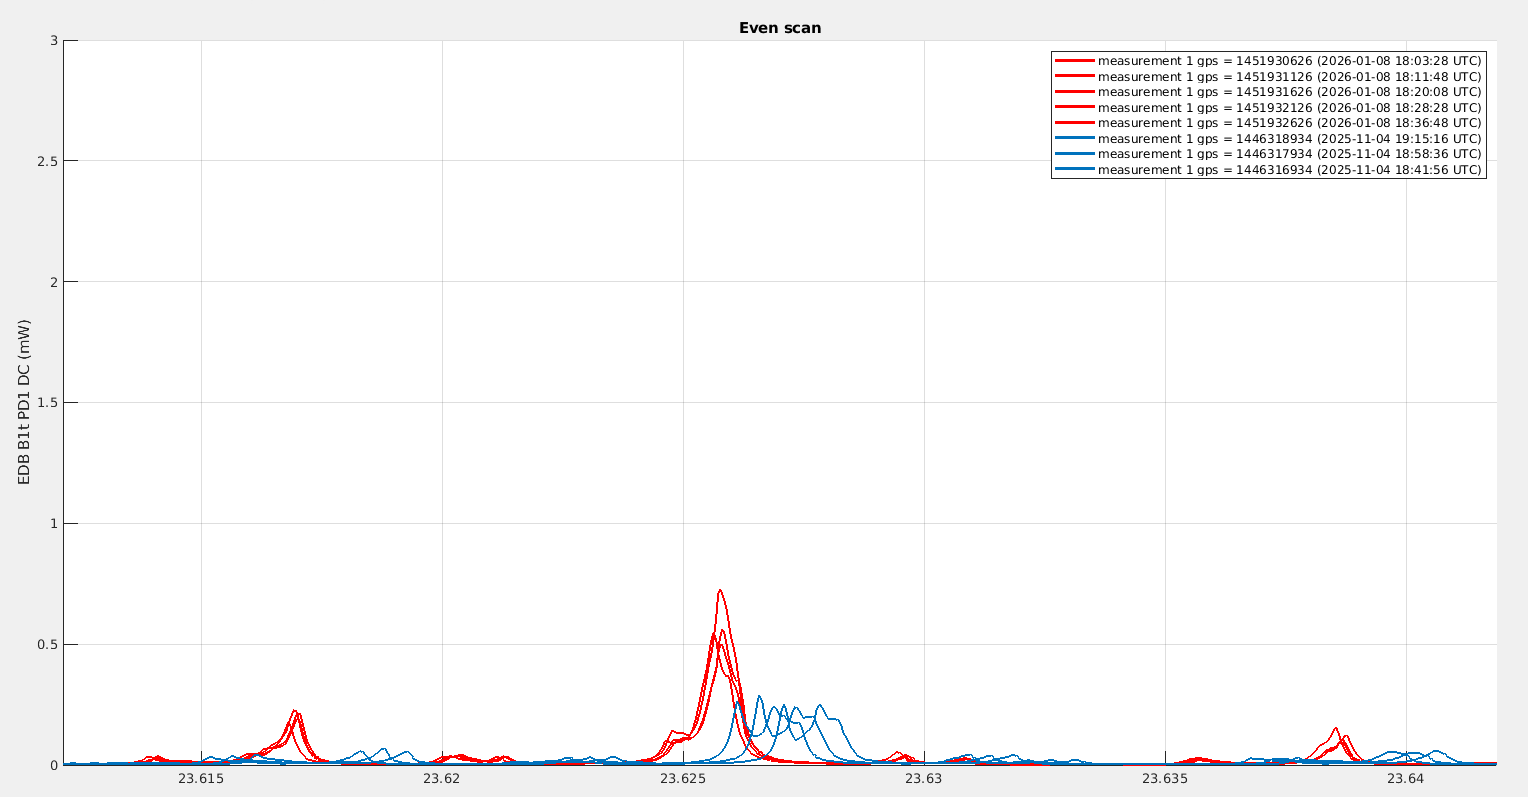
Figure 2 superposing the scans from yesterday and from November what is striking is that the power of most of the HOM has doubled, with the exception of modes order 5 and 9. While the power of the 56MHz sideband TEM00 is comparable.
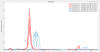
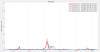
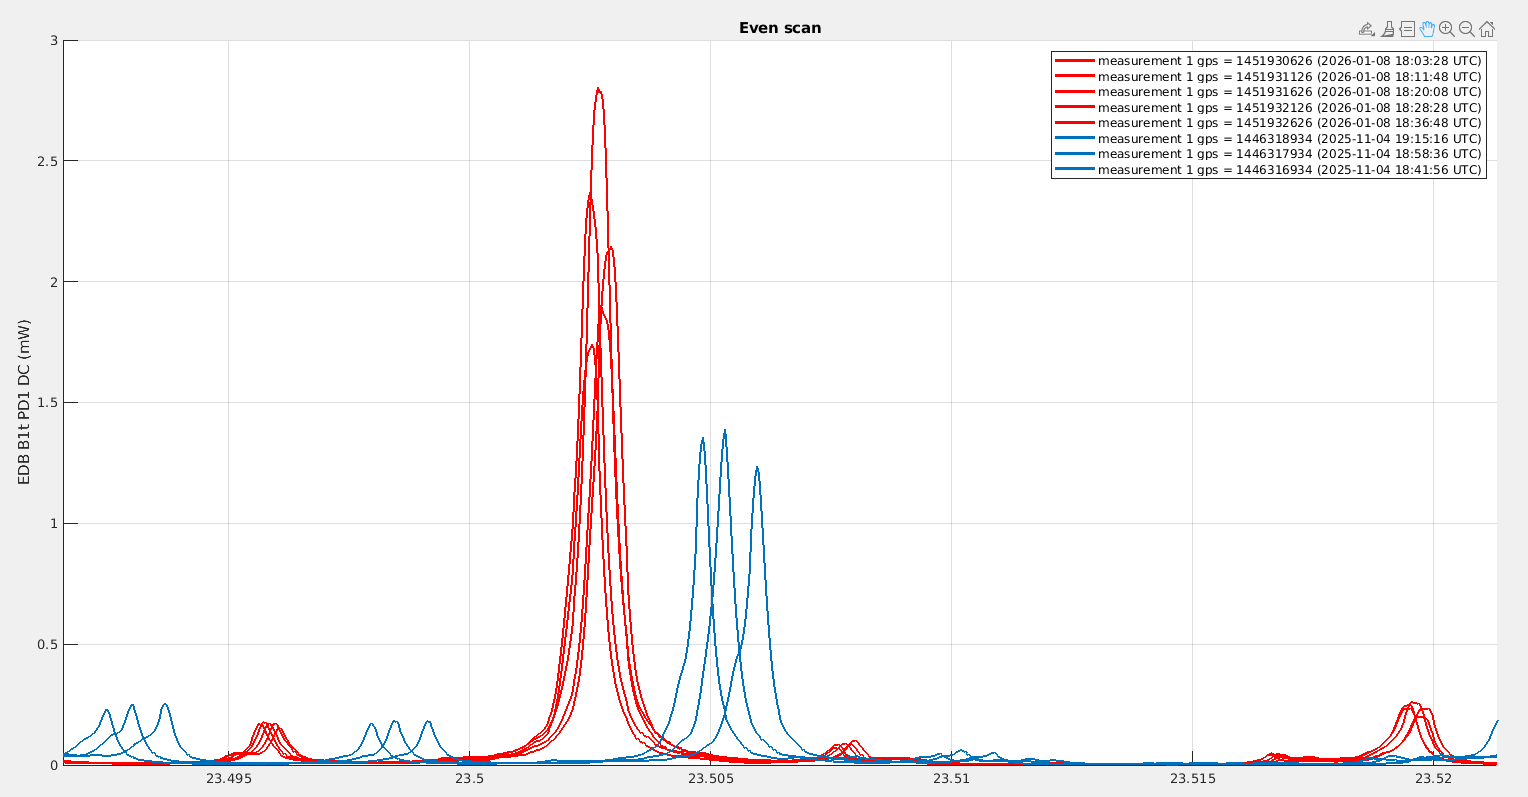
Figure 3 zooms around the order 2 mode. There were almost a factor 2 fluctuations in that power yesterday.
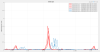
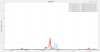
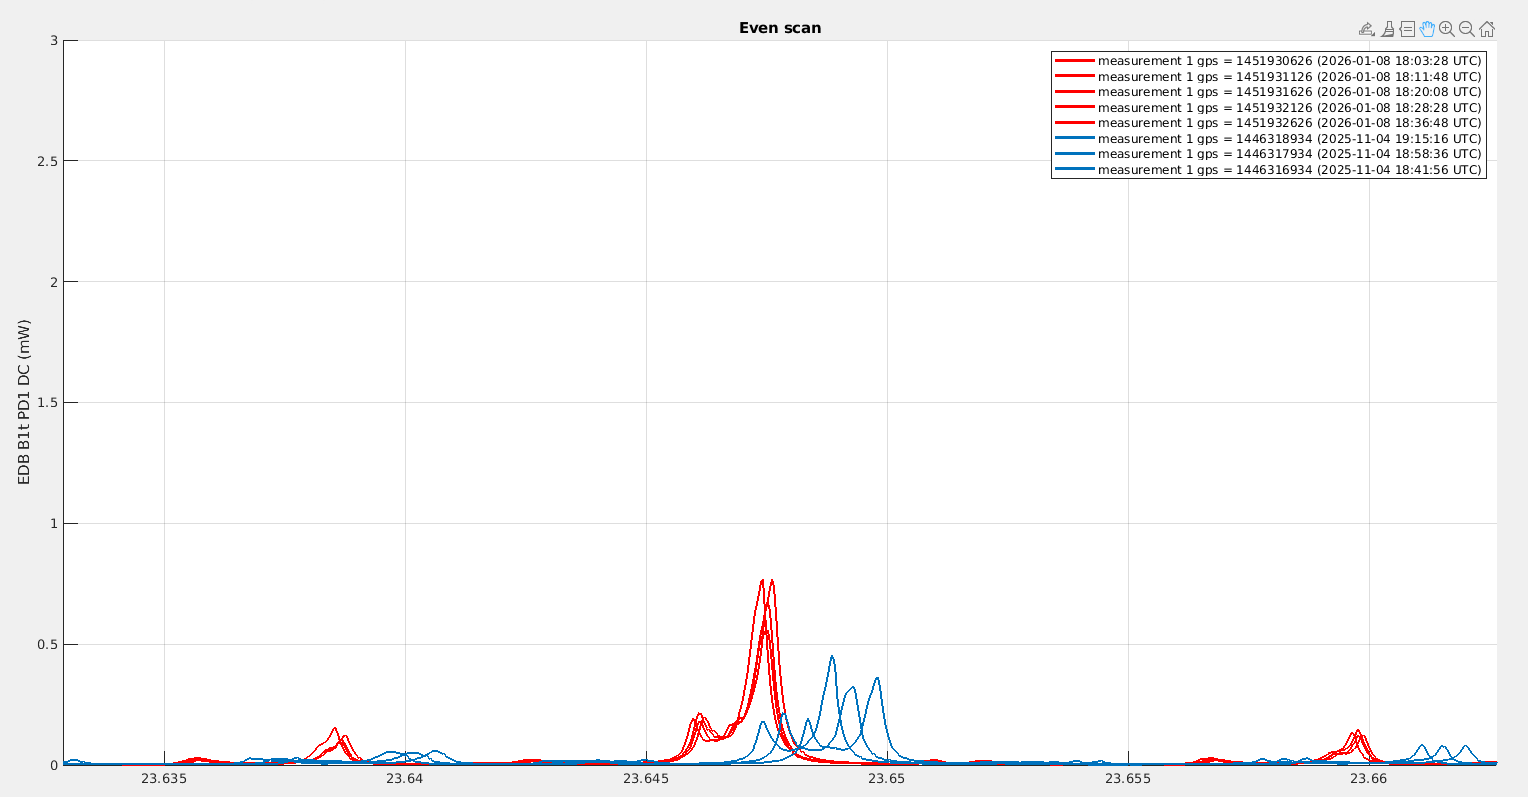
Figure 4 zooms around the order 3 mode.
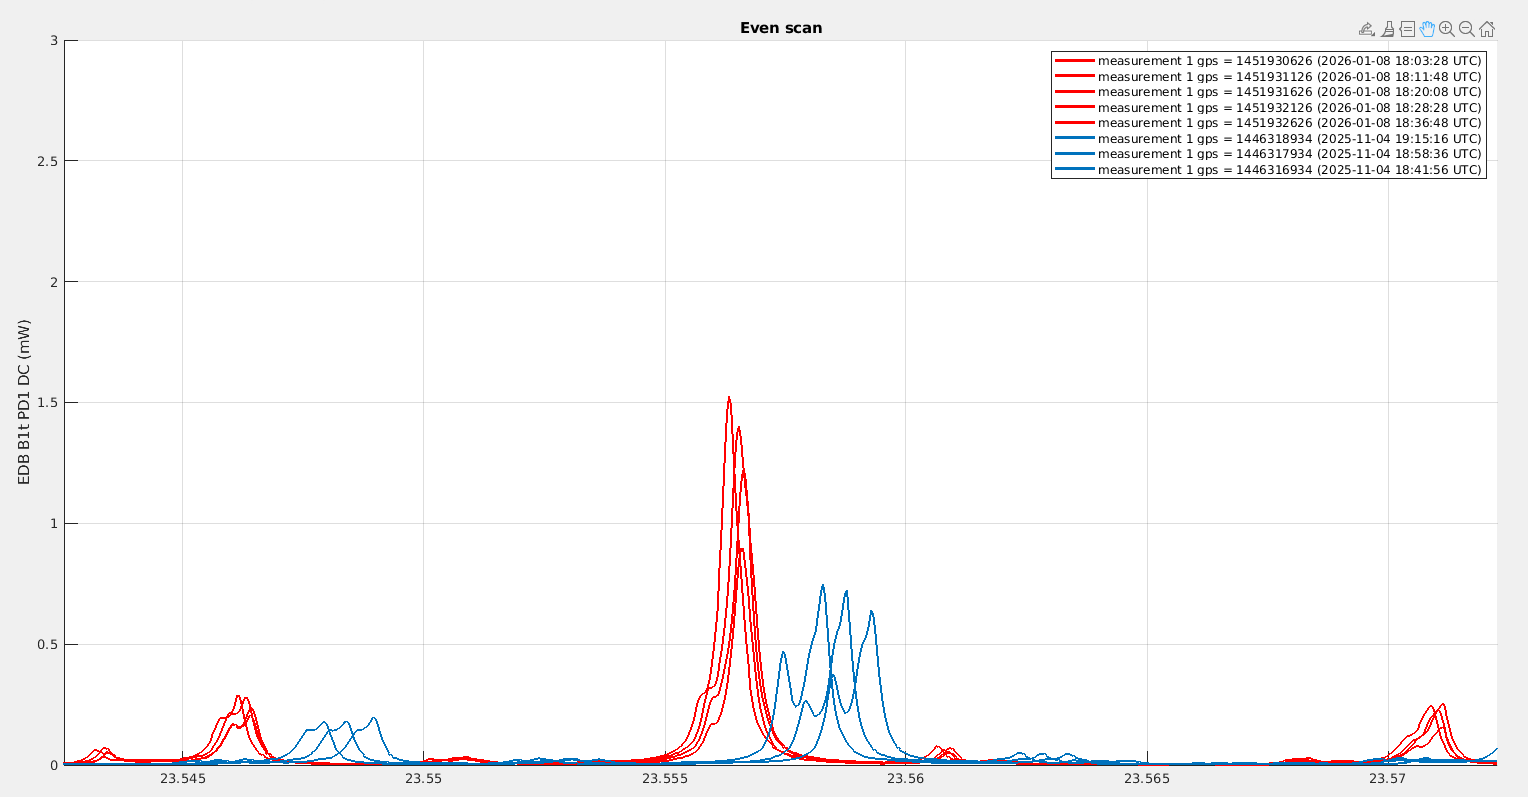
Figure 5 zooms around the order 4 mode.
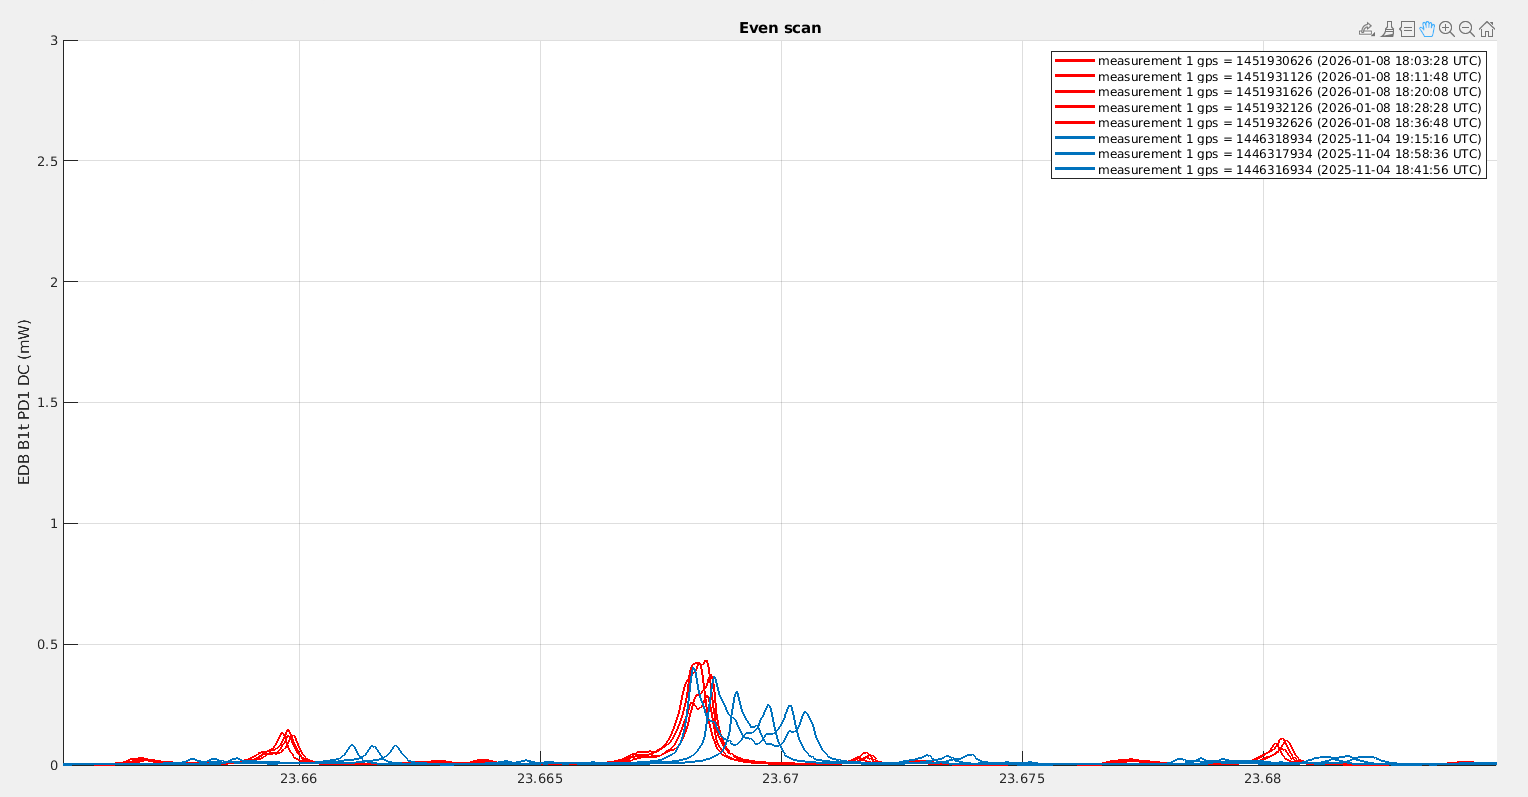
Figure 6 zooms around the order 5 mode, they are indeed the same yesterday and in November.
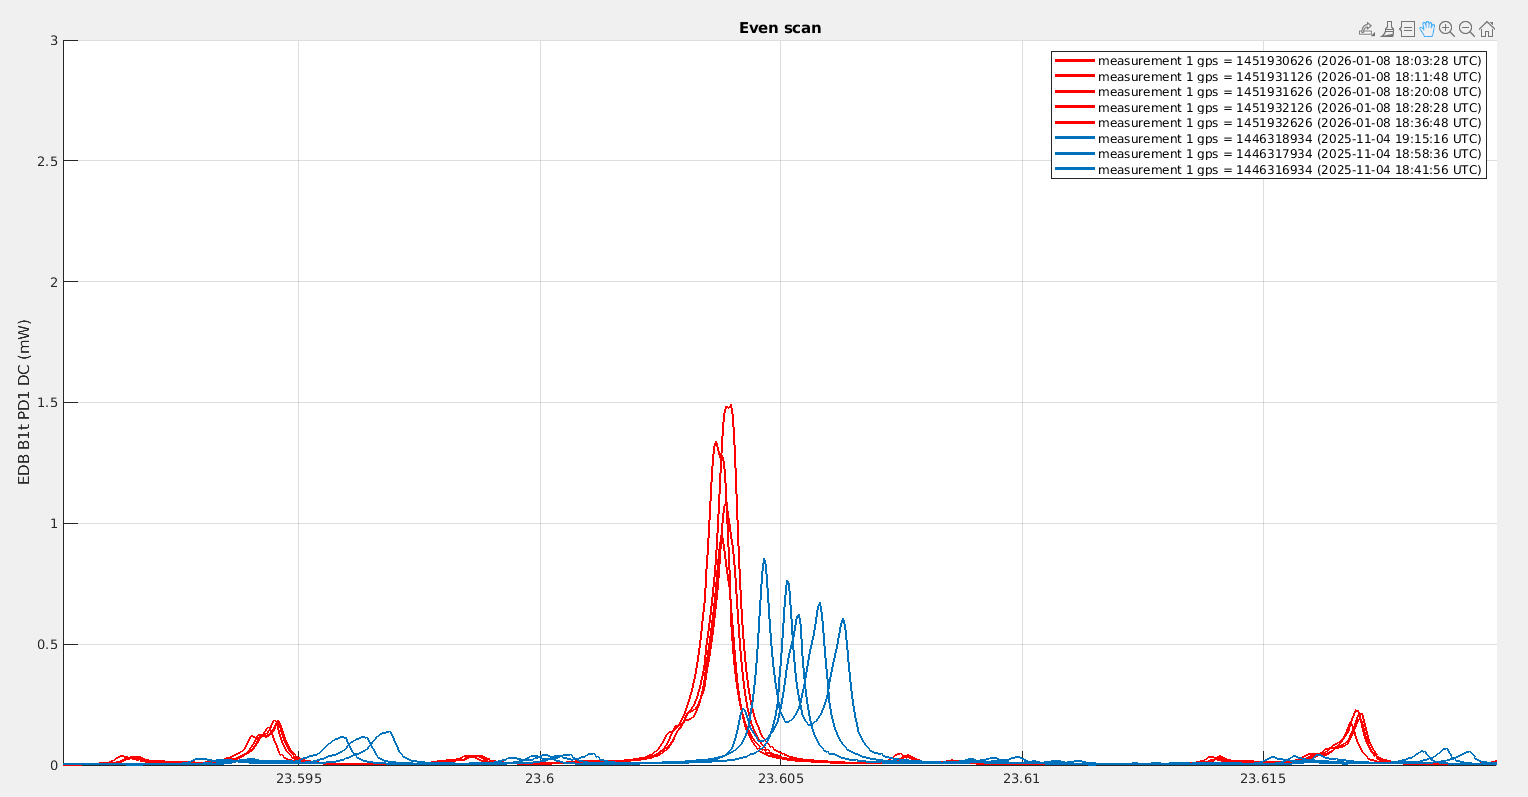
Figure 7 zooms around the order 6 mode.
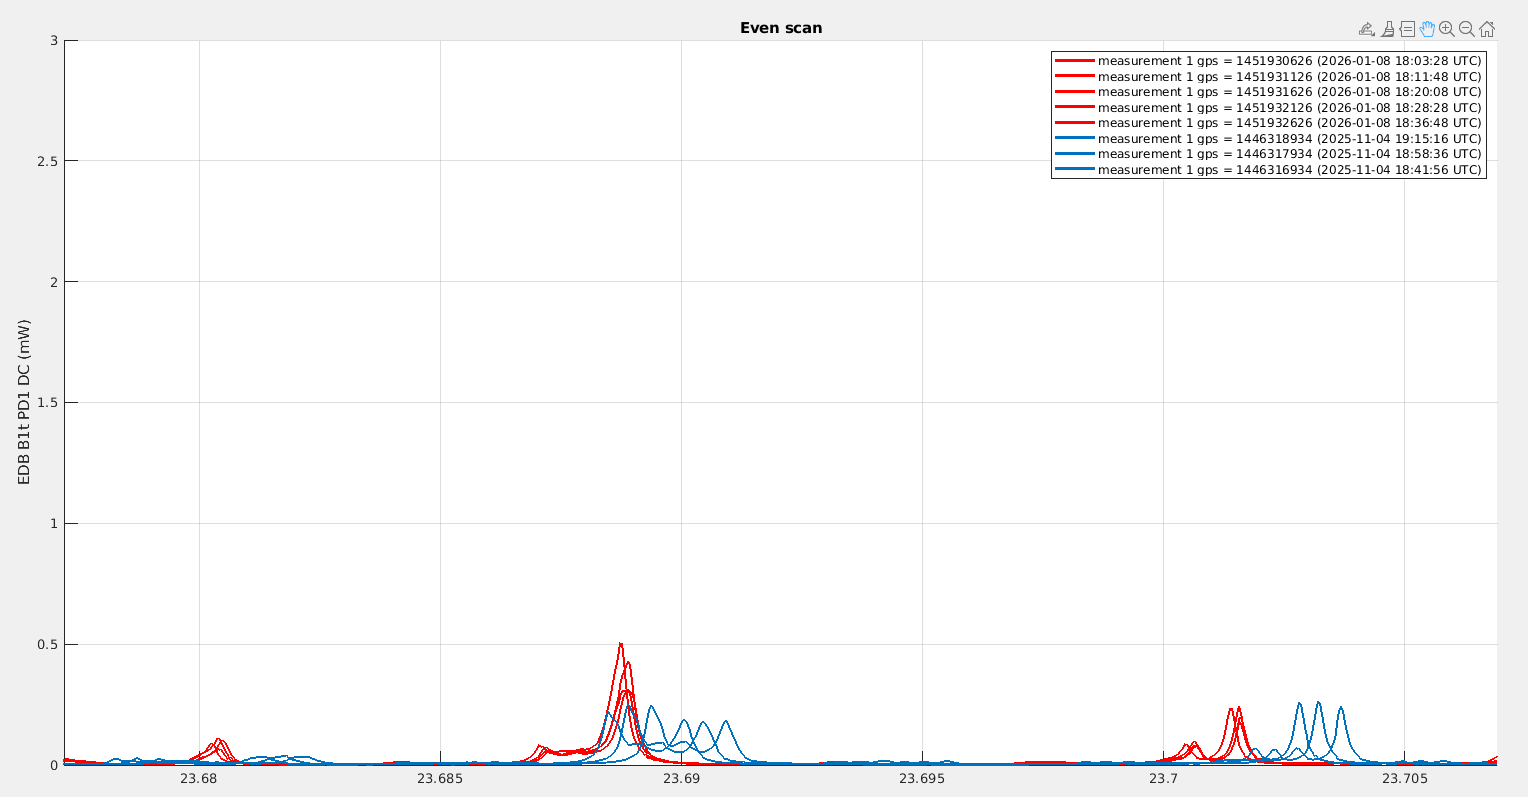
Figure 8 zooms around the order 7 mode
Figure 9 zooms around the order 8 mode
Figure 10 zooms around the order 9 mode
Figure 11 zooms around the order 10 mode
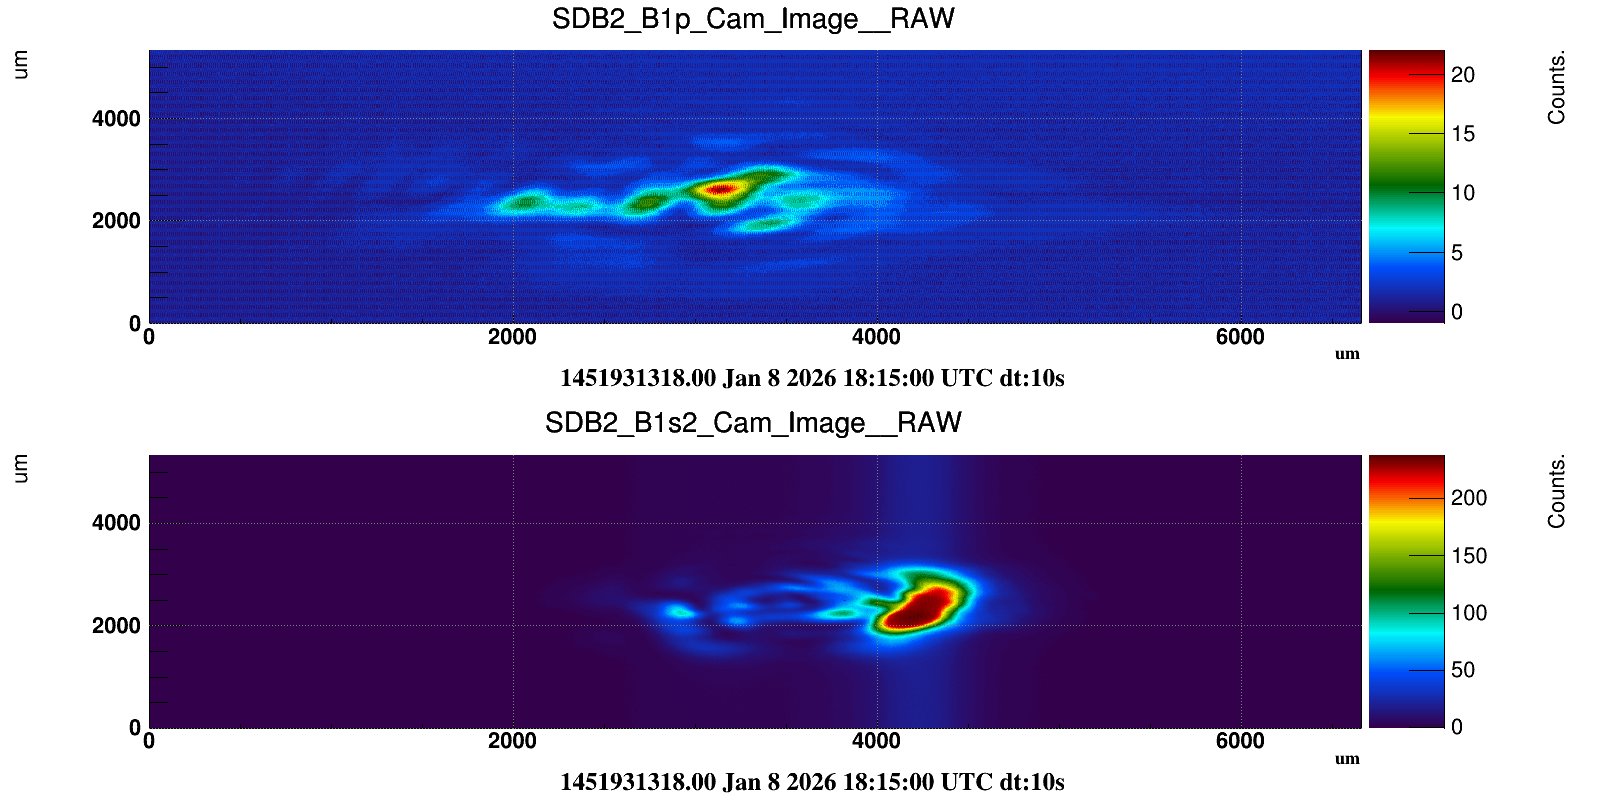
The increase in HOM power is also compatible with what is seen on the SDB2 B1s photodiode. Which in November was fluctuating between 20mW and 24mW during the scan, while yesterday it was fluctuating between 20mW and 40mW. So maybe the issue is that interferometer is less stable in LN2 than it used to be. In particular the BS TX loop was in drift control yesterday, maybe it was in high bandwidth during the measurement in November.
Looking at B1p, the power in November was fluctuating between 340mW and 400mW, while yesterday it was fluctuating between 230mW and 280mW. It is very confusing that the change we observe on B1p is in the opposite direction to the change in power we observe on B1s.
Looking at the shapes of the different modes, I have the impression that back in November most modes had a double peak structure, corresponding to a power distributed between the horizontal and vertical direction as the OMC is slightly astigmatic, while in January the modes are more single peaked, which would mean there is a preferred direction of the HOM. On the other hand it could be just a coincidence if the power of the higher order modes is fluctuating due to alignment, and it happens to be that for each resonance we see only one cycle of alignment fluctuations. Locking on each mode individually would allow to check how stable they realy are, and if there is a preferred direction.
