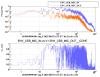
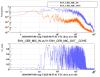
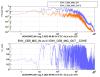
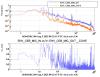
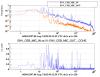
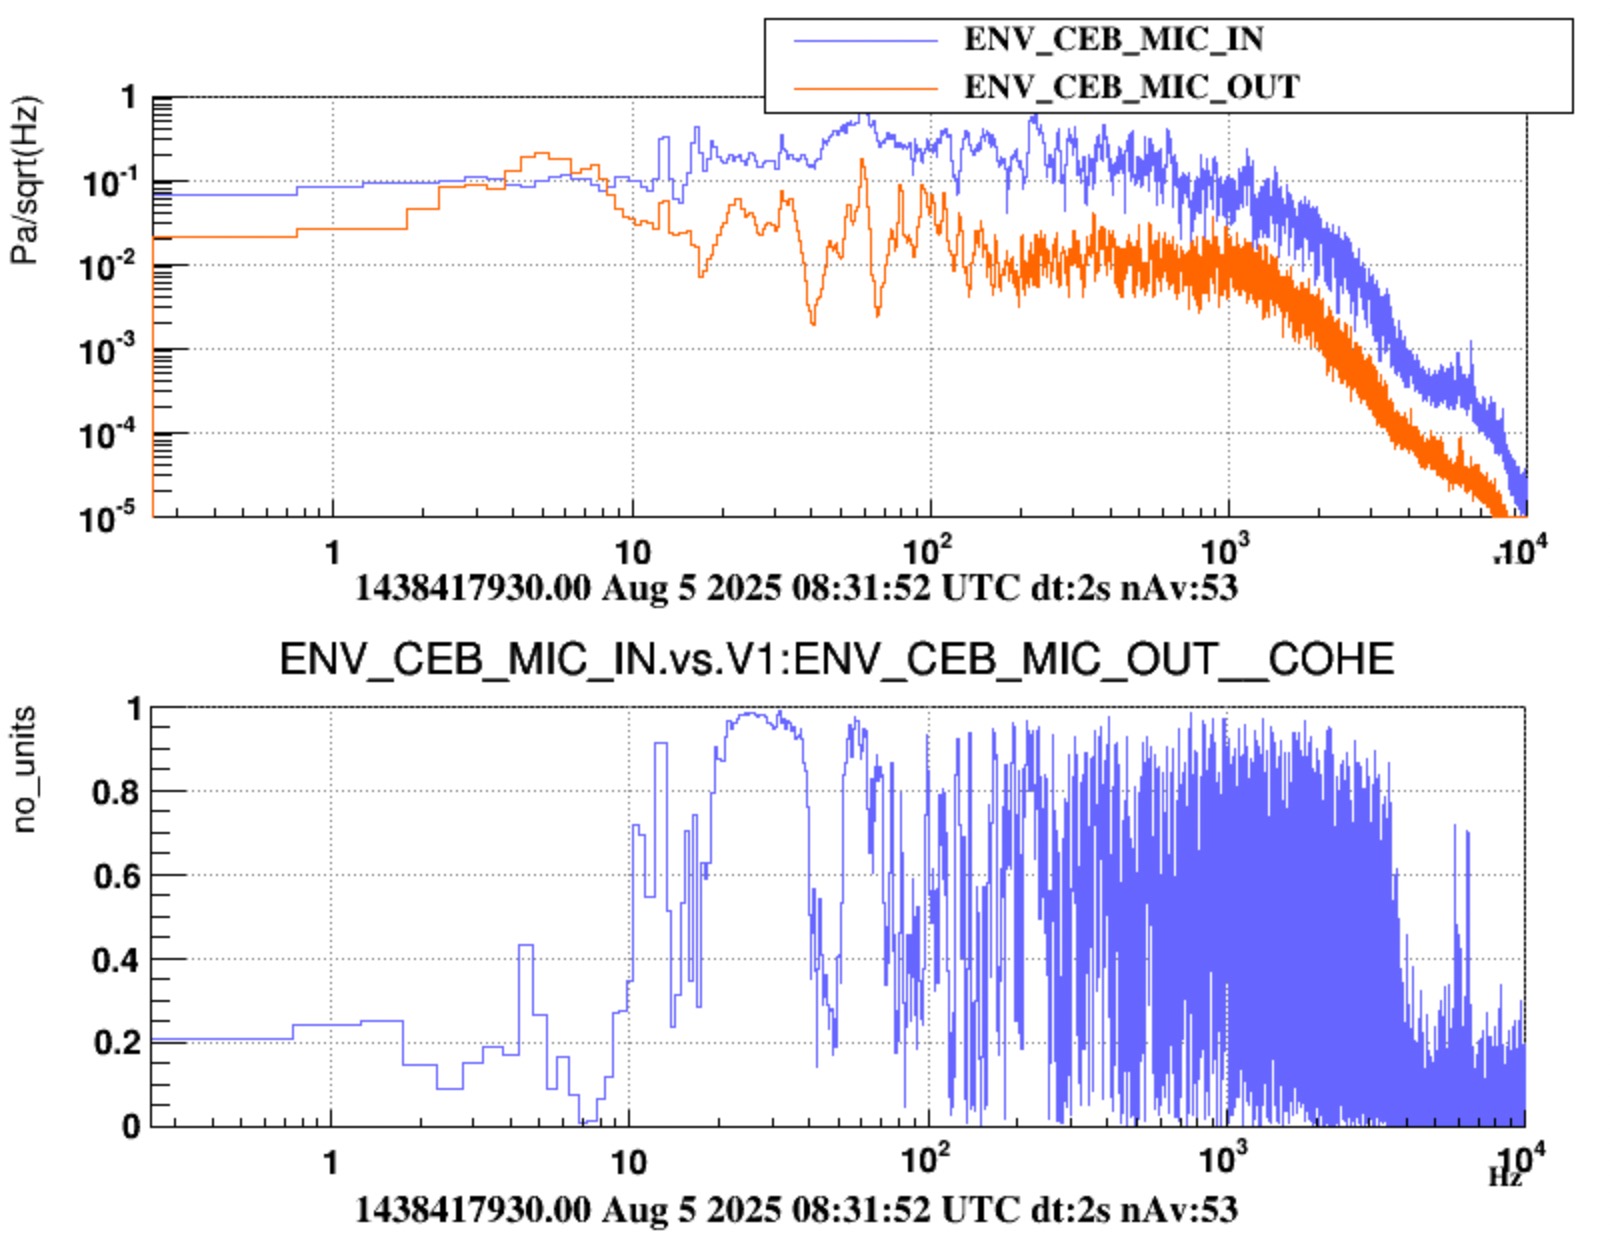
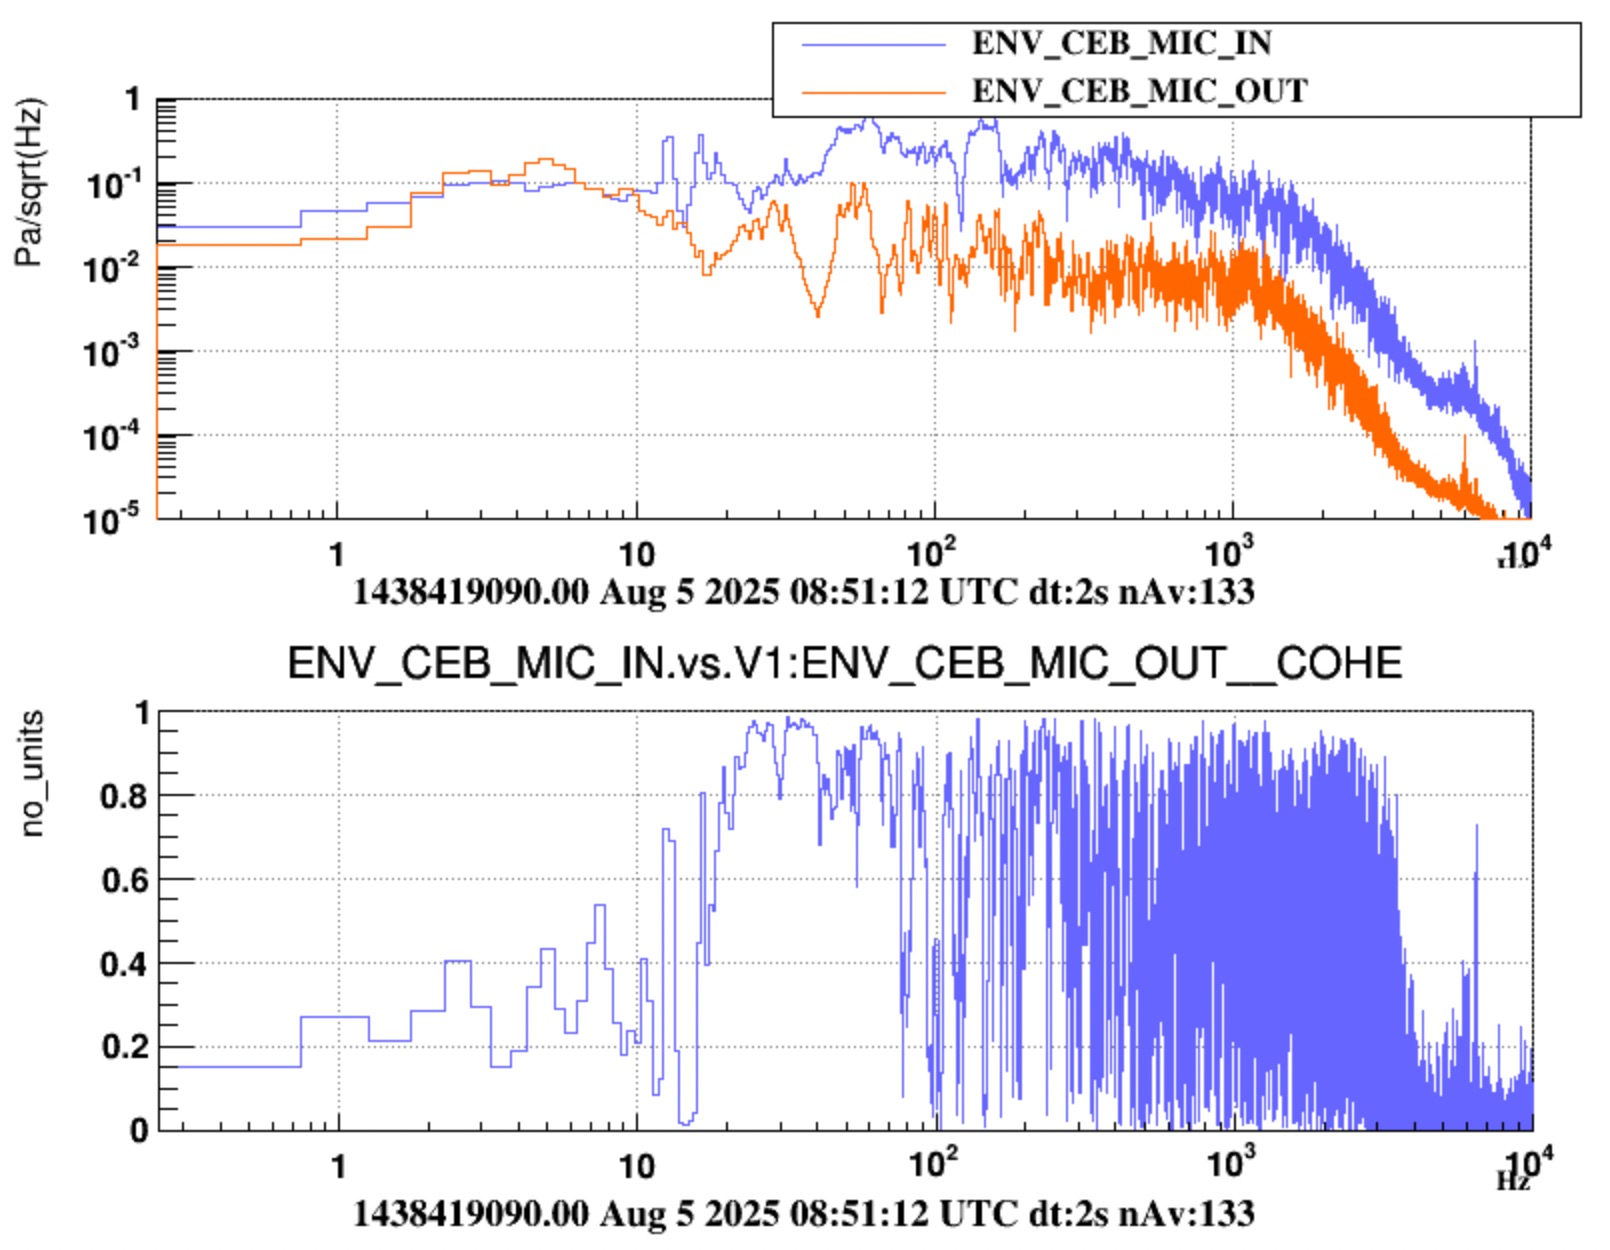
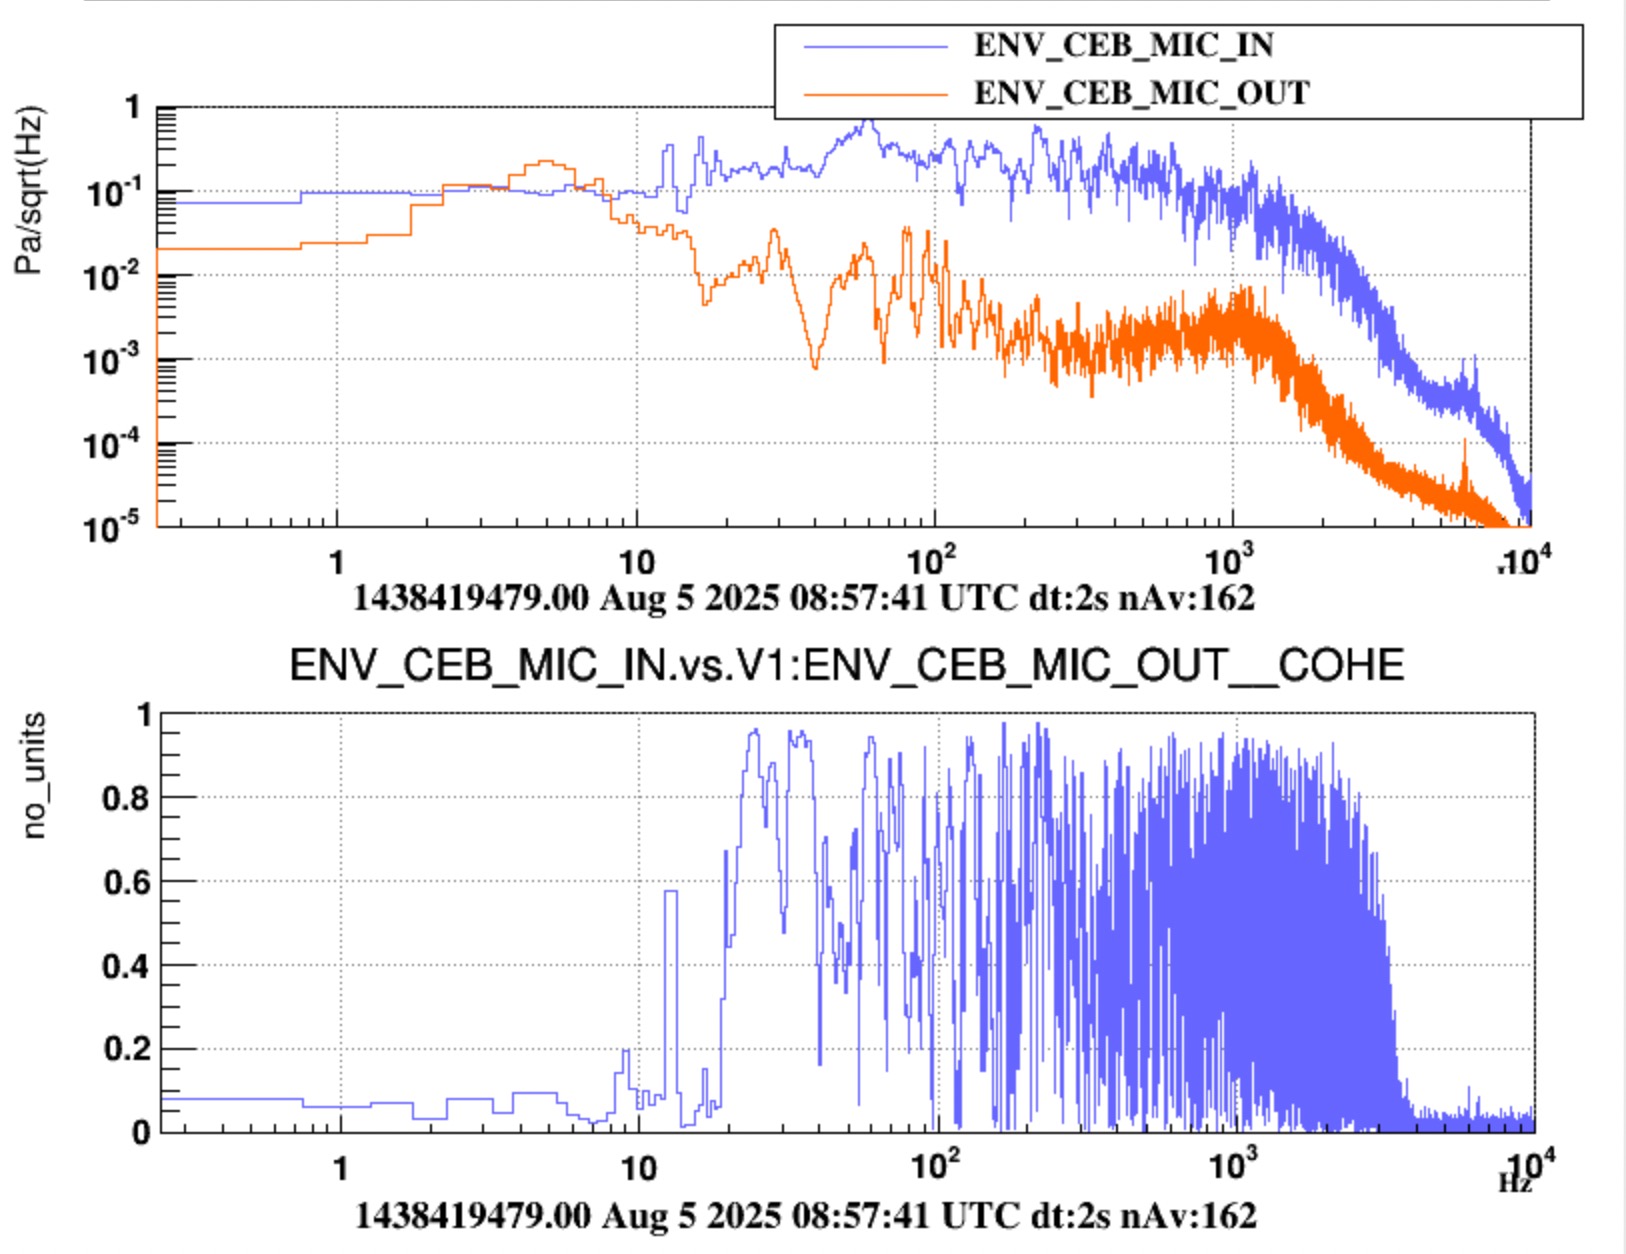
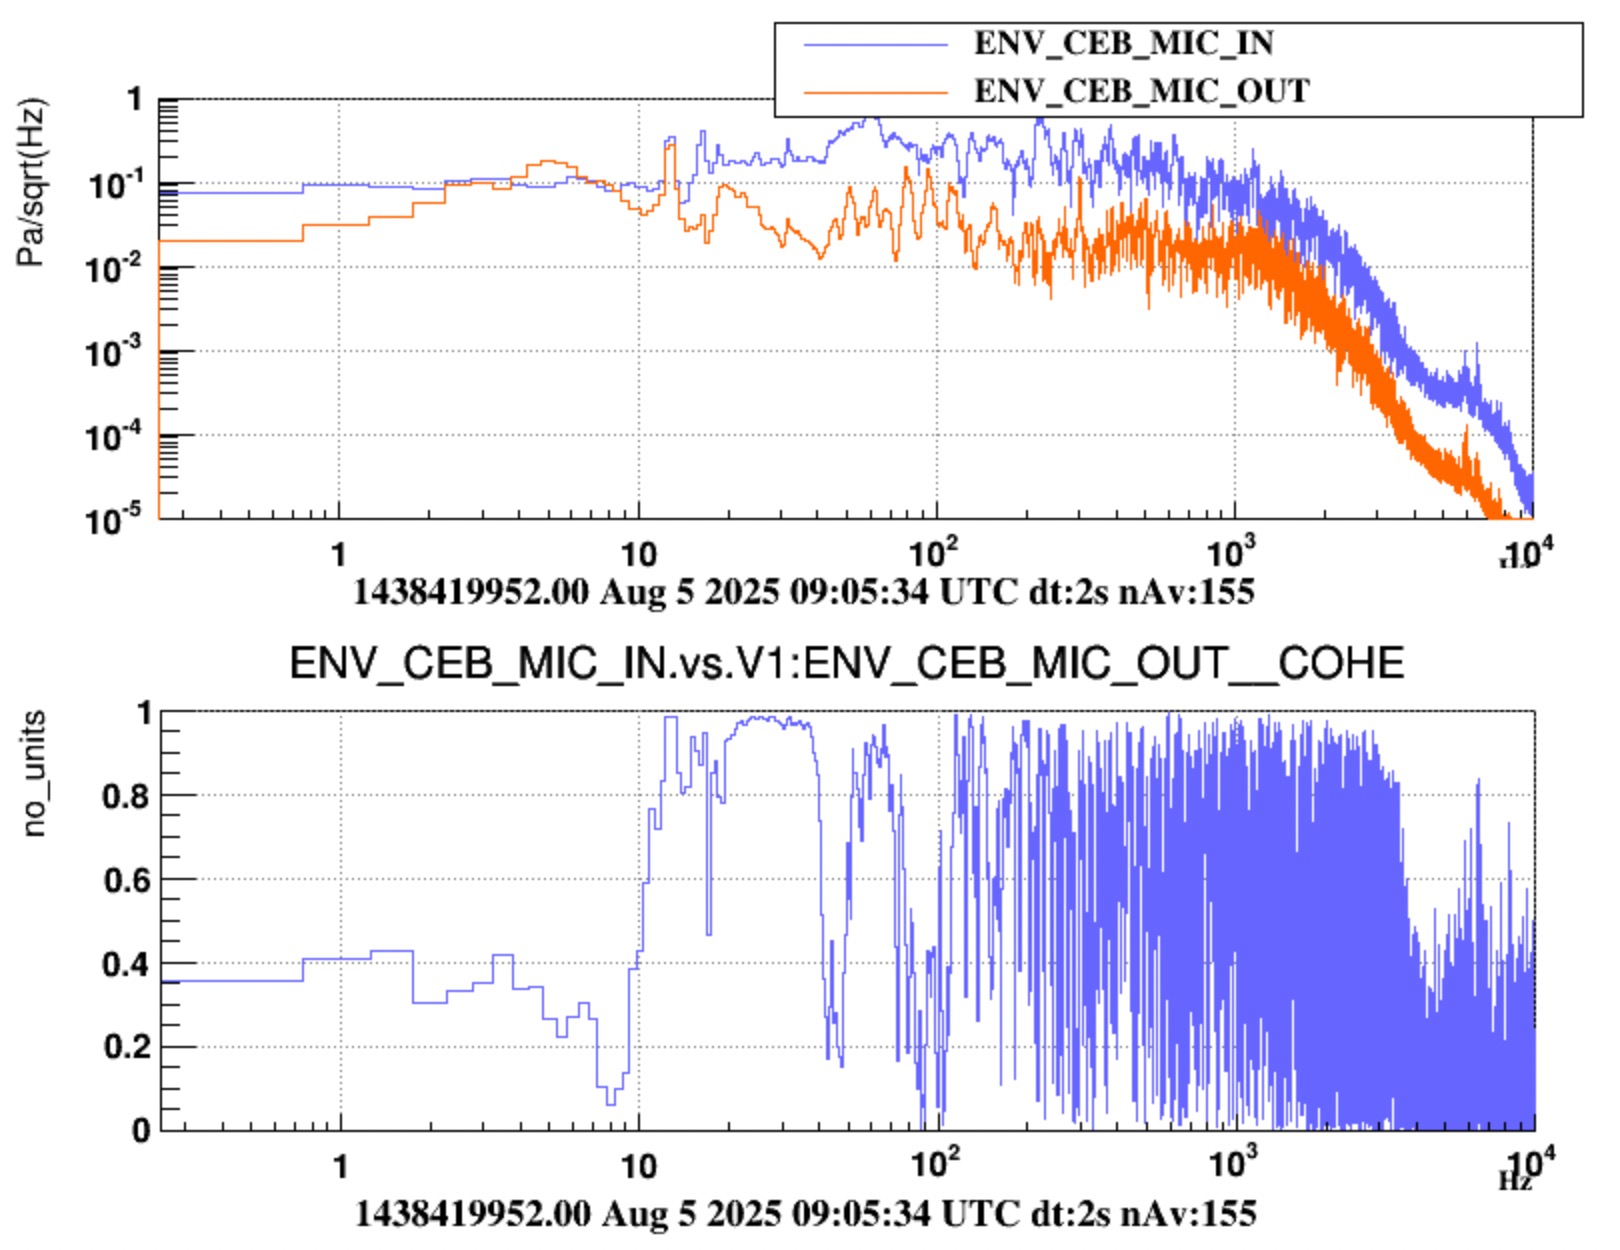
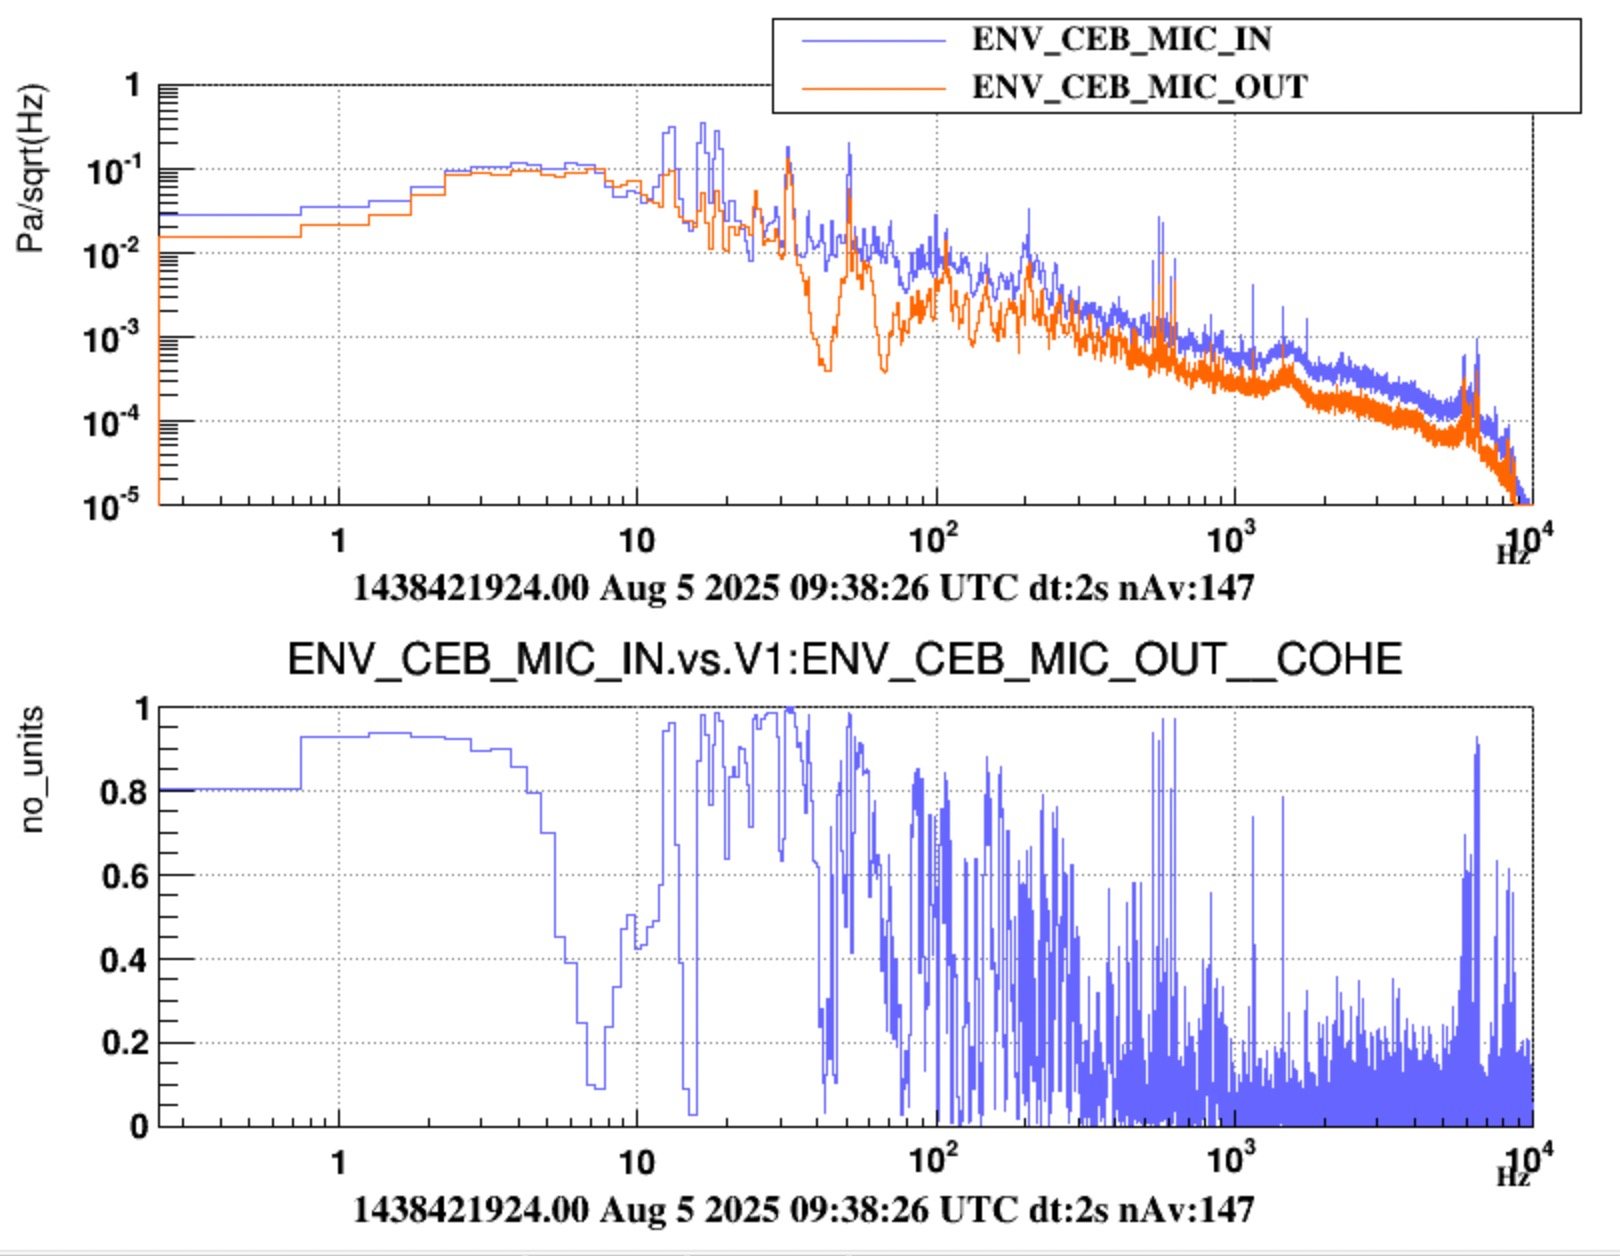
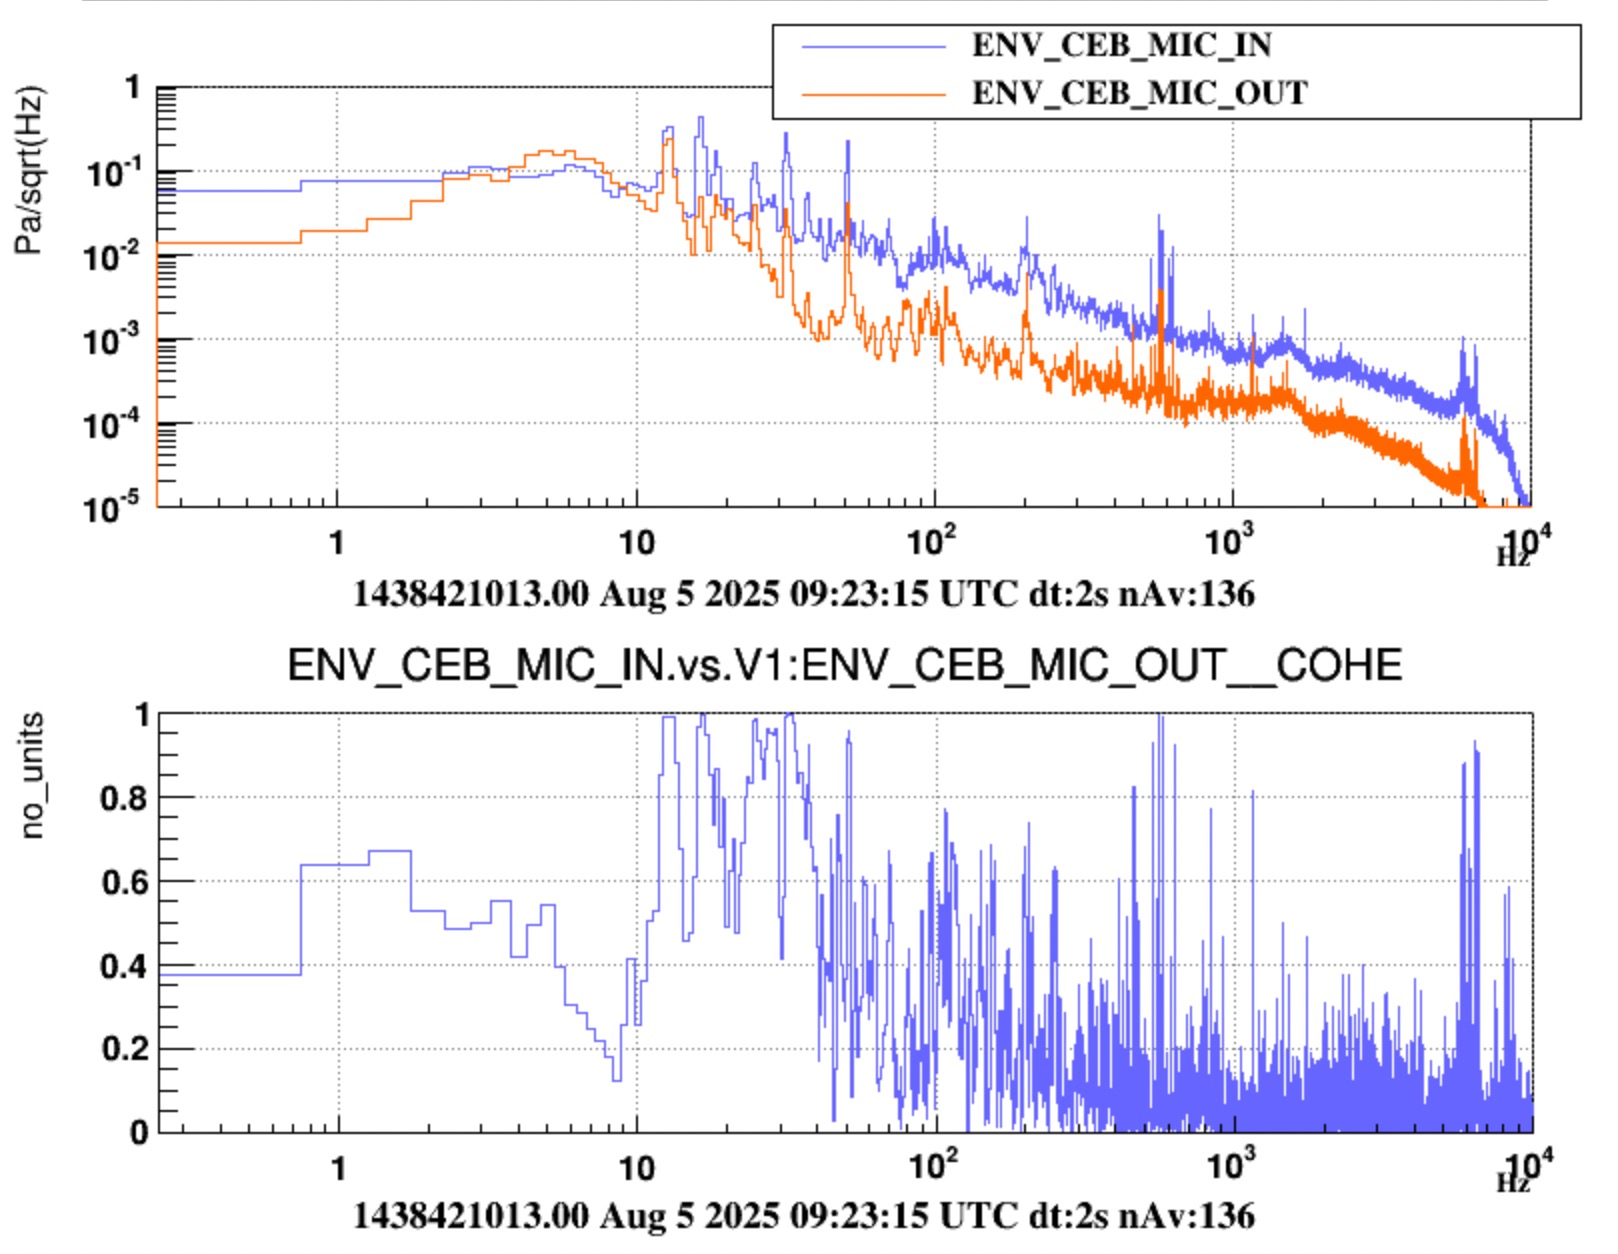
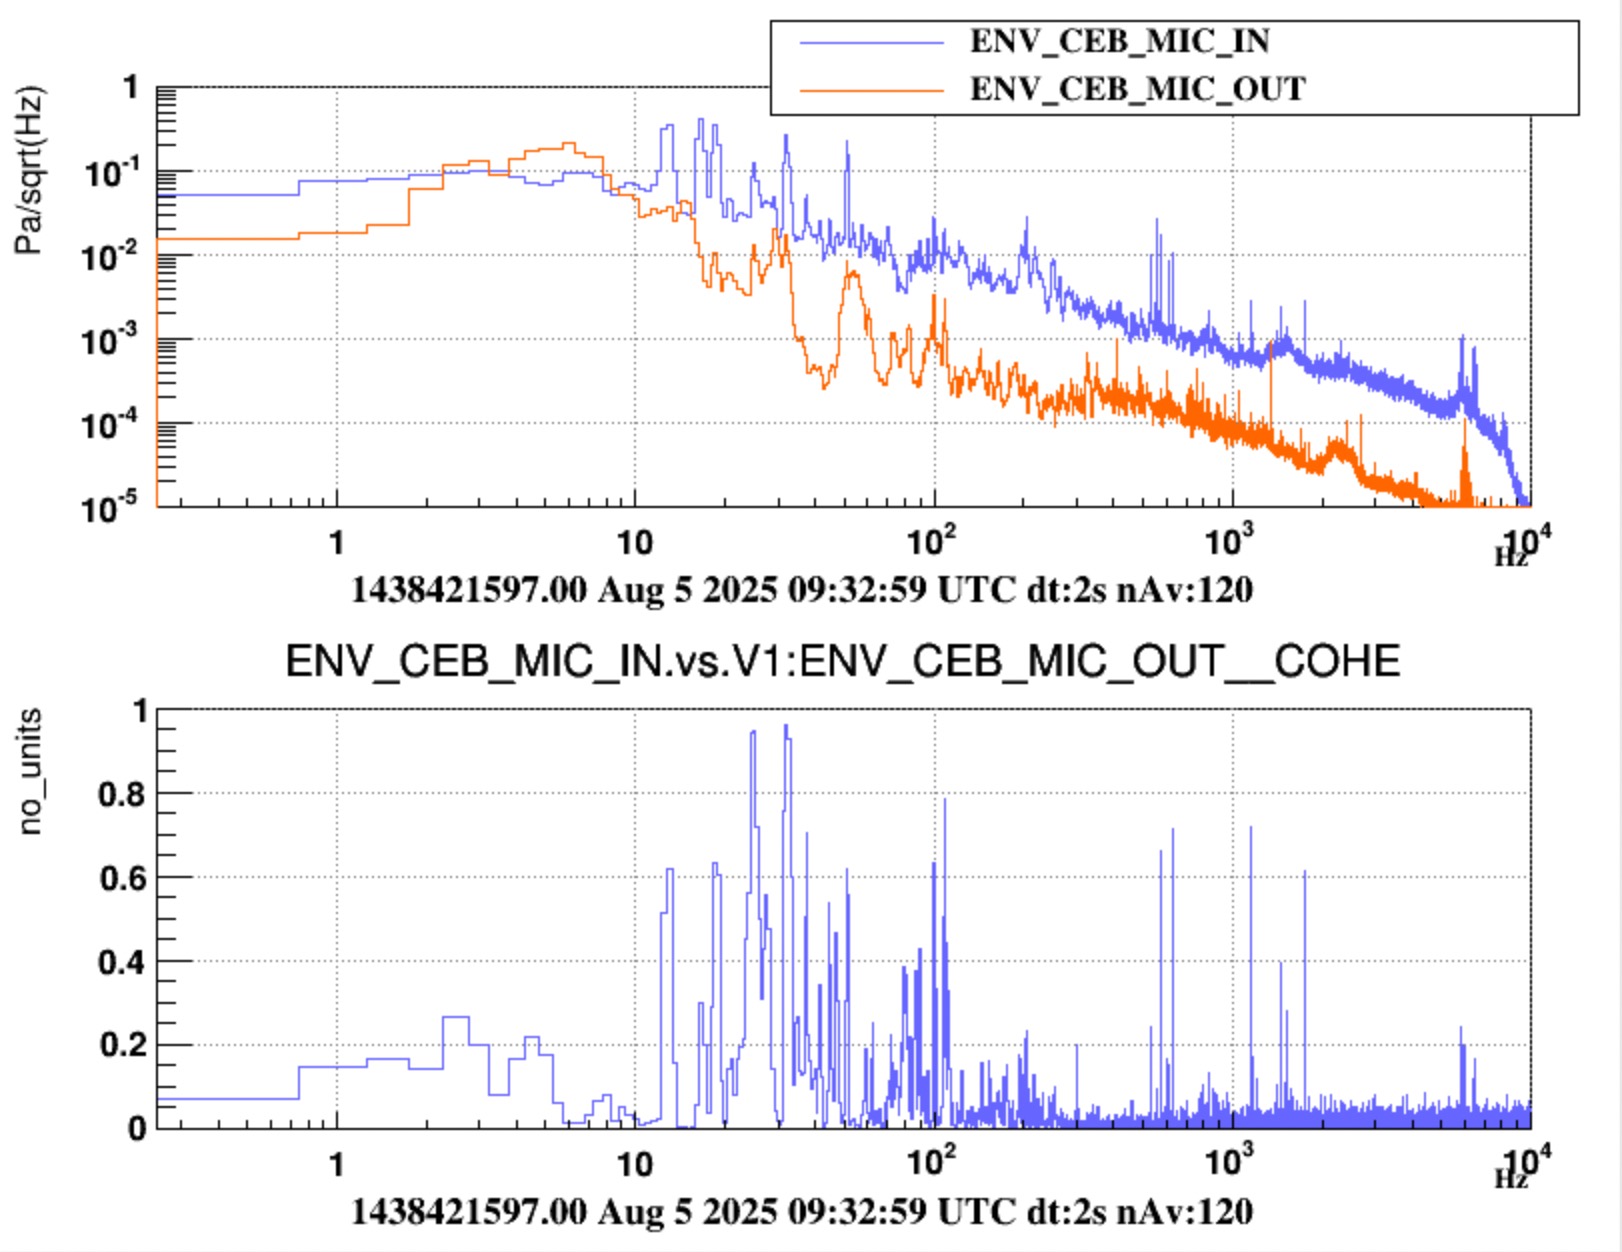
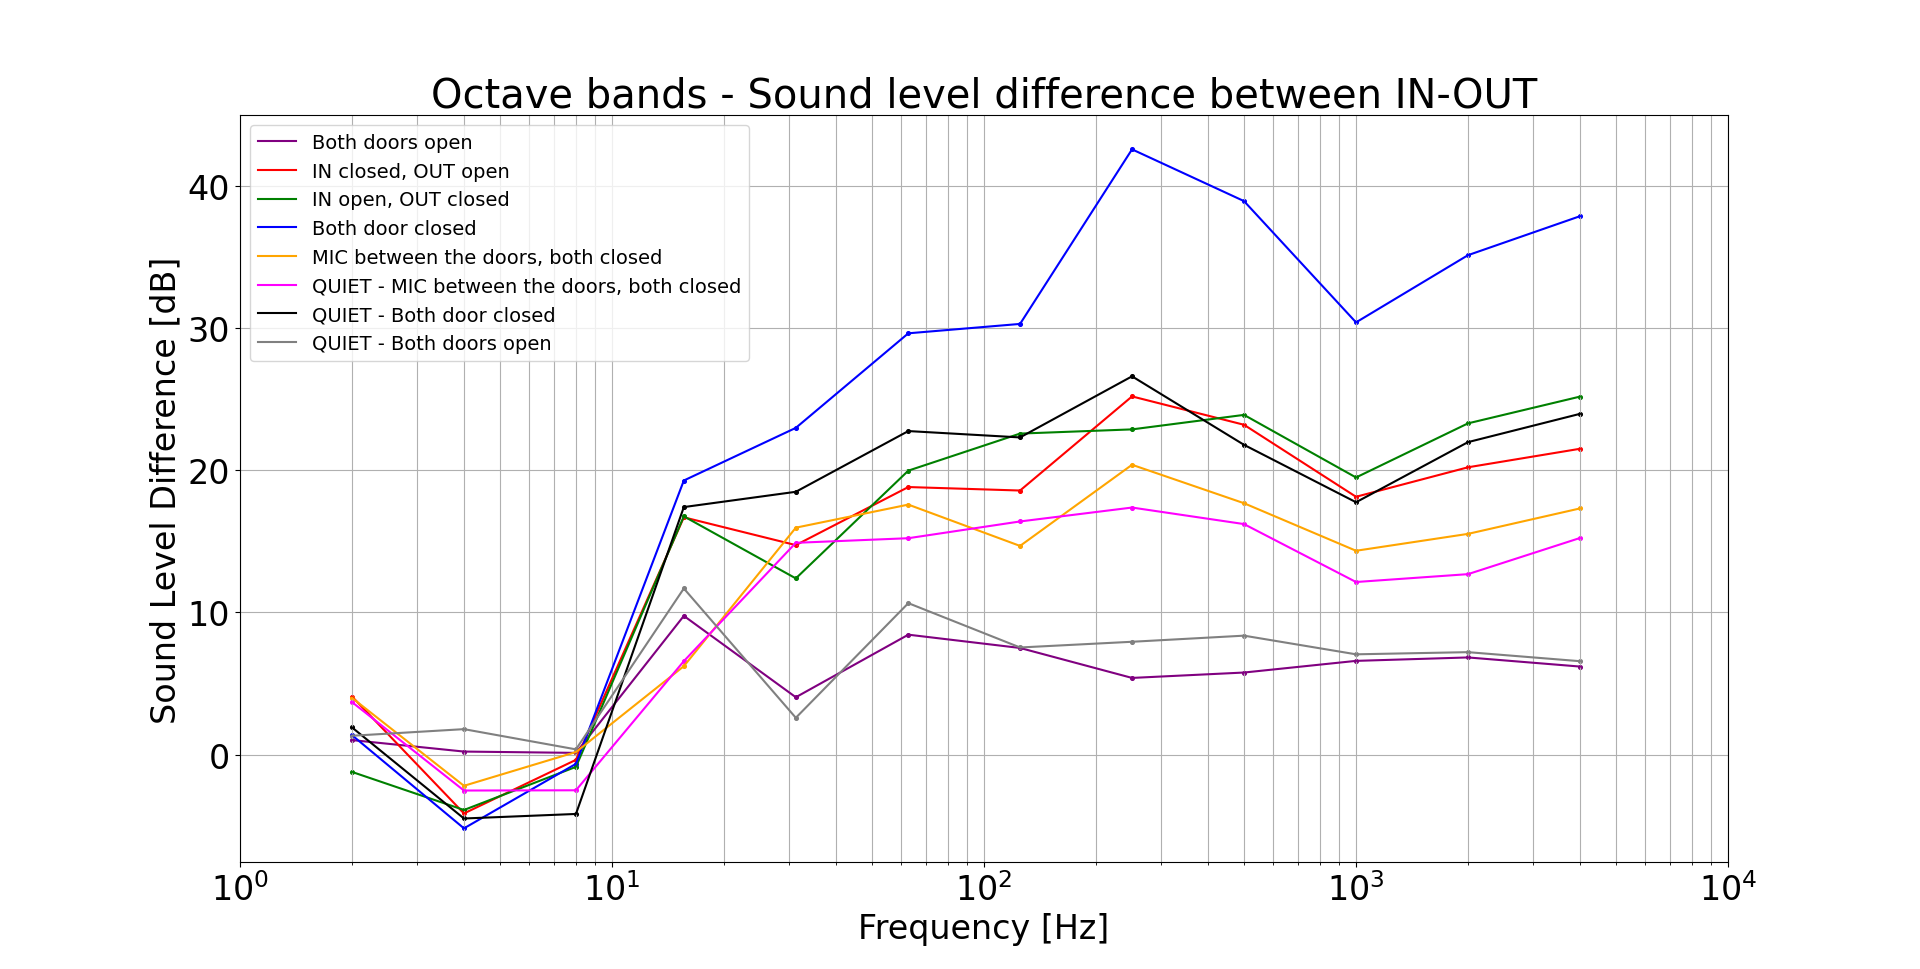
From the measured data Alessandro Loche computed the sound insulation spectra, here below. The spectra adopt the formalism used in Technical Acoustics, that is frequency is binned in Octave bands, and Insulation is computed with the formula:
D = Lp_1 - Lp_2, so-called sound level Difference, units of acoustic dB
where: Lp_1 is the sound pressure level measured in the source room (where the loudspeaker, and AHU is located), Lp_p is the sound pressure level measured in the receiver room (i.e. the atrium of CEB Towers Level)). Specifically, Lp [dB] is defined in the standard way as:
Lp = 20 log_10 (P/Pref), where: P is the sound pressure (Pa) and Pref = 20 microPa.
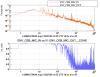
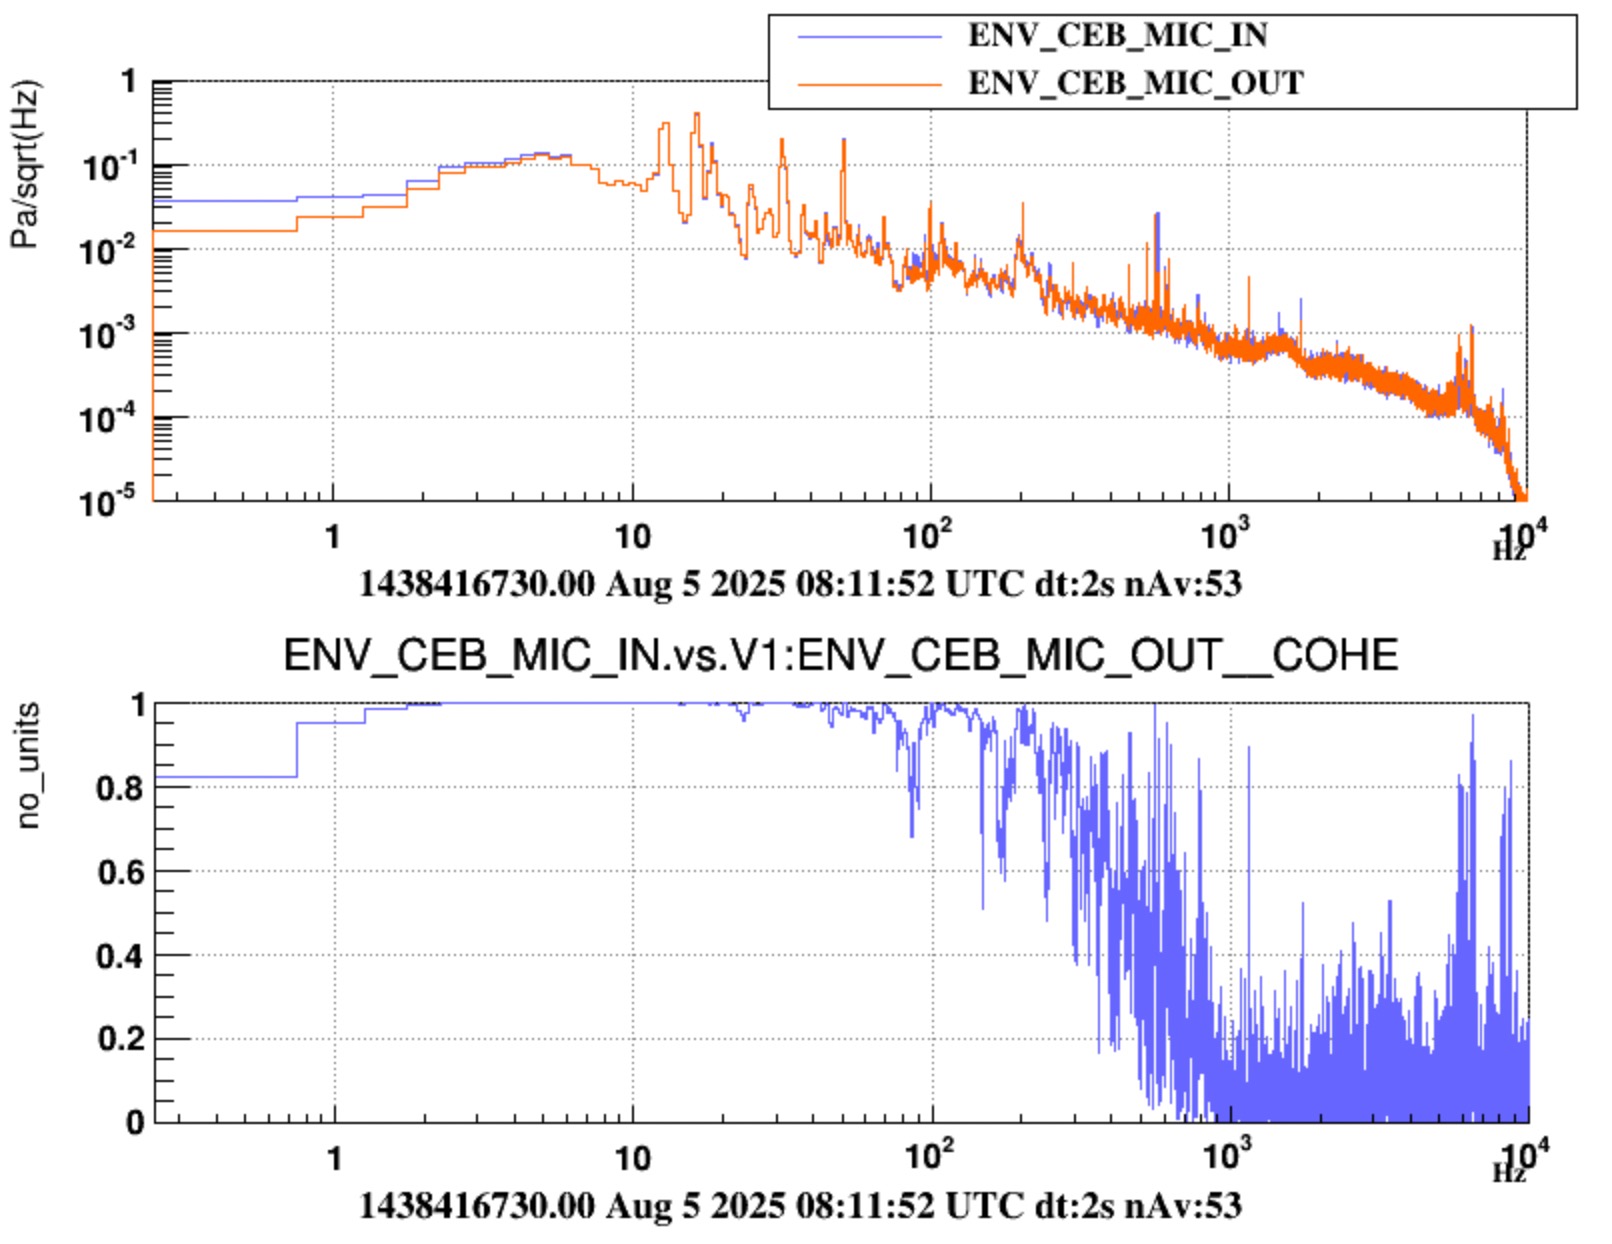
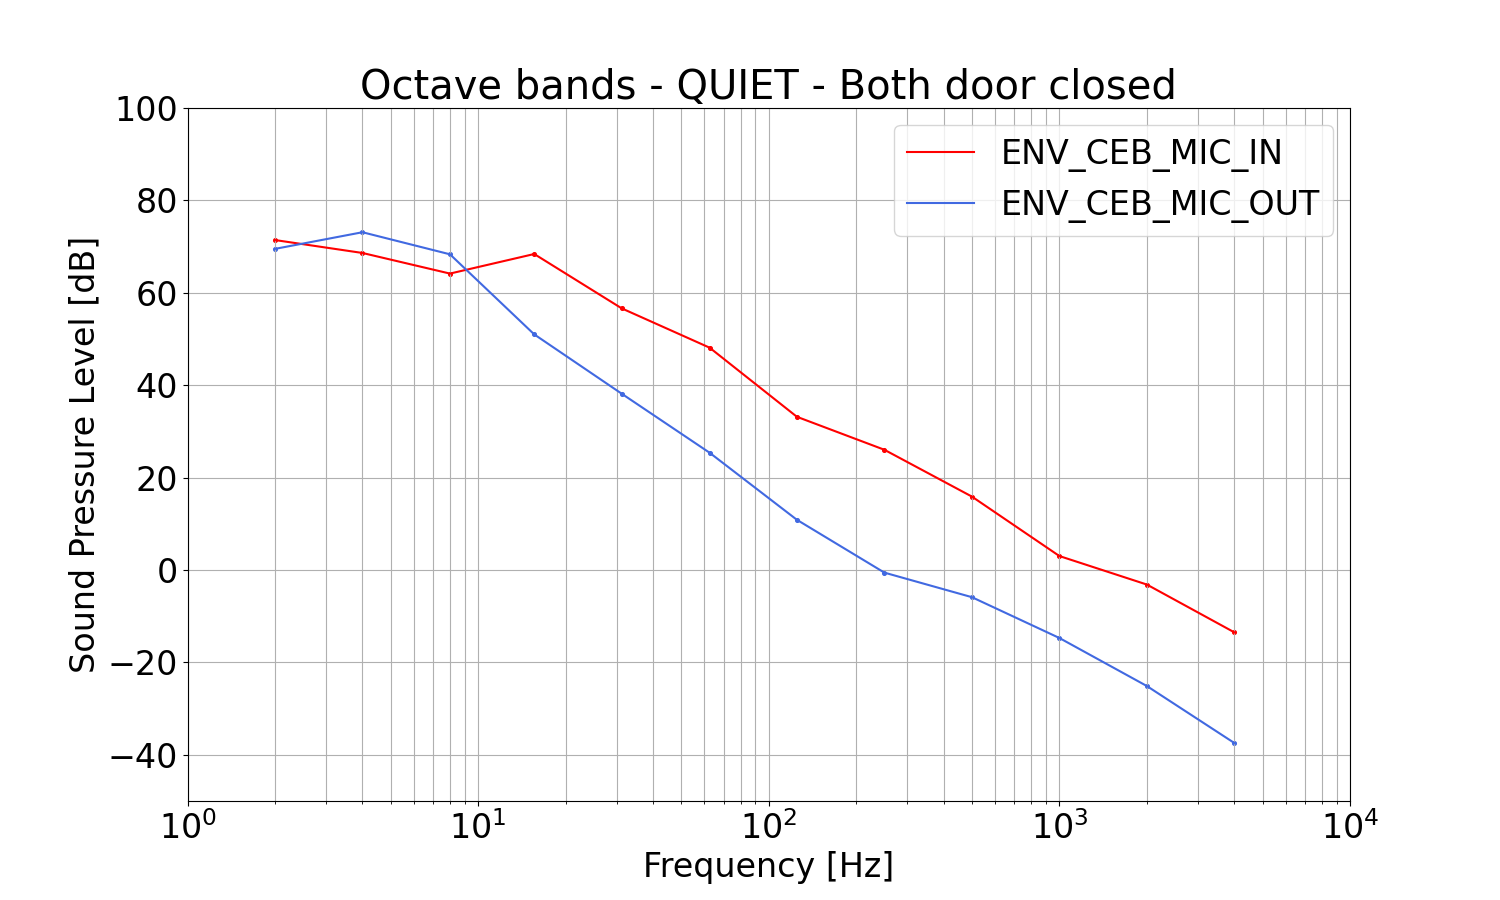
The first figure shows the Lp_1 and Lp_2 measured when no injection is made, so just measuring the ambient noise in the AHU room (mic "_IN") , and the Atrium room (mic "_OUT"), when both the doors are closed.
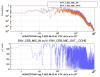
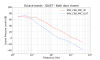
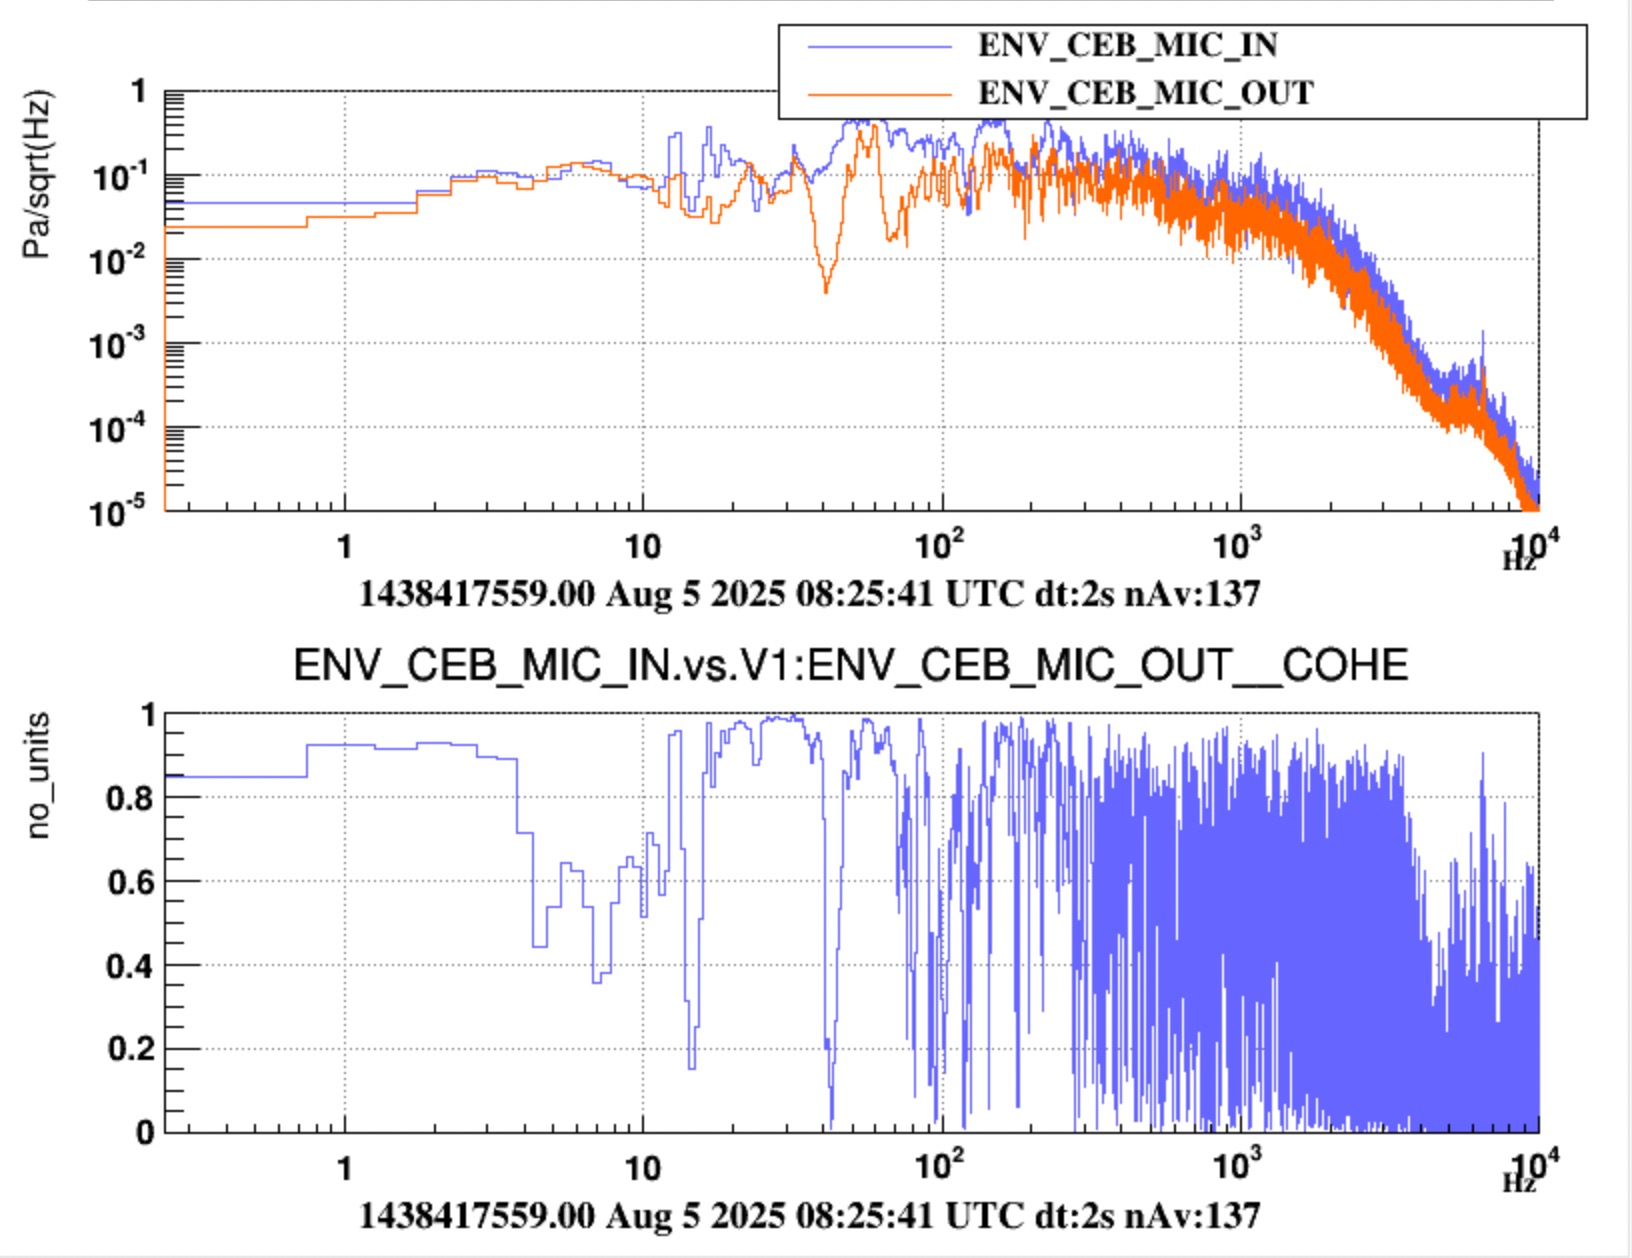
The second figure illustrates the "D" curves measured for various configurations of doors, and during the loudspeaker injections, or during quiet time. The following comments apply:
- our measurement is effective in the range 30 Hz to 4 kHz, elsewhere the measurement was limited by the effectivenes of loudspeakers (below 30Hz) or the microphone sampling rate (20kHz)
- the lower values measured with the ambient (QUIET) noise are possibly due to the background noise in the receiver room contaminated by other sources
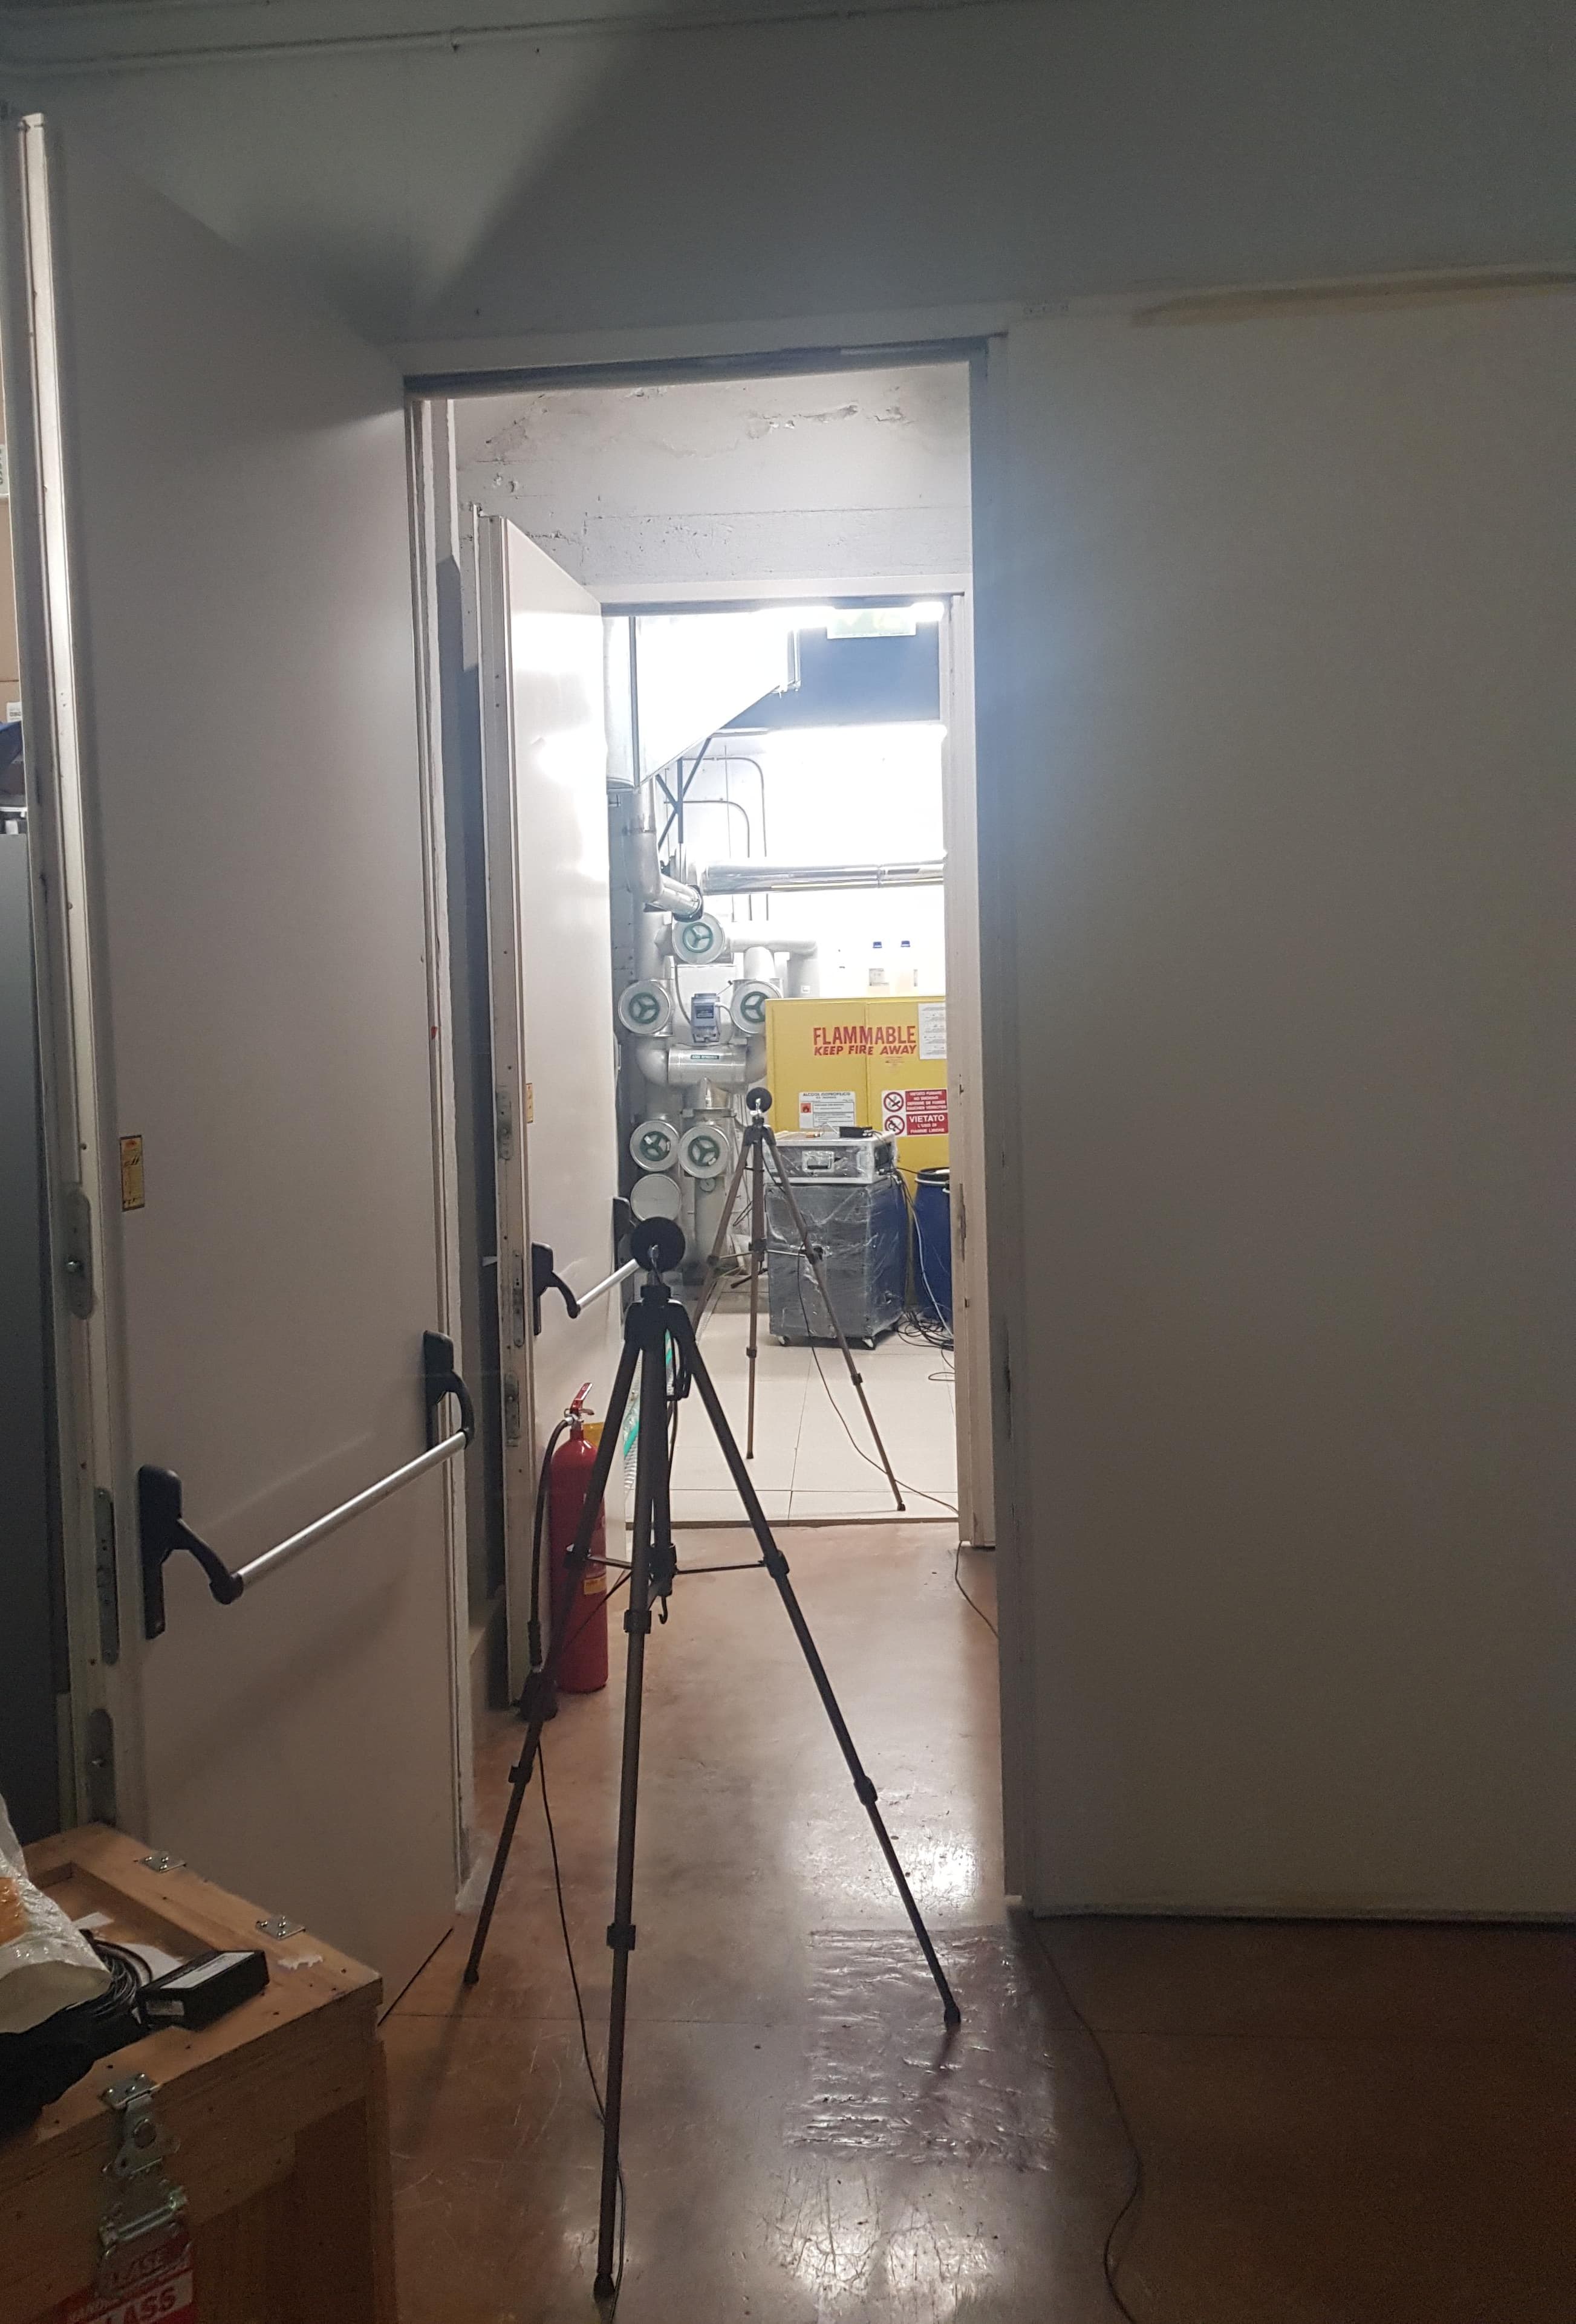
- the lowest curves correspond to both doors open, and essentially measure the free field attenuation of the acoustic field between the two microphones, which were placed ad approx. 4m distance
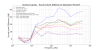
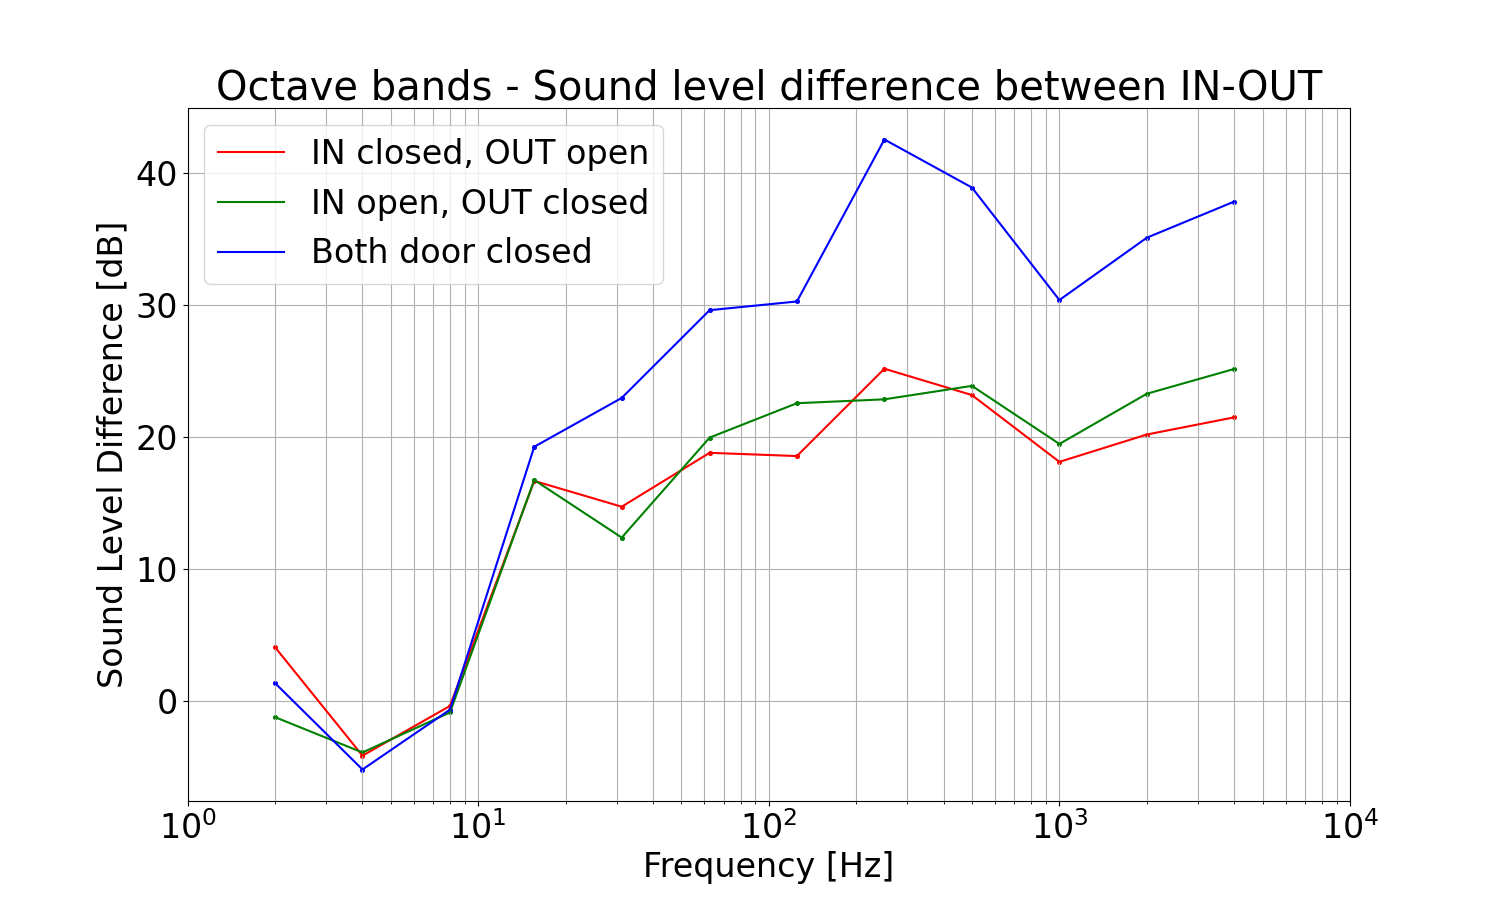
- the curves of more interest are those measured during the injection, which are reported again for clarity in Figure 3
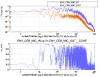
The third figure reports:
- the sound insulation measured by each single door: curves red and green. We notice that both perform quite similar
- the sound insulation offered by the both doors (i.e. when both are closed). We notice that the measured attenuation is approx. double that of the single door. This curve has to be considered as minimum acoustic requirement of the insulation of the two rooms.
We observe that all curves quite soon reach a plateau. In principle a more steep rise is expected. This behaviour is likely due to the "sound insulation losses" associated to the installation.
Our measurement of course includes all losses and does not compensate for the response of the ambient (i.e. reverberation time and sizes) which instead are not included in the "R" value provided in specs by the vendor, R = D + 10 log_10 ((S * T) / (0.16 * V)).
The last file contains all ascii data of Figure 3.