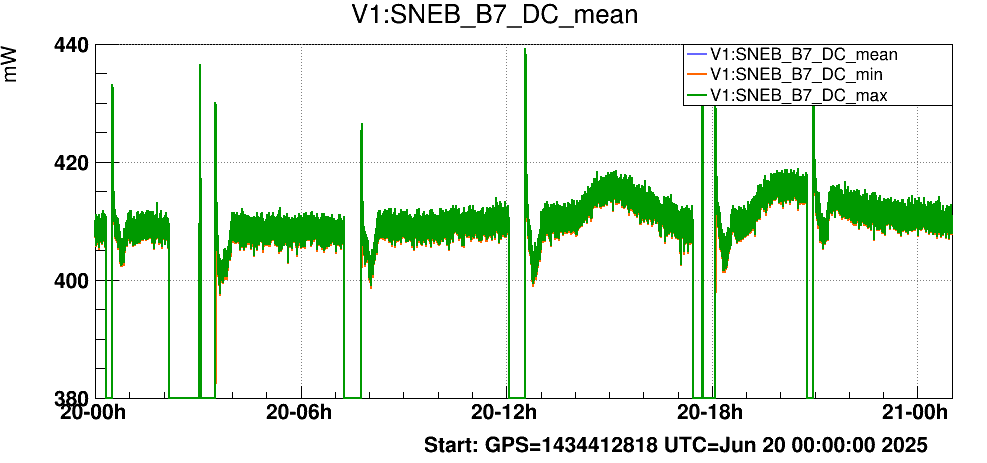
Figure 1. During the transient the power in the arms increased by 1%. This is most likely the sign that the input beam is not well mode matched with the arms, and that for different end mirror radius of curvature the matching becomes better. As we change only the end mirror radius of curvature, this corresponds to a mode that has the same wavefront curvature at the level of the input mirror (parallel to the mirror surface), but a different beam radius at the level of the input mirror.
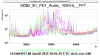
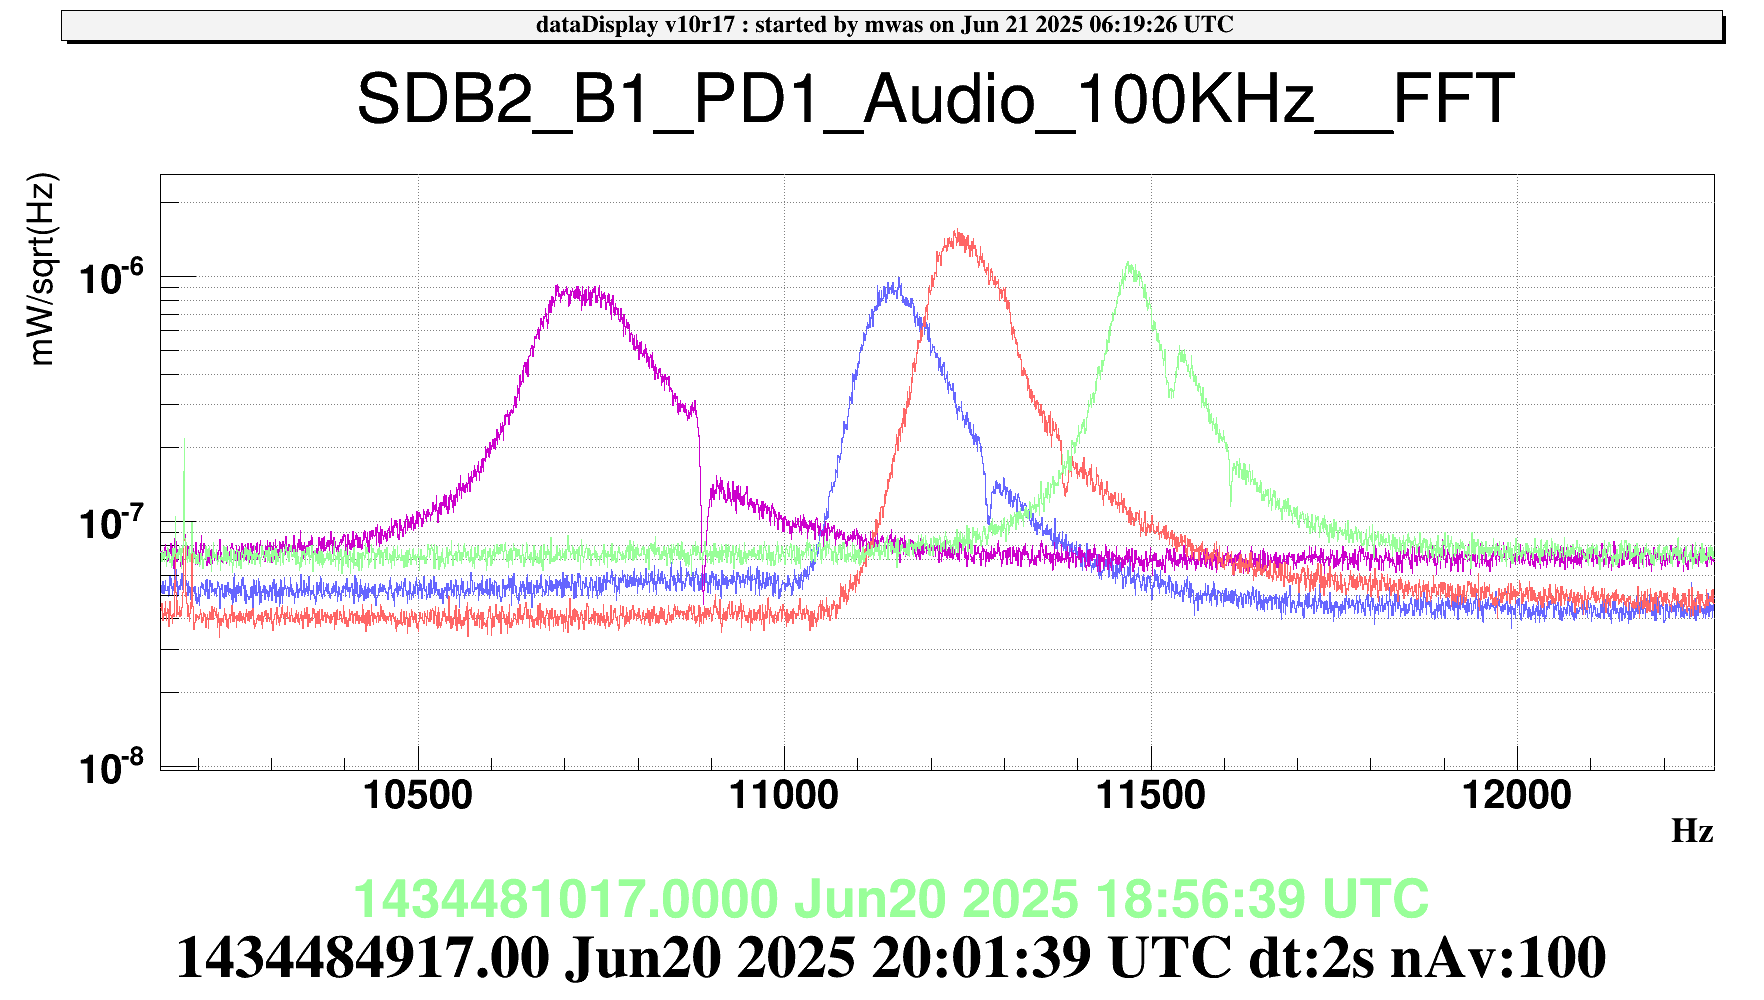
Figure 2 shows the effect on the mode order 2 frequency. Purple is before the step, blue and red are roughly when the power in the arms is maximum during the transient (red is RH cooling and blue is RH warming), green is the maximum excursion of the RH change, ie two minutes before the ring heater was put back to the nominal correction. The maximum excursion corresponds to an 800Hz change in the mode frequency, which should correspond to a 14 meter change in radius of curvature. The peak in arm powers corresponds to 500Hz frequency change, or 8 meters in radius of curvature.
Using equation (53) of [H. Kogelnik and T. Li, "Laser Beams and Resonators," Appl. Opt. 5, 1550-1567 (1966) ] an 8 meter increase in EM radius of curvature correspond to 2.5% decrease in the resonant mode radius at the surface of the input mirror. Which means that to match the arm mode in nominal condition the input beam radius at the IM surface needs to be increased by 2.5%.
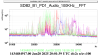
Figure 3 and 4 shows mode order 6 and 7, they are moving in opposite direction to the order 2 mode, which is not what one would expect from a simple radius of curvature change. And they also move by a smaller amount, about 1kHz instead of 2kHz. This means that the mode order 9 most likely did not move by the expected 3kHz. This effect of modes moving in opposite direction has already been seen for previous steps https://logbook.virgo-gw.eu/virgo/?r=66937. My guess is that it means the ring heater actuation far from the mirror center is not well approximated by a simple radius of curvature change (parabolic change), but that there is a more complicated shape and modes of high order are able to sense that.
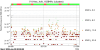
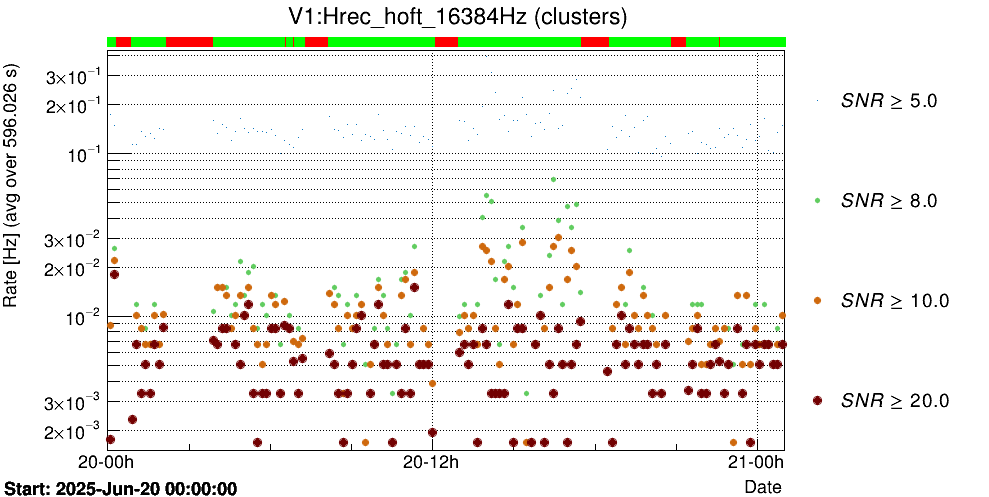
Figure 5 in the meantime there was not a significant decrease in glitches during that test at any time, if anything there was an increase for part of that time.
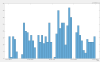
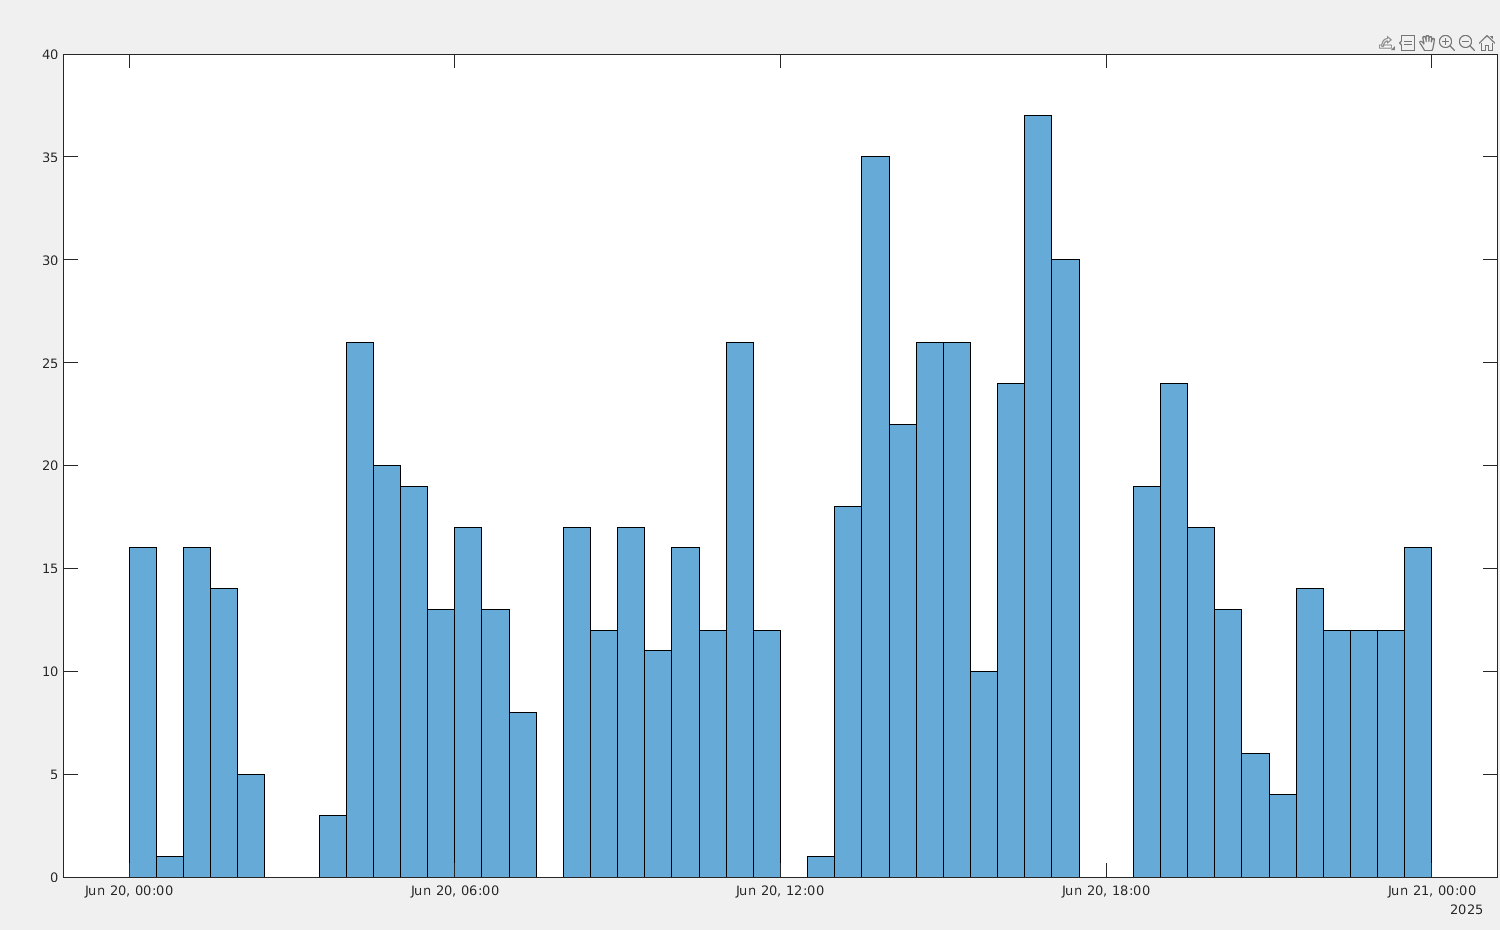
Figure 6 is a simple histogram of the glitches with SNR>10 during that day with bins of 30 minutes, without taking into account that the interferometer is not locked some of the time. There is no significant improvement during the test on that figure either. A year ago such a histogram would have 1 or 2 glitches per bin (the 25 minute glitches).

