Reports 1-1 of 1 Clear search Modify search
AdV-TCS (Point Absorbers Mitigation)
melo, nardecchia, spinicelli, tomelleri - 21:01 Thursday 19 June 2025 (67057) Print this report
Commissioning of IPATSiA setup at WE

This afternoon, in agreement with Michal, we spent approximately 3 hours working on IPATSiA.

With the ITF in LN3, we carried out the following tasks:

  • Completed the electronic cabling for the switching on of the CO₂ laser, two power meters, and the flip mirror, without unlocking the ITF.

  • Verified that the chiller can effectively cool down the laser --> test passed.

Below is the list of actions performed in chronological order, with approximate timings:

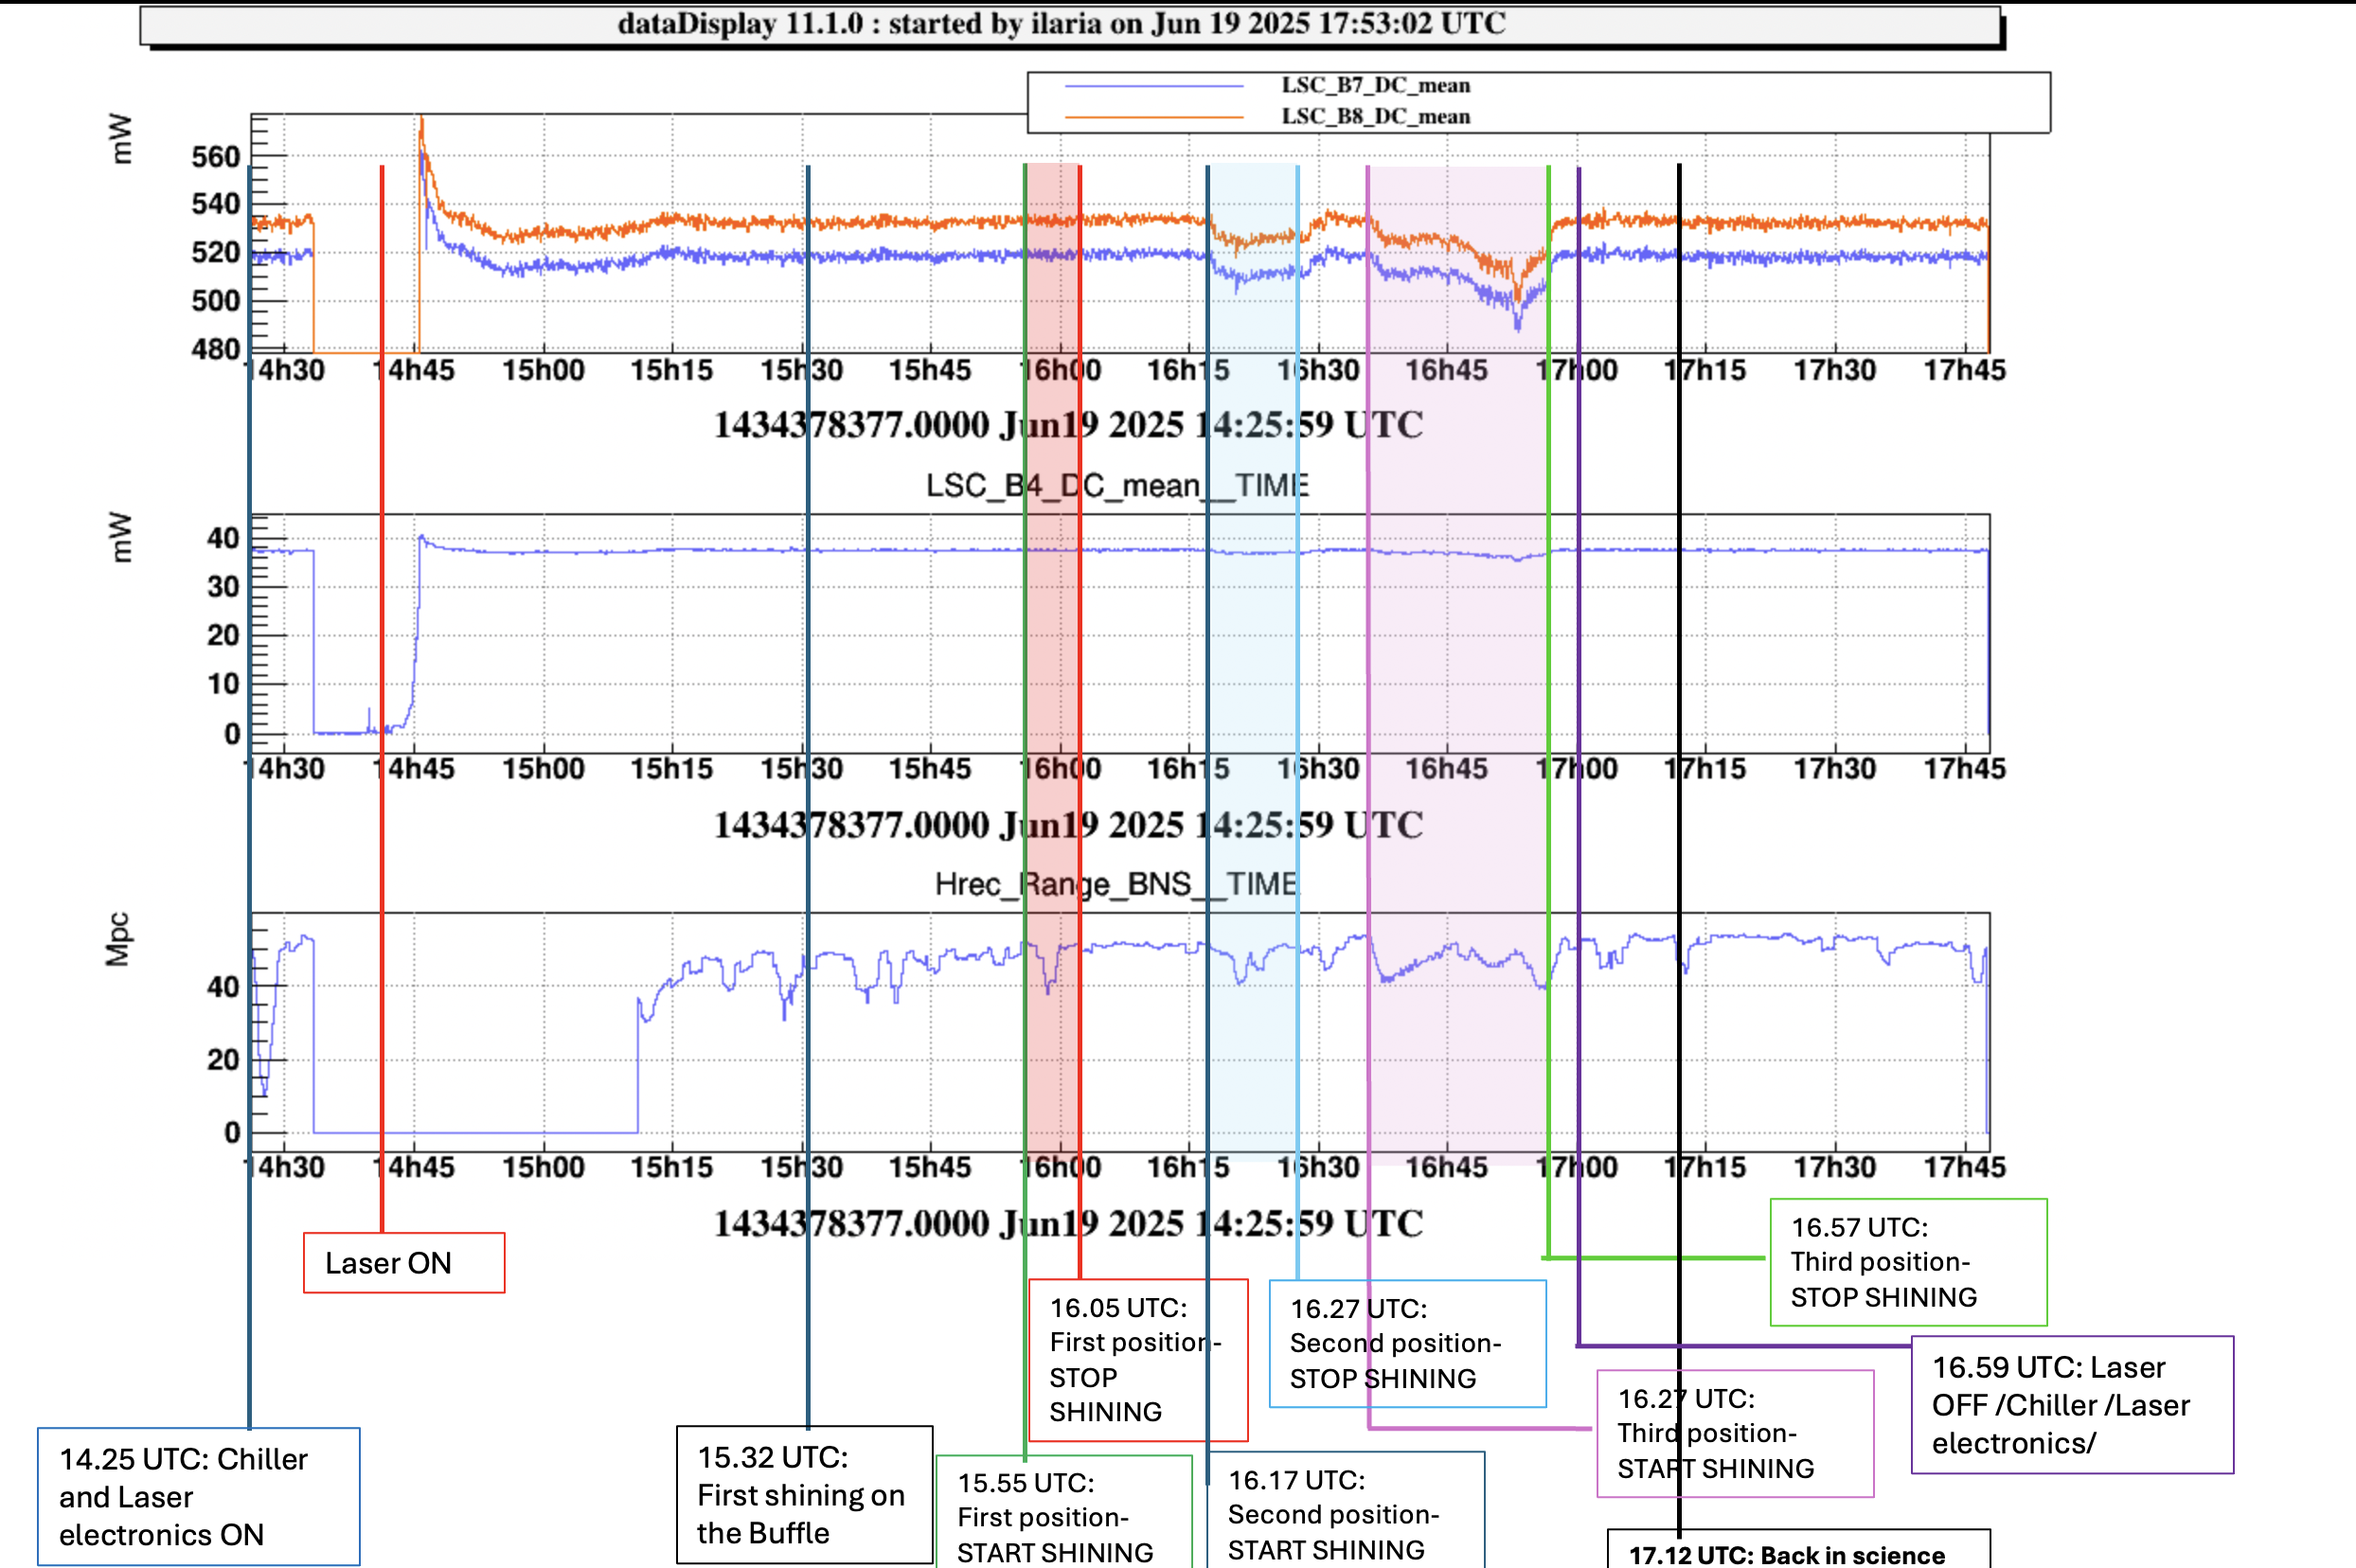
  • 14:25 UTC: Chiller ON

  • 14:25 UTC: Laser electronics ON

  • 14:33 UTC: ITF unlocked from LN3

  • 14:40 UTC: CO₂ laser ON

  • 15:20 UTC: ITF locked in LN3

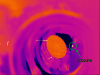
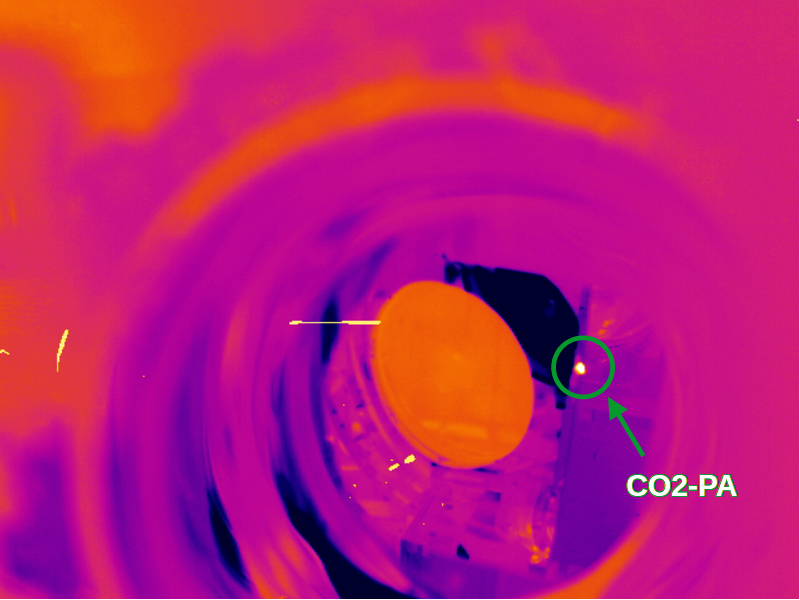
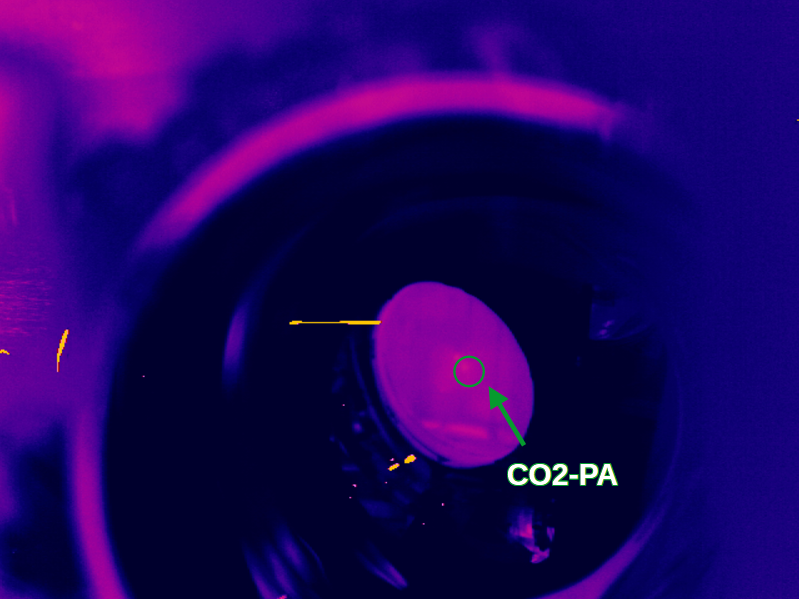
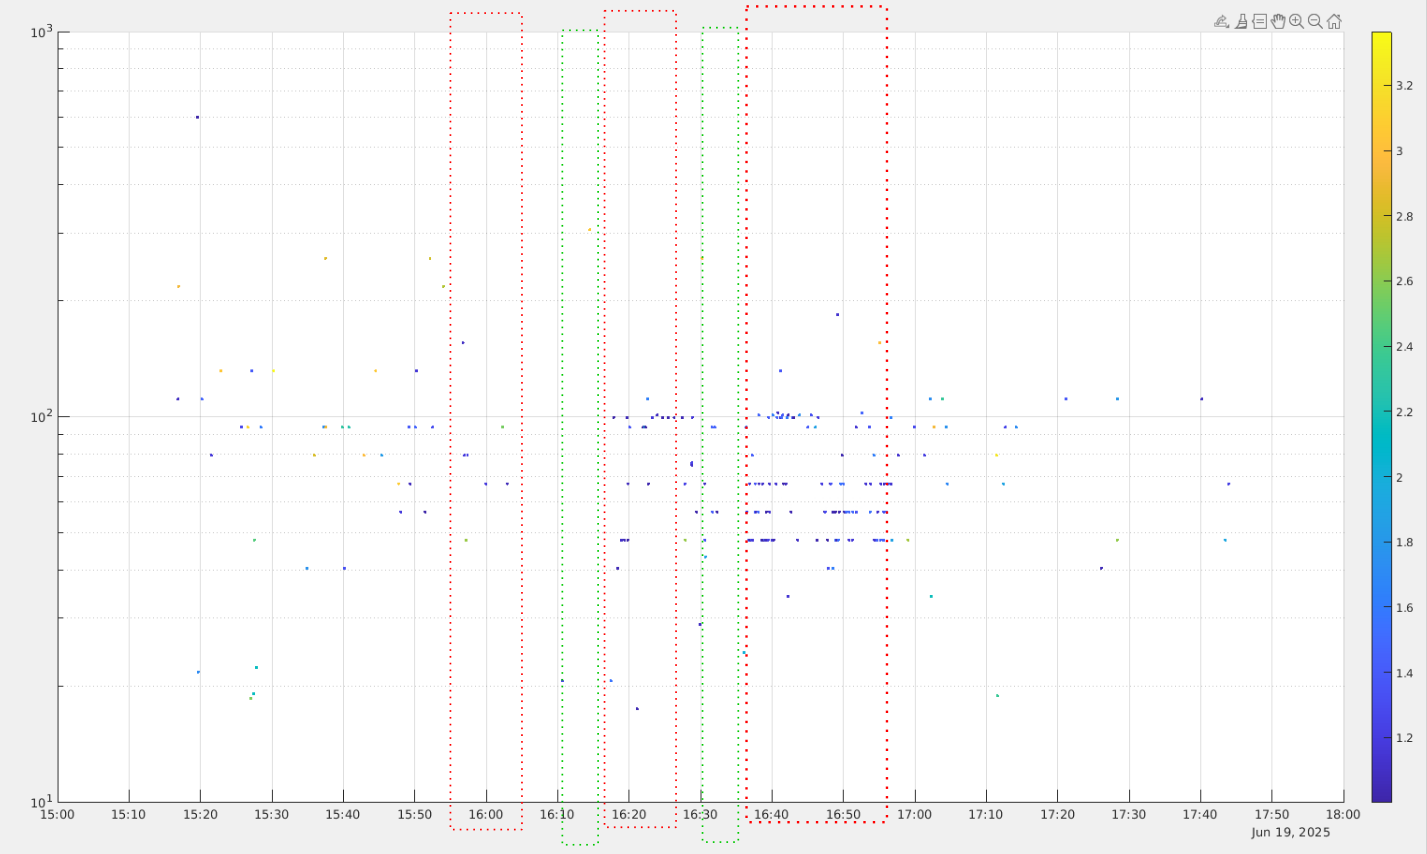
We started shining the mirror with the CO2-PA at around 15:32UTC with the minimal power (estimated at less than 10 mW on the TM). As shown in Fig. 1, the thermo-camera revealed a spot initially located on the external baffle.
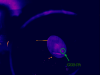
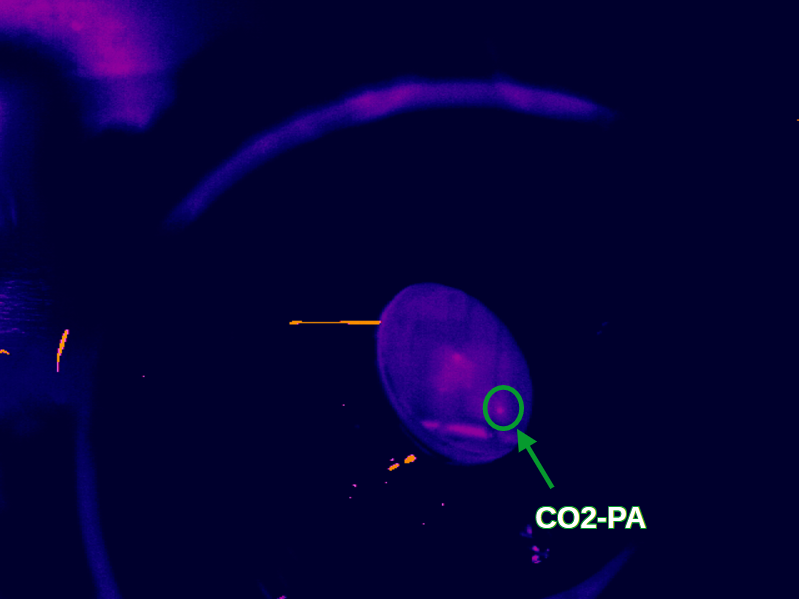
By tuning the position of the last mirror (MX) and slightly increasing the power (~30 mW), at 15:55:13 UTC we managed to observe the spot on the edge of the TM (see Fig. 2).
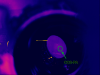
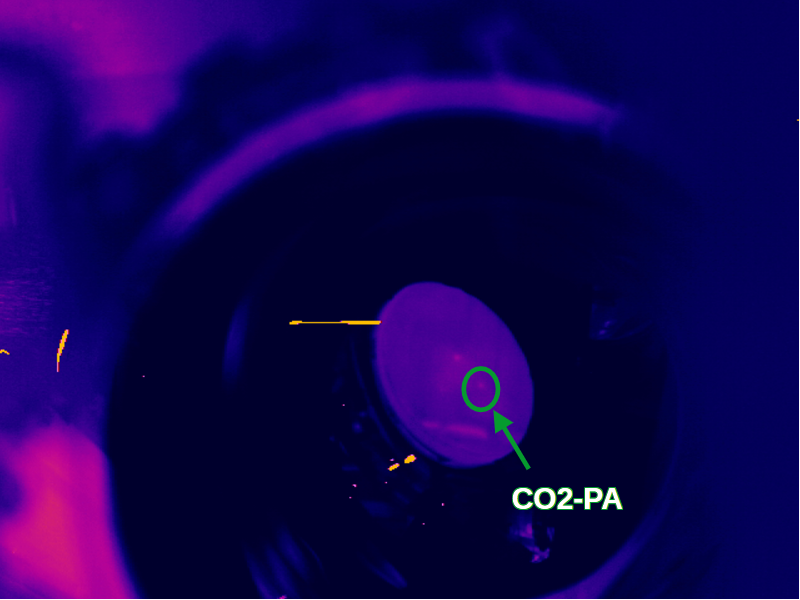
We kept the laser on the TM for about 10 minutes, then moved to a more centered point (Fig. 3). At 16:11:00 UTC we closed the flip mirror for 5 minutes to allow the mirror to cool down.
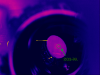
At 16:17:26 UTC, we opened the flip mirror again for 10 minutes (see Fig. 4).

We moved further toward the center and, after another thermalization period (CO2-PA off at 16:30:41 for 5 minutes), we projected the PA again onto the TM for 20 minutes (see Figs. 5–7).
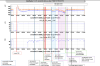
We stopped at 16:56:46 UTC and completely switched off IPATSiA:

  • 16:58 UTC: CO₂ laser OFF

  • 16:59 UTC: Chiller OFF

See Figure 8 for a summary of the actions performed.


Images attached to this report
Non-image files attached to this report
Comments to this report:
mwas - 8:17 Friday 20 June 2025 (67060) Print this report

There have been many glitches during that test. I have read the glitches with SNR greater than 10 using omicron-print. And plotted them in matlab, with frequency on the y-axis, and log10 of the SNR in color scale.

Figure 1 shows the result, with roughly overlaid on top the three periods of data taking with the CO2 point absorber fixed as a red dotted rectangle, and the two cool down periods with the CO2 beam off as green dotted rectangles. I guess the few minutes in between a red rectangle and a green rectangle are one the CO2 beam was moving, and the small gaps between a green rectangle and a red one are inacurrate positing of the rectangles.

There seems to be more glitches as the CO2 beam is closer to the center. I don't know what that means. It cannot be a simple explanation that the CO2 laser is glitchy and it pushes on the test masses, as in that case the glitch rate would be the same regardless of the beam spot location on the mirror.

omicron-print channel=V1:Hrec_hoft_16384Hz gps-start=`lalapps_tconvert Jun 19 15:15` gps-end=`lalapps_tconvert Jun 19 17:45` snr-min=10 print-q=1 > glitches1.txt

/users/mwas/detchar/hoftGlitch_20250620/plotGlitches.m

Images attached to this comment
Search Help
×

Warning

Error

The present report has been modified outside this window. Please check for its integrity in the main page.

Refreshing this page will move this report into drafts.

×