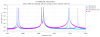
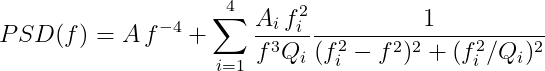
I performed a quantitative estimate of the quality factor variation using Lorentzian fitting. The model used is a sum of a power-law baseline and four Lorentzians, each convolved with an f^−2 response to account for interferometer response. The model is as follows around the frequencies of the drum modes:
Figure 5 (LaTeX equation)
where f_i is the frequency of the drum mode 3 for each test mass, and Q_i their quality factors.
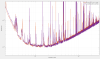
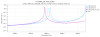
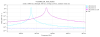
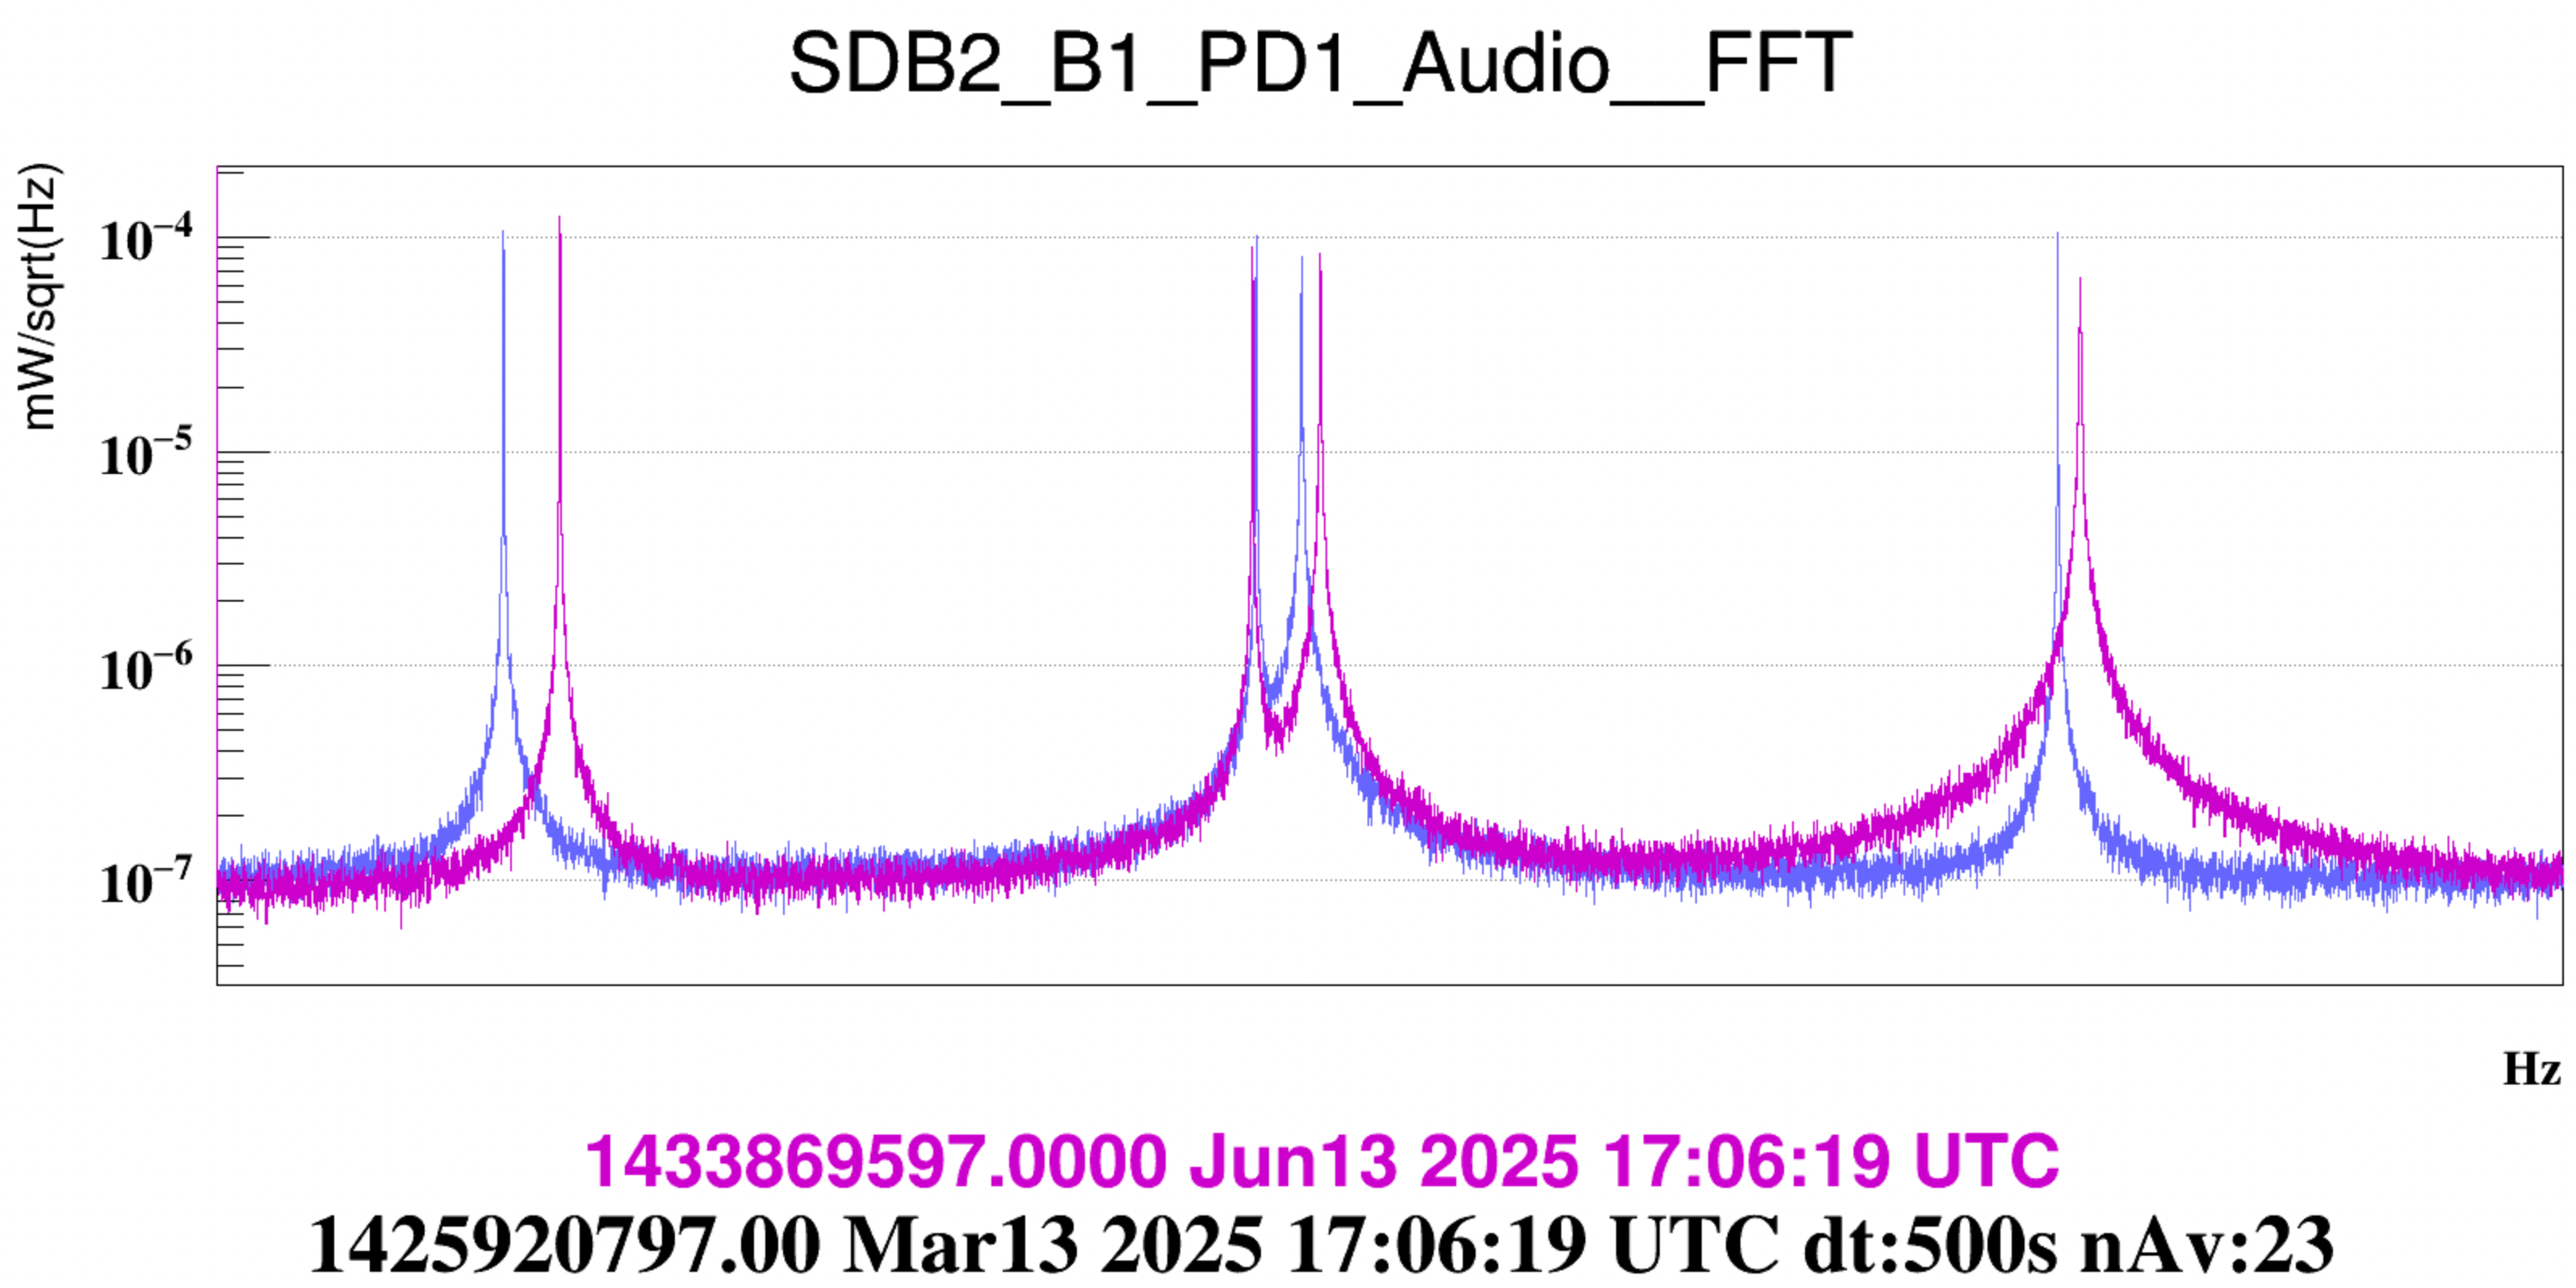
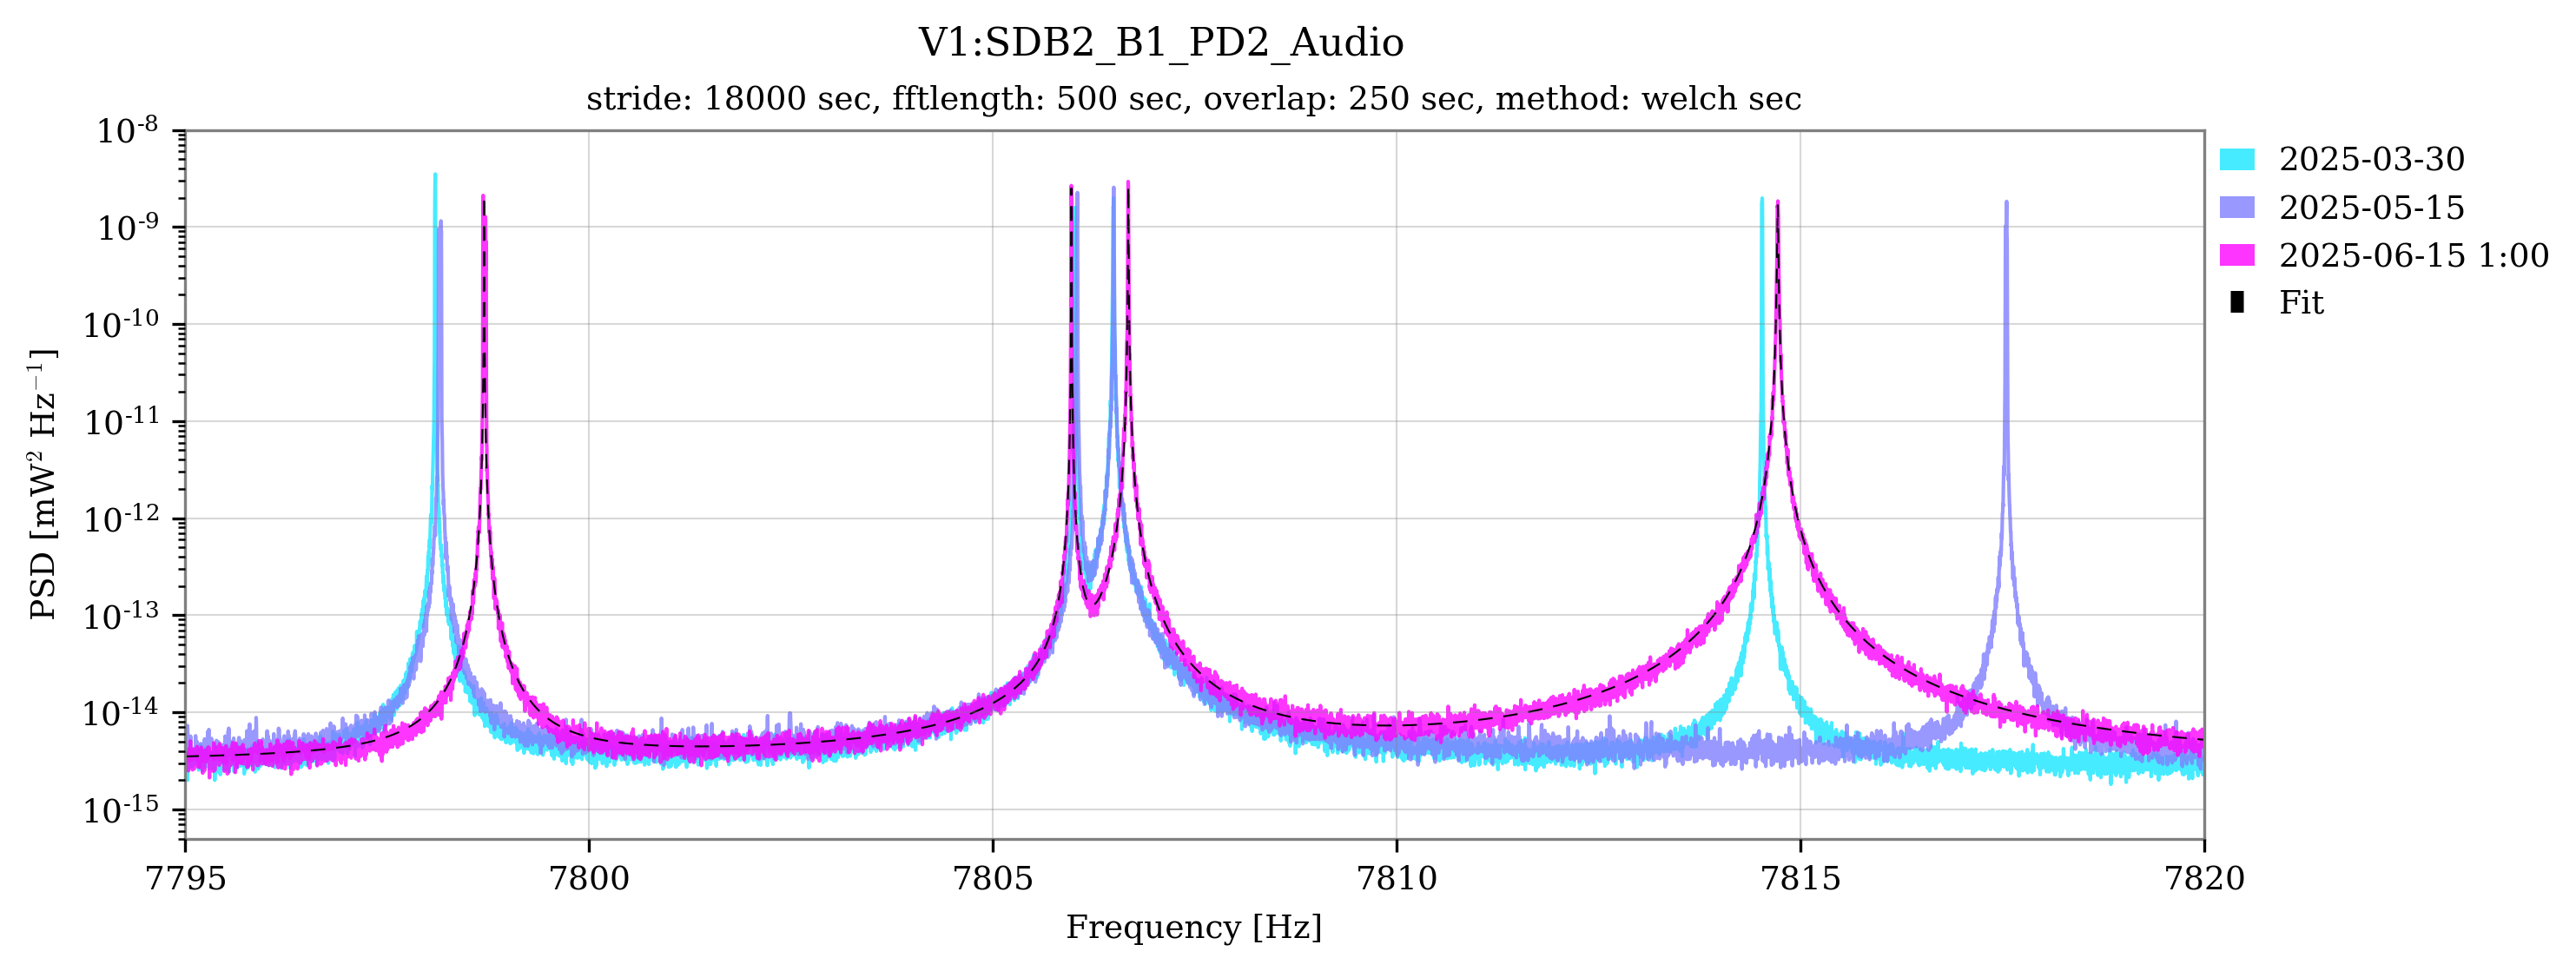
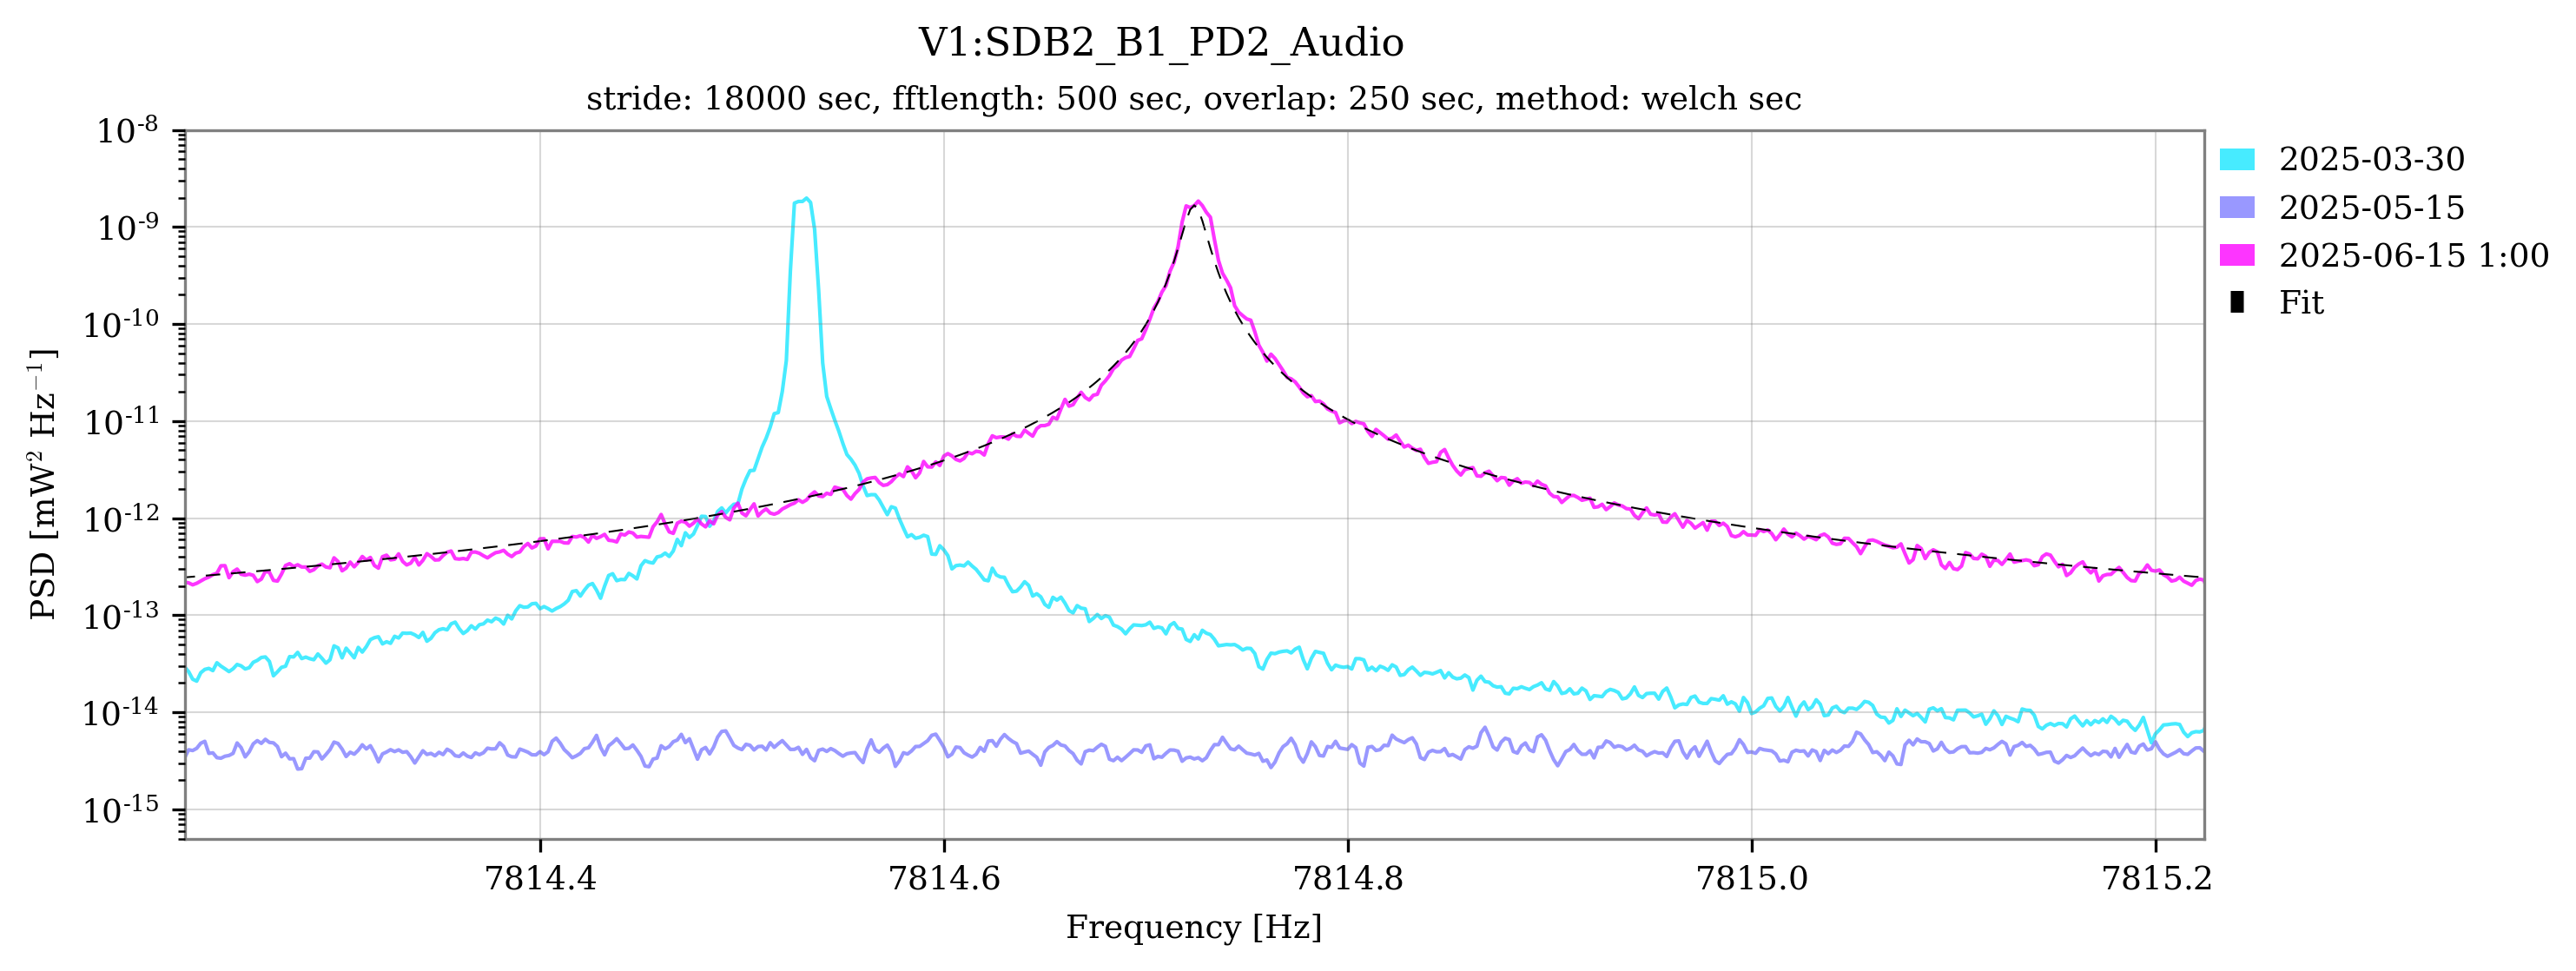
Figure 1 shows the PSDs of the V1:SDB2_B1_PD2_Audio channel around the frequency of drum mode 3 of the test masses, across three different periods, late March (with the original WE mirror), mid-May (with the replacement WE mirror), and early June (with the old NE mirror reinstalled at WE). Besides a slight drift in frequency, it's evident that the current WE mirror exhibits a lower quality factor, as discussed by Fiodor and Michal in the previous entries.
Fit Results Summary:
Baseline: A = 11.
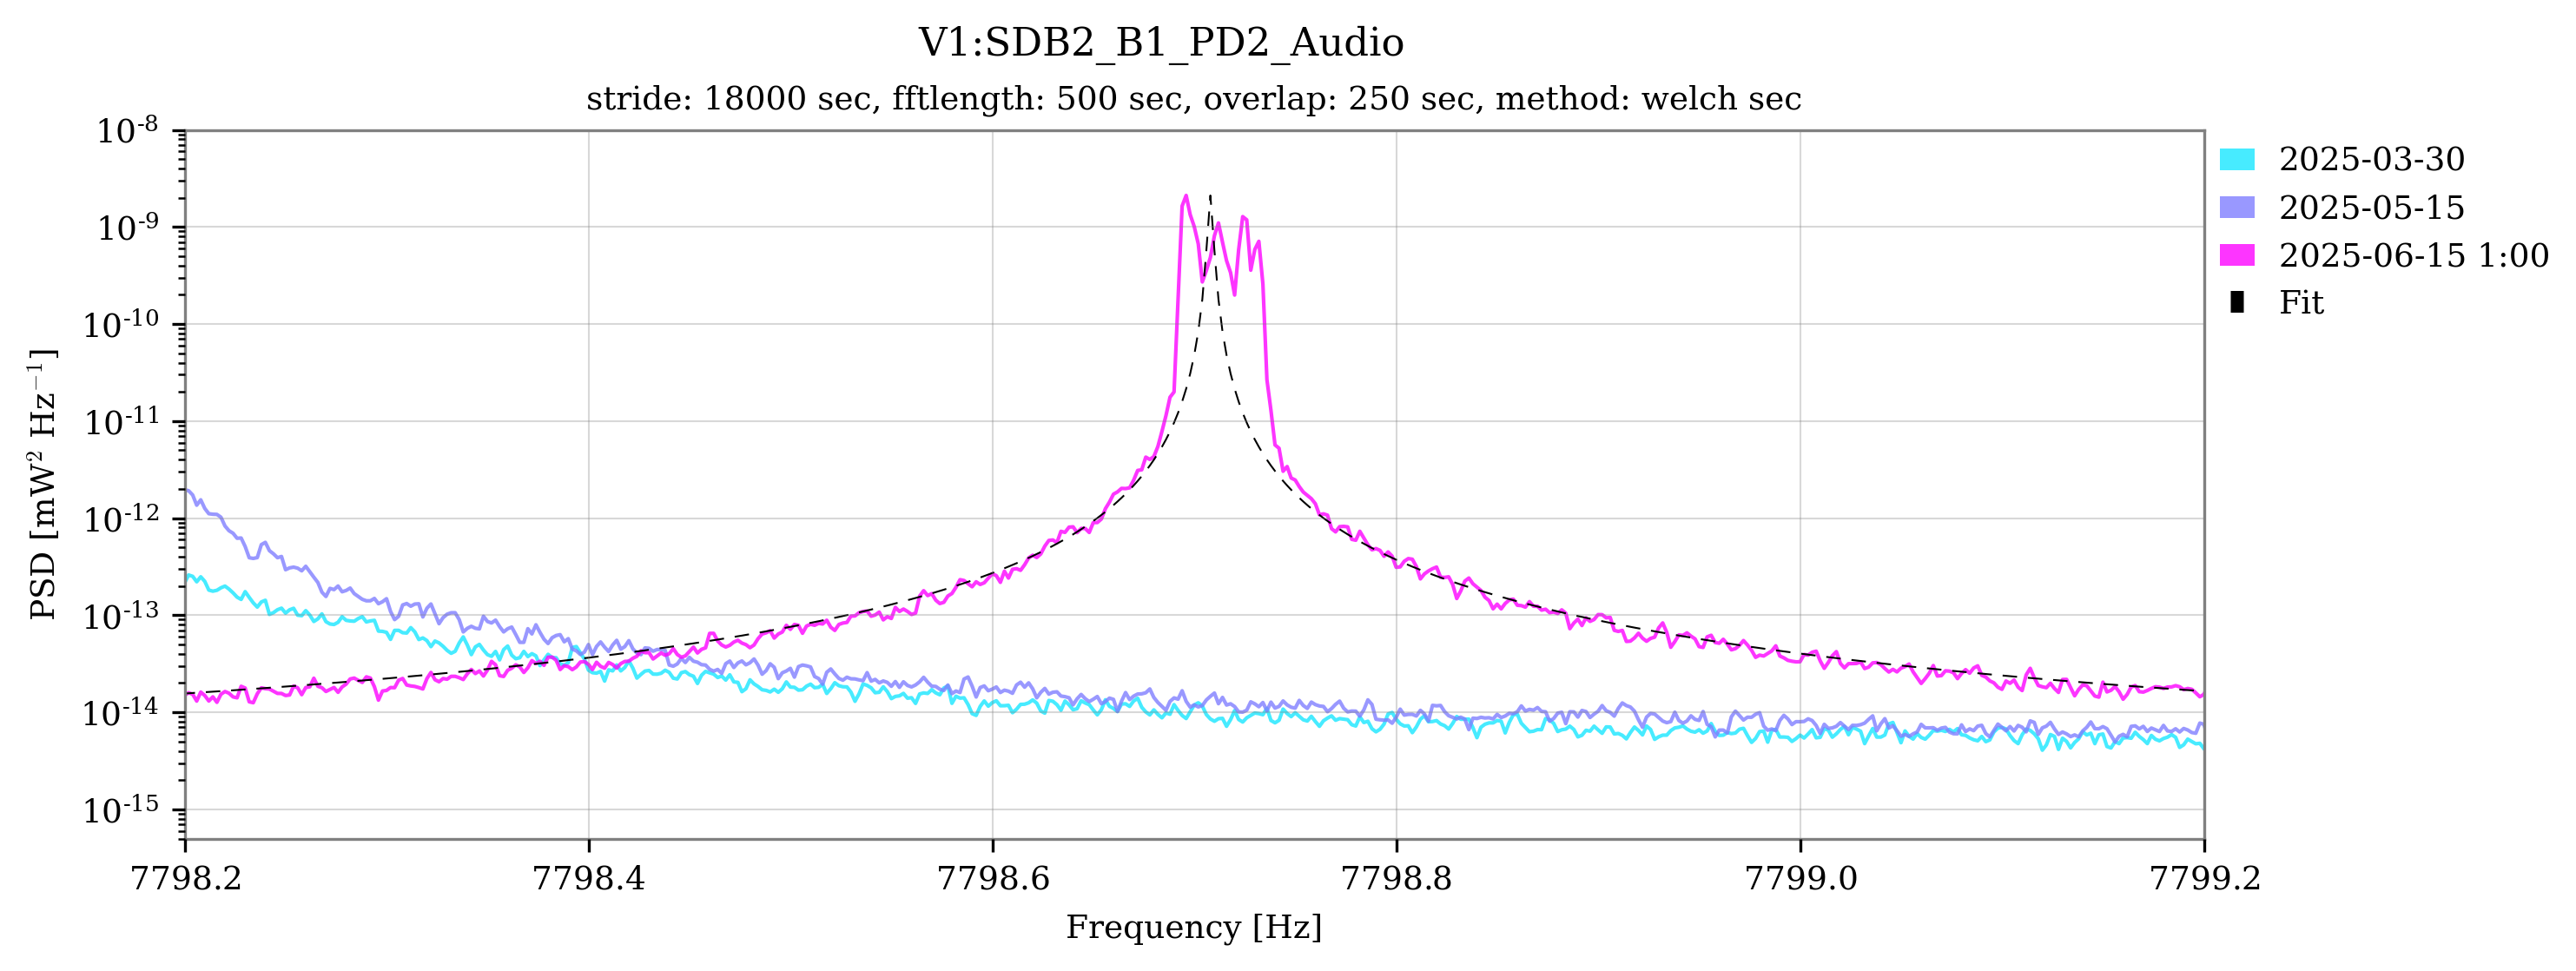
Mass 1: A_1 = 19e3, Q_1 = 32e5, f_1 = 7798.708,
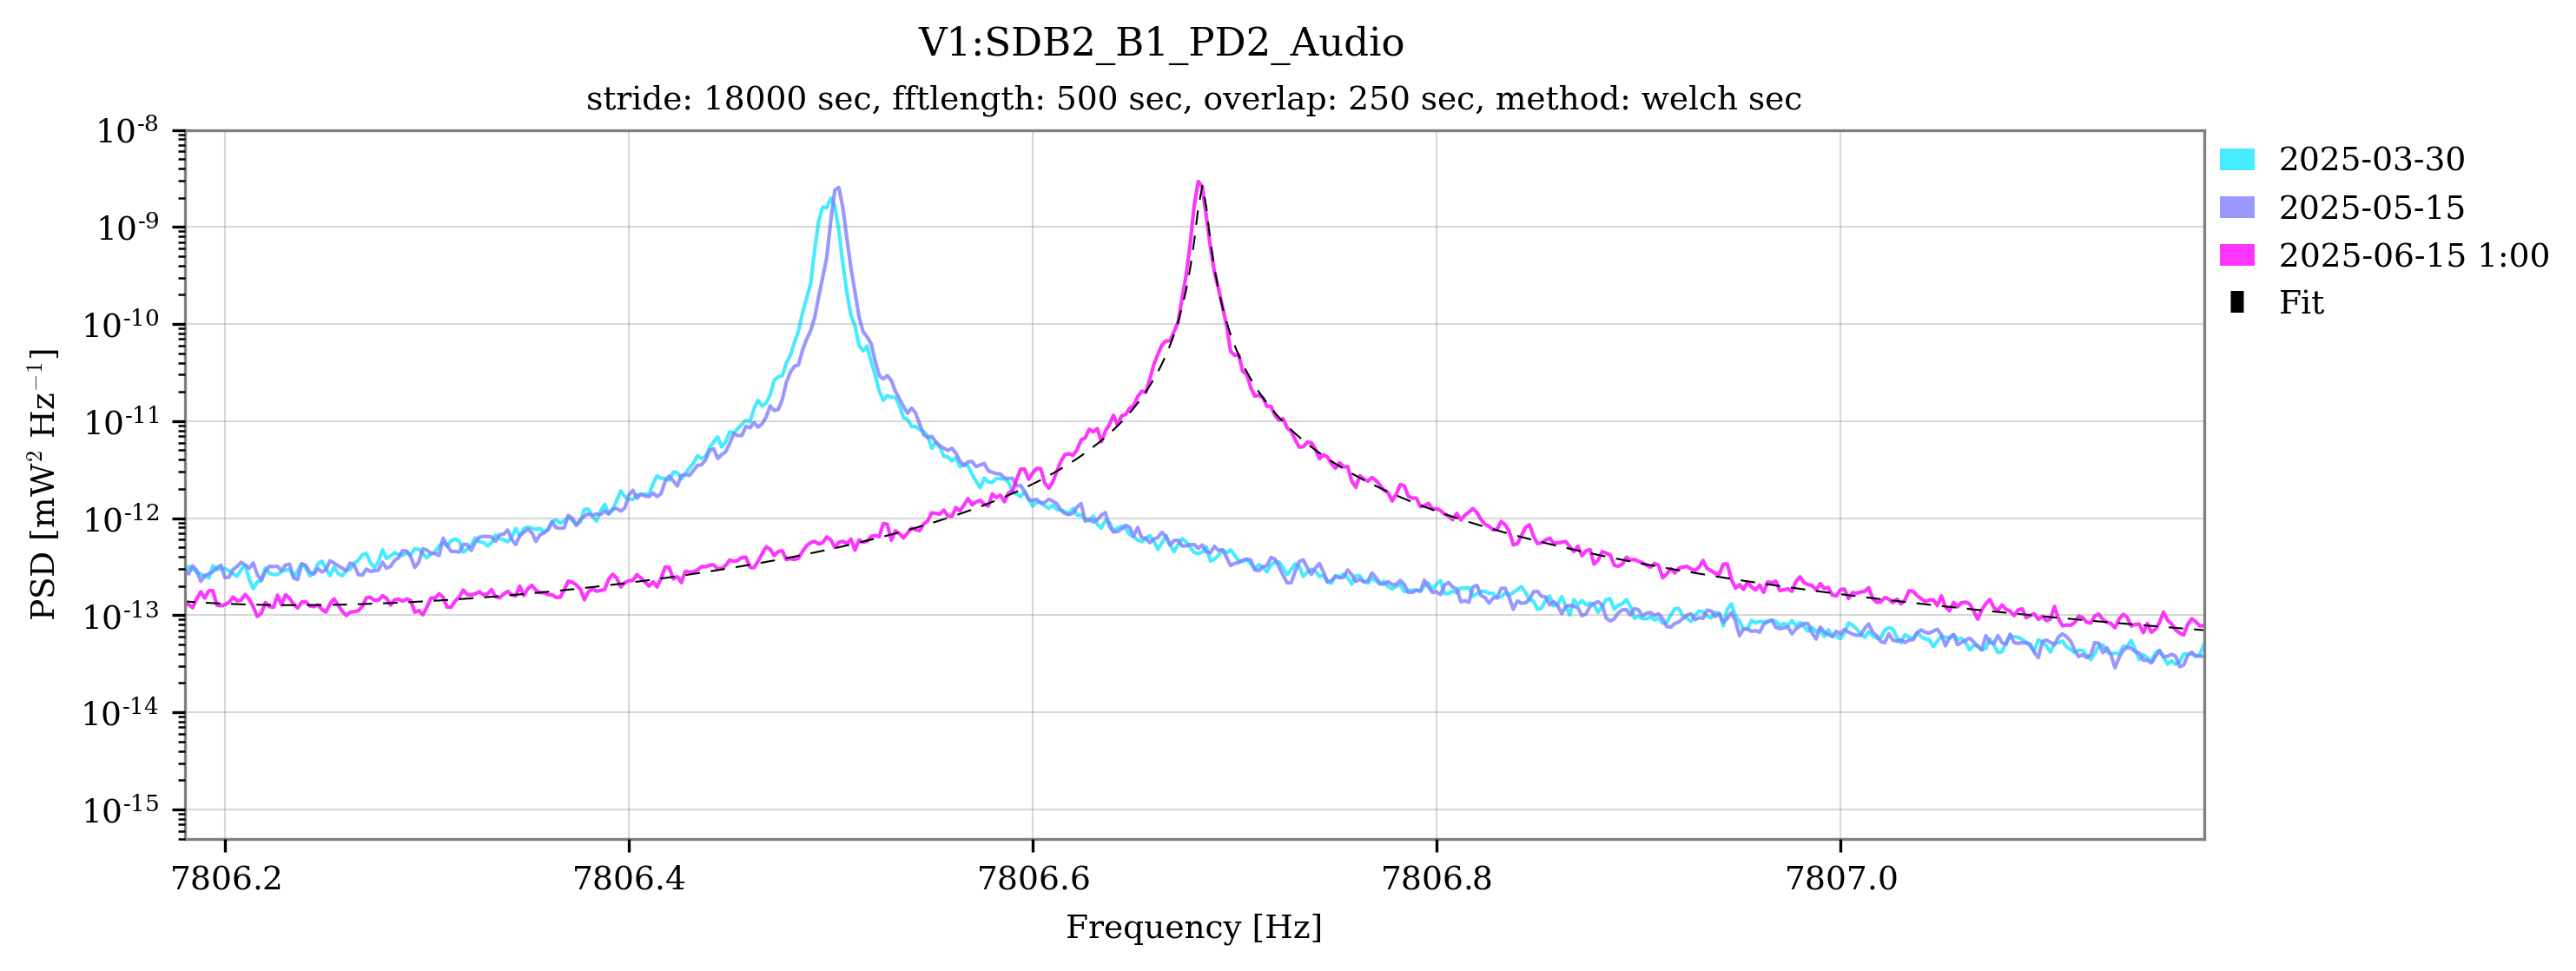
Mass 2: A_2 = 52e3, Q_2 = 93e5, f_2 = 7805.979,
Mass 3: A_3 = 48e3, Q_3 = 16e5, f_3 = 7806.684,
Mass 4: A_4 = 75e3, Q_4 = 65e4, f_4 = 7814.724,
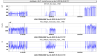
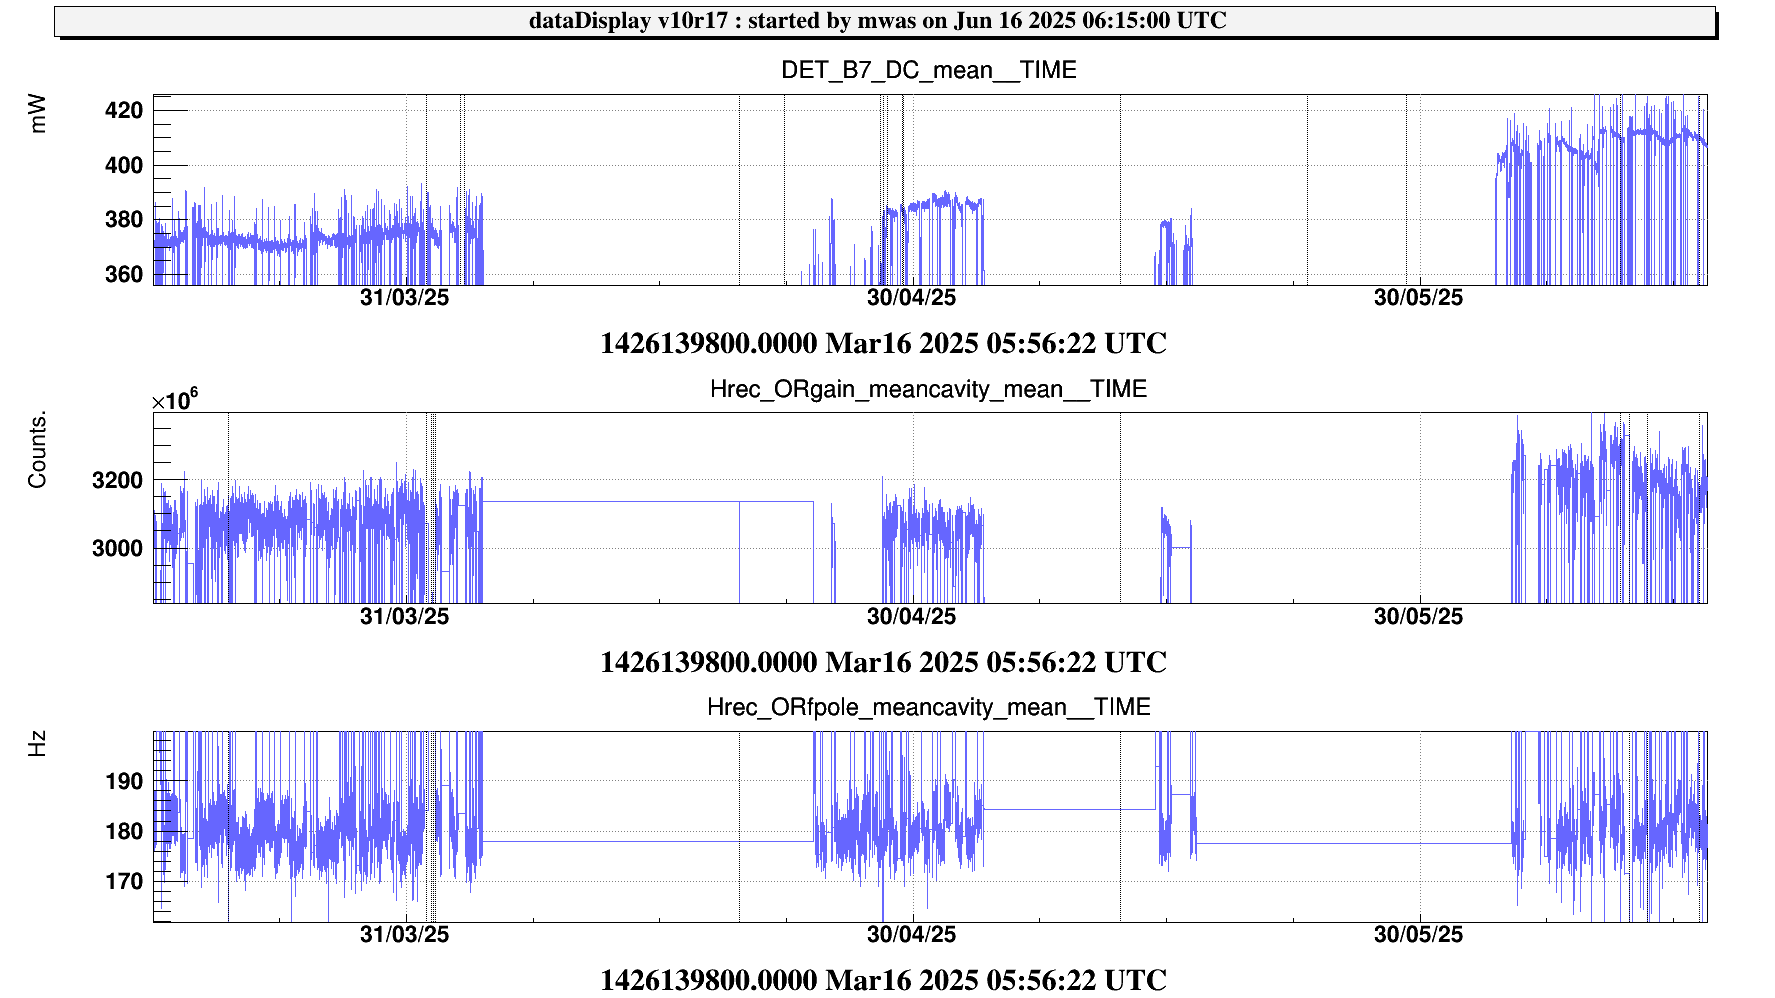
Note: A frequency drift is observed for some masses, likely due to temperature stabilization effects, e.g. in Fig. 2. This may have caused an underestimate of the corresponding Q_i. I attempted to reduce the data interval to minimize this drift, but the reduced resolution of the spectral estimate resulted in nearly identical fit outcomes accounting for uncertainty.
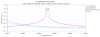
A similar fit repeated for mass 4 in the other period resulted in:
March 30: A_4 = 32e3, Q_4= 71e5, f_4 = 7814.531,
May 15: A_4 = 30e3, Q_4 = 715e4, f_4 = 7817.553.
This means that the quality factor for mass 4 (WE) is about one order of magnitude lower than before.


