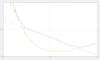
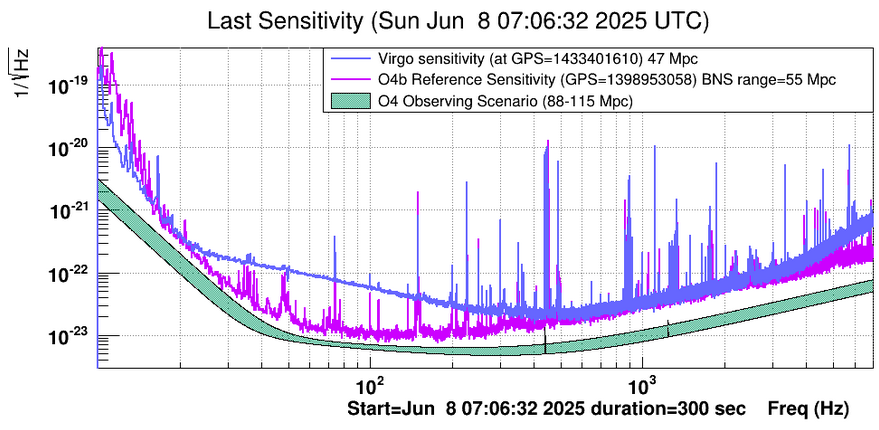
The sensitivity is spoiled by glitches that occur frequently.
Figure 1 shows a spectrum during a glitch, which has a powerlaw excess of noise, the slope is somewhere between 1/f and 1/sqrt(f).
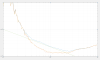
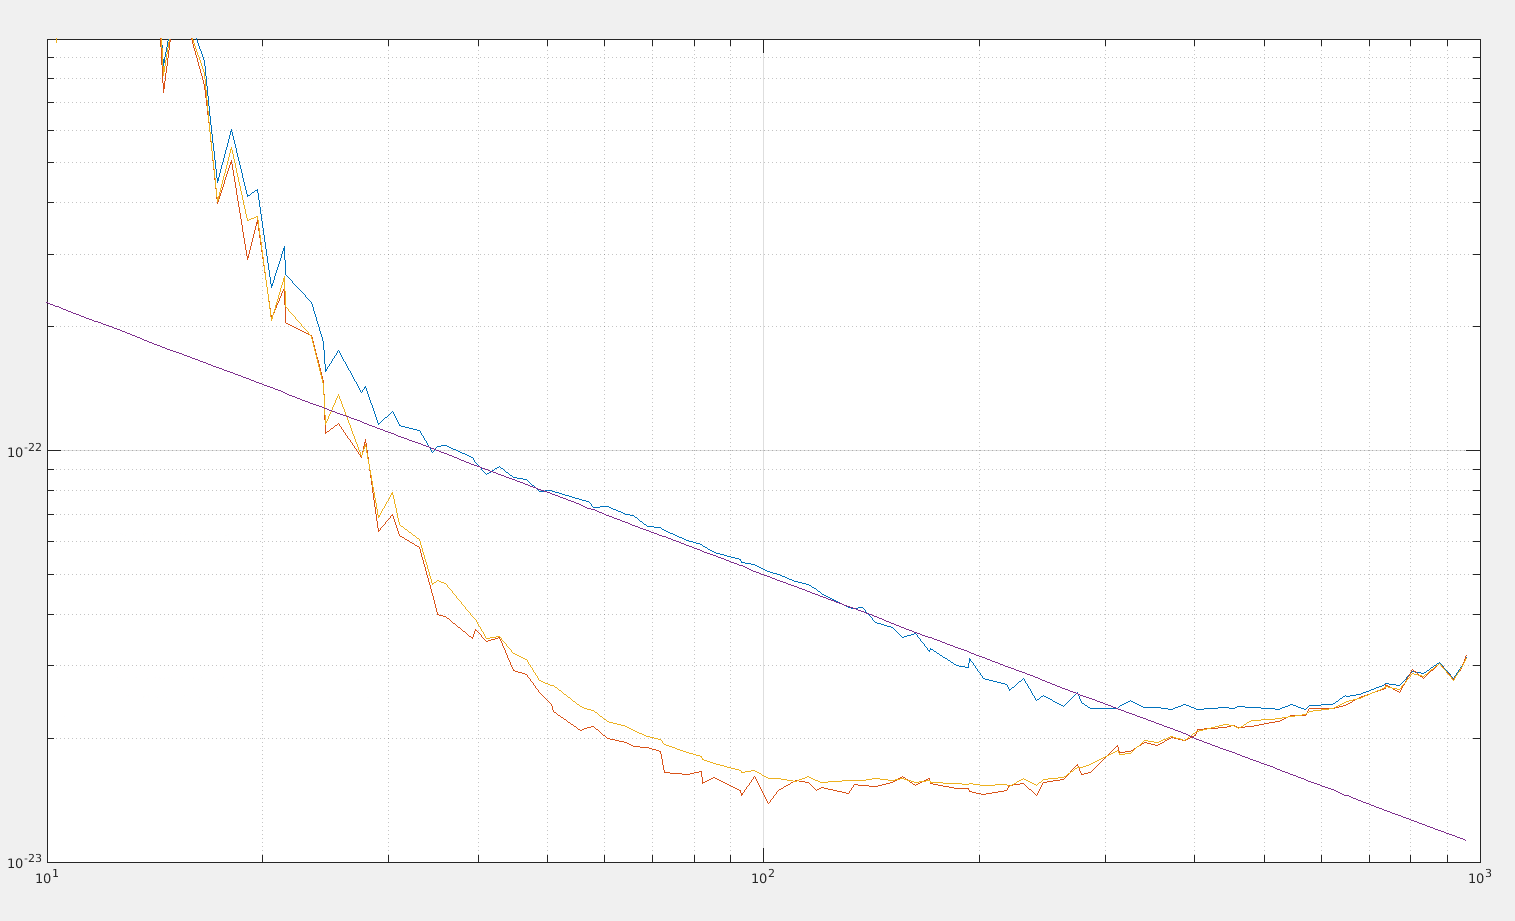
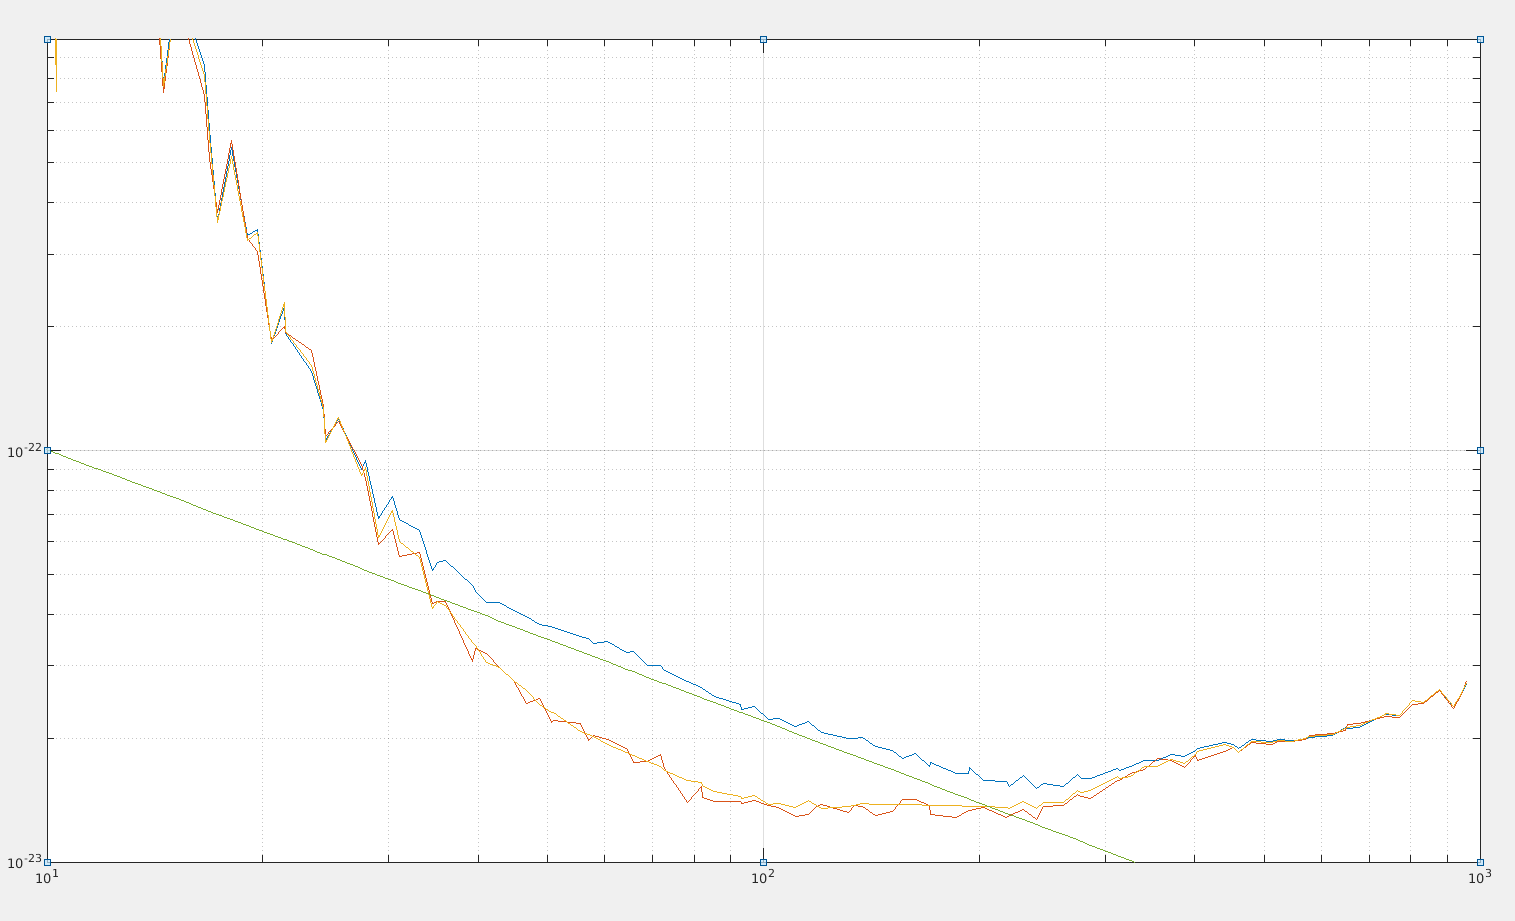
Figure 2 and Figure 3 show a couple of examples, I have looked at a dozen and most of them have this same slope, which happens to be roughly 1/f^{2/3}.
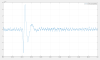
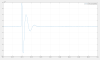
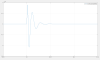
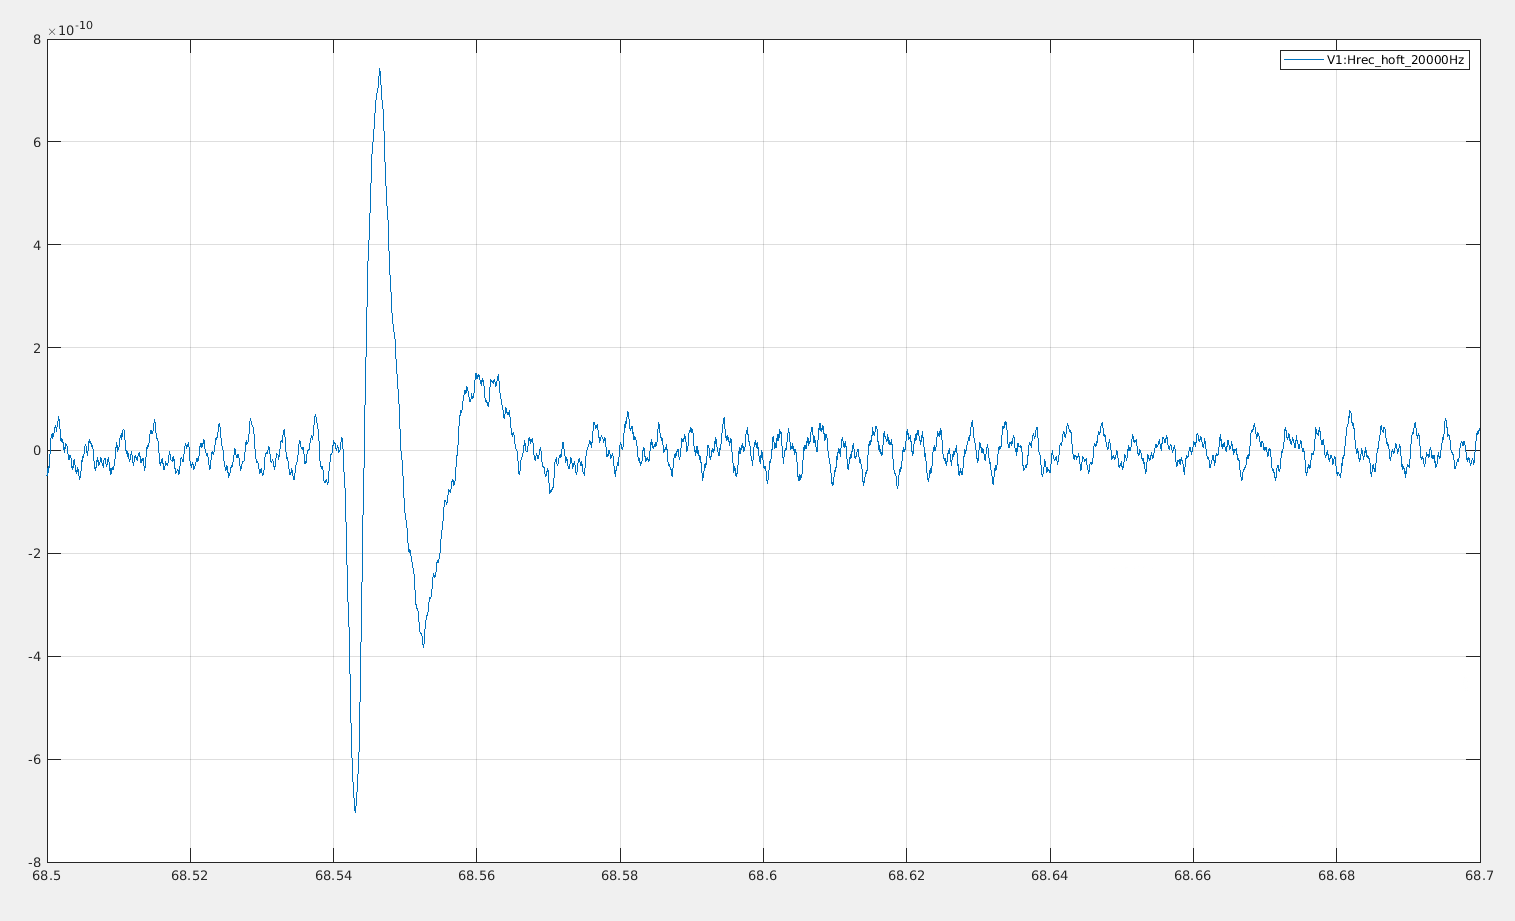
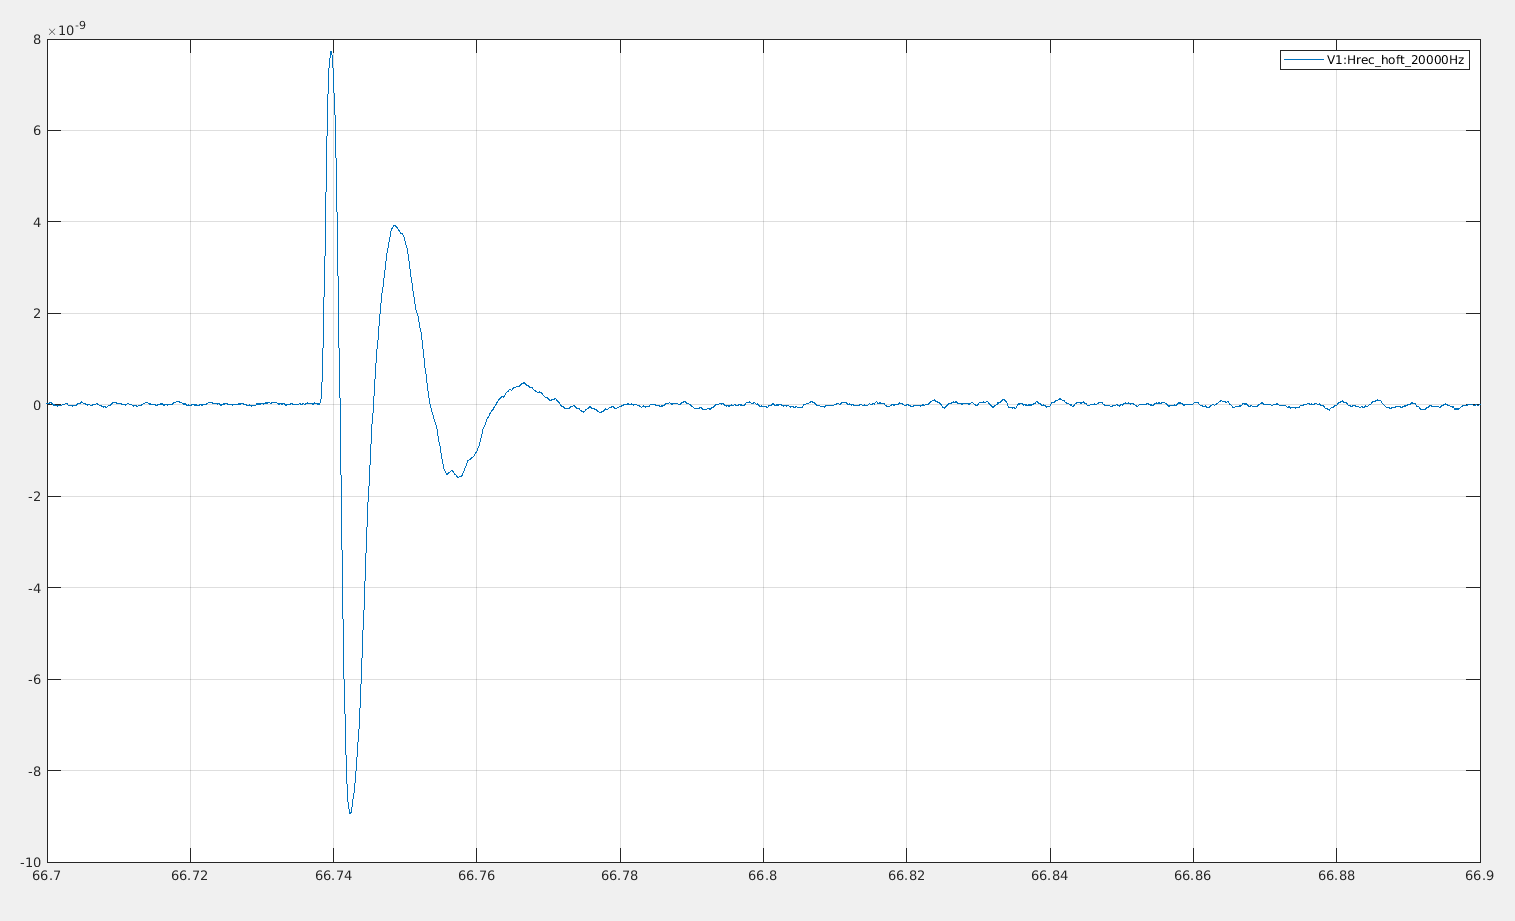
Figure 4 and 5 show two example of glitches in time domain, after band passing the data between 60Hz and 200Hz, and adding notches at 445Hz and 490Hz to remove the violin modes and the DARM line. The glitch can have both signs, going up or going down.
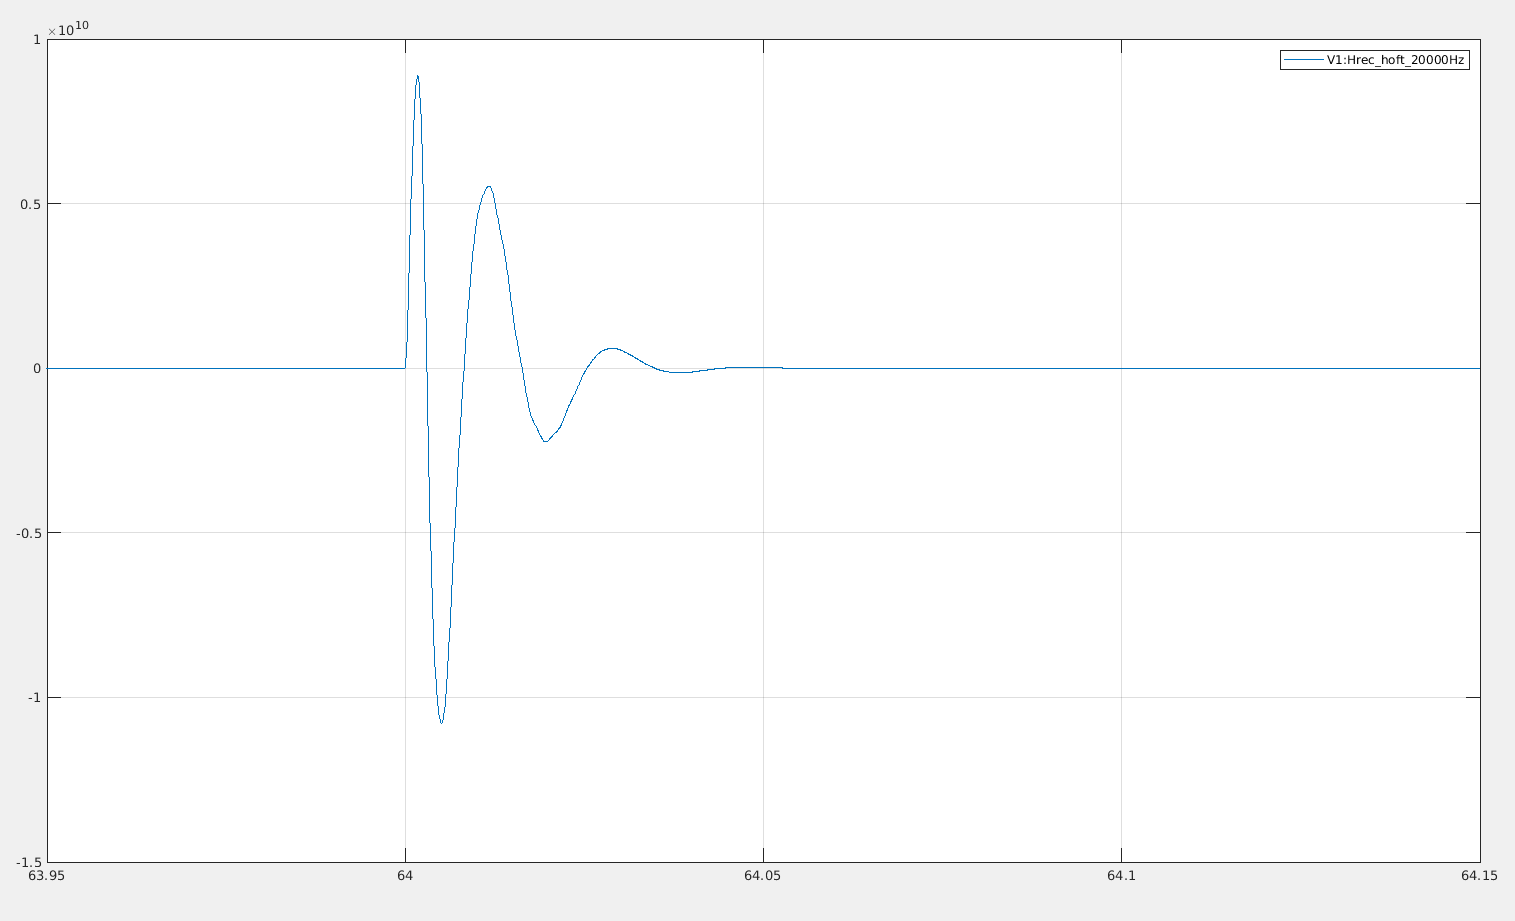
Figure 6 shows the response of the band pass filter I have used to a step function, which shows that most of the glitch shape you see in the band-passed data in figure 4 and 5 is the response of the band-pass filter. The shape of the time series is not informative on the nature of the glitch shape, just tells us that they happen in both directions.
In conclusion the glitches are similar to steps in h(t) (a perfect step would have a 1/f spectrum a perfect dirac would have a frequency independent spectrum, so the glitch is somewhere in between), the steps happen in both directions, the steps happen with widely different amplitude (SNR going from 10 to 1000).
/users/mwas/detchar/hoftGlitch_20250606/arches.m
