As agreed with Michal, after completing the calibration, I changed the WE RH power:
7 W [16.14 V] → 7.3 W [16.5 V]
The power change was applied in LN3 at 16:39 UTC.
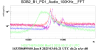
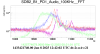
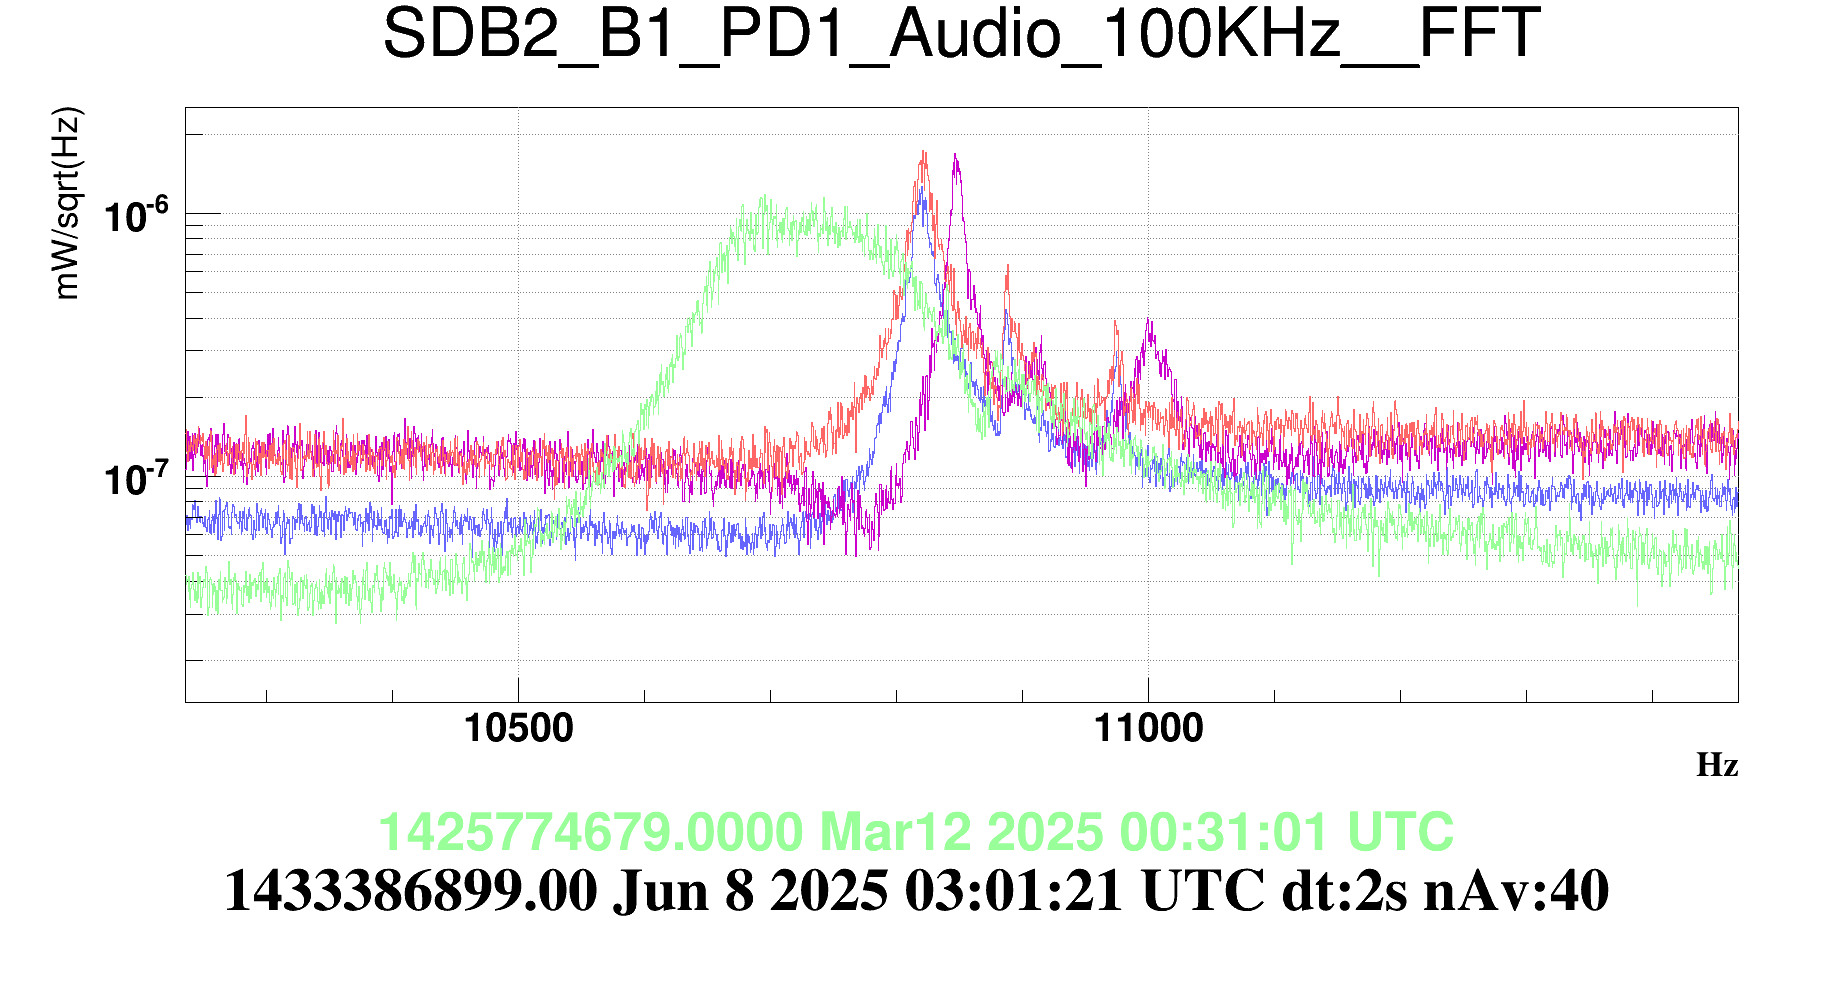
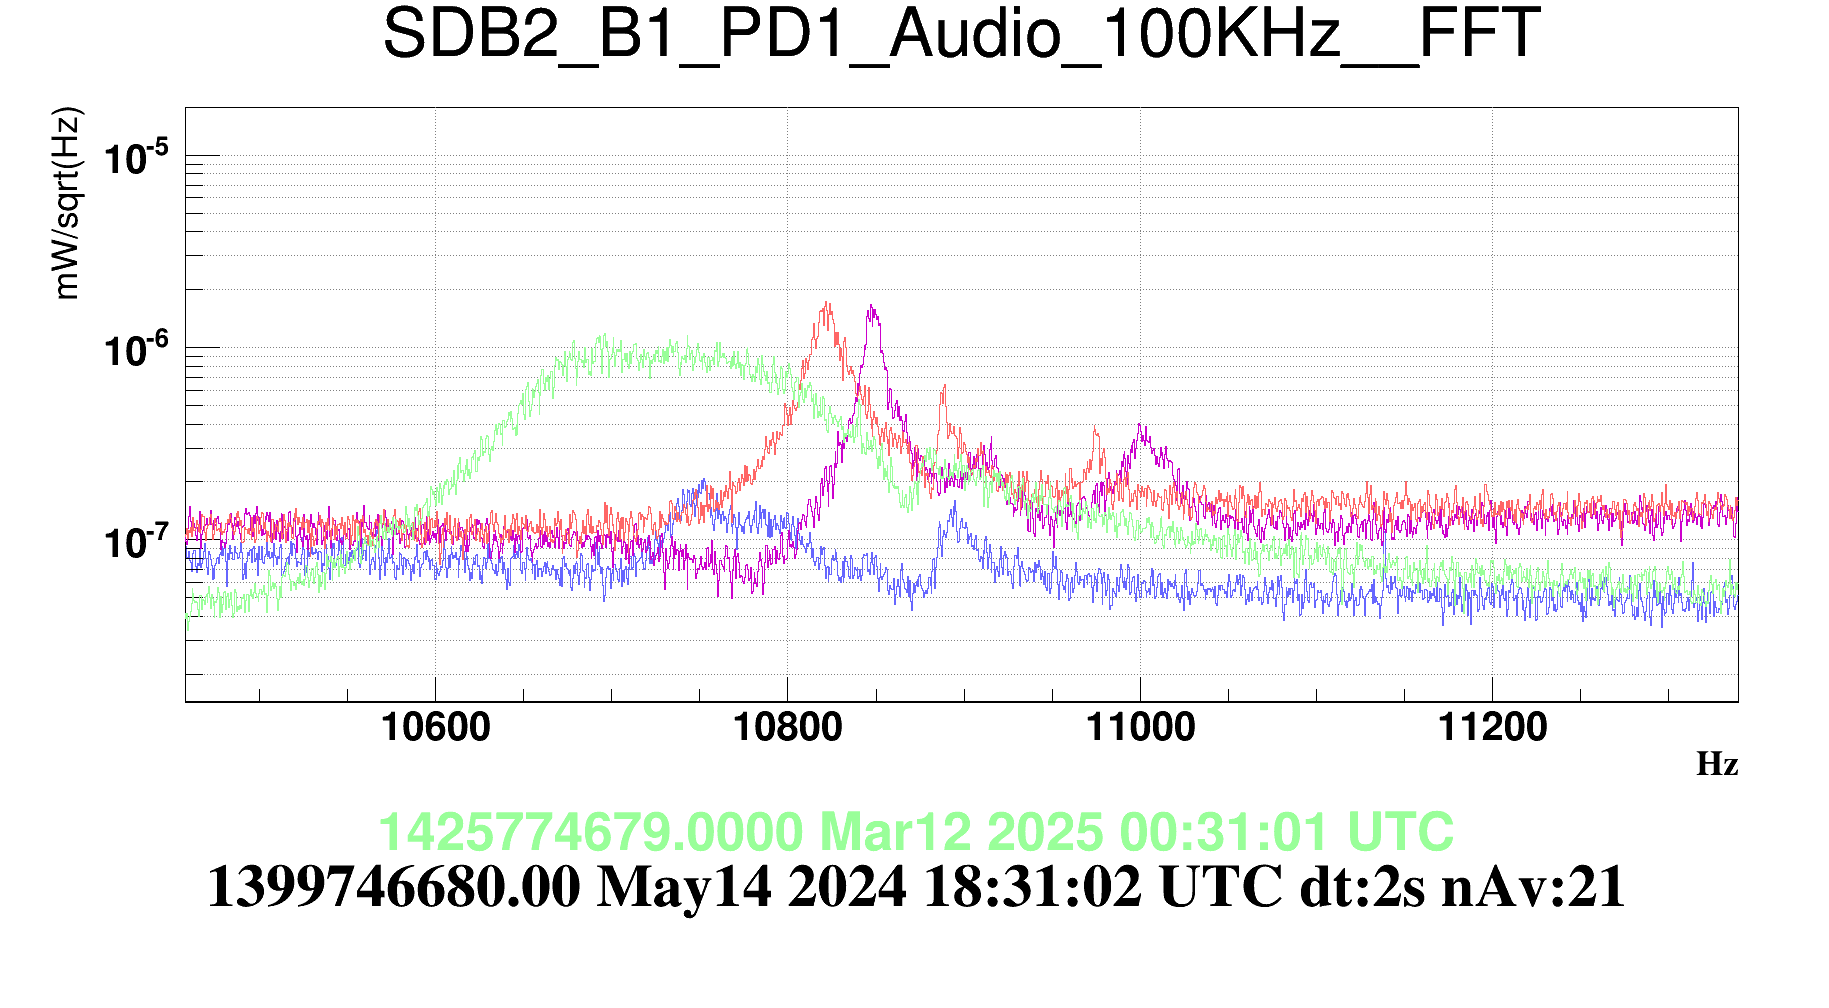
Figure 1. Shows the frequency of the order 2 mode relatif to the TEM00 mode in the arms FSR. Laser frequency noise at ~11kHz, correspond to light that is shifted in frequency by ~11kHz. The input beam is not perfectly mode matched with the arms, so the order 2 mode of that light is resonant in the arms and creates the peaks visible in the dark port around 11kHz. The green curve is a reference from two months ago, purple is before the RH step of last night, and blue and red are a few hours after the step and this morning. The step has moved the order mode closer to the situation of two months ago.
It is surprising to see that three peaks have moved. I had assumed we should have 4 peaks in total, two for each arm, corresponding to the two axis of curvature of the mirror (for example horizontal and vertical). So that changing the RH power in one arm would move only two out of the three peaks.
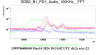
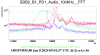
Figure 2 shows in blue measurements from last year in LN2 (SR aligned). In the past we could see the three peaks only when SR is aligned, and when SR was misaligned it merged into one single wider peak. It is strange that this is not happening anymore, and that we have separate peaks with SR misaligned. I don't know what that means. A speculation is that misaligned SR mixes up the modes between the two arms, if the two arms are well mode matched with each other.
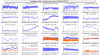
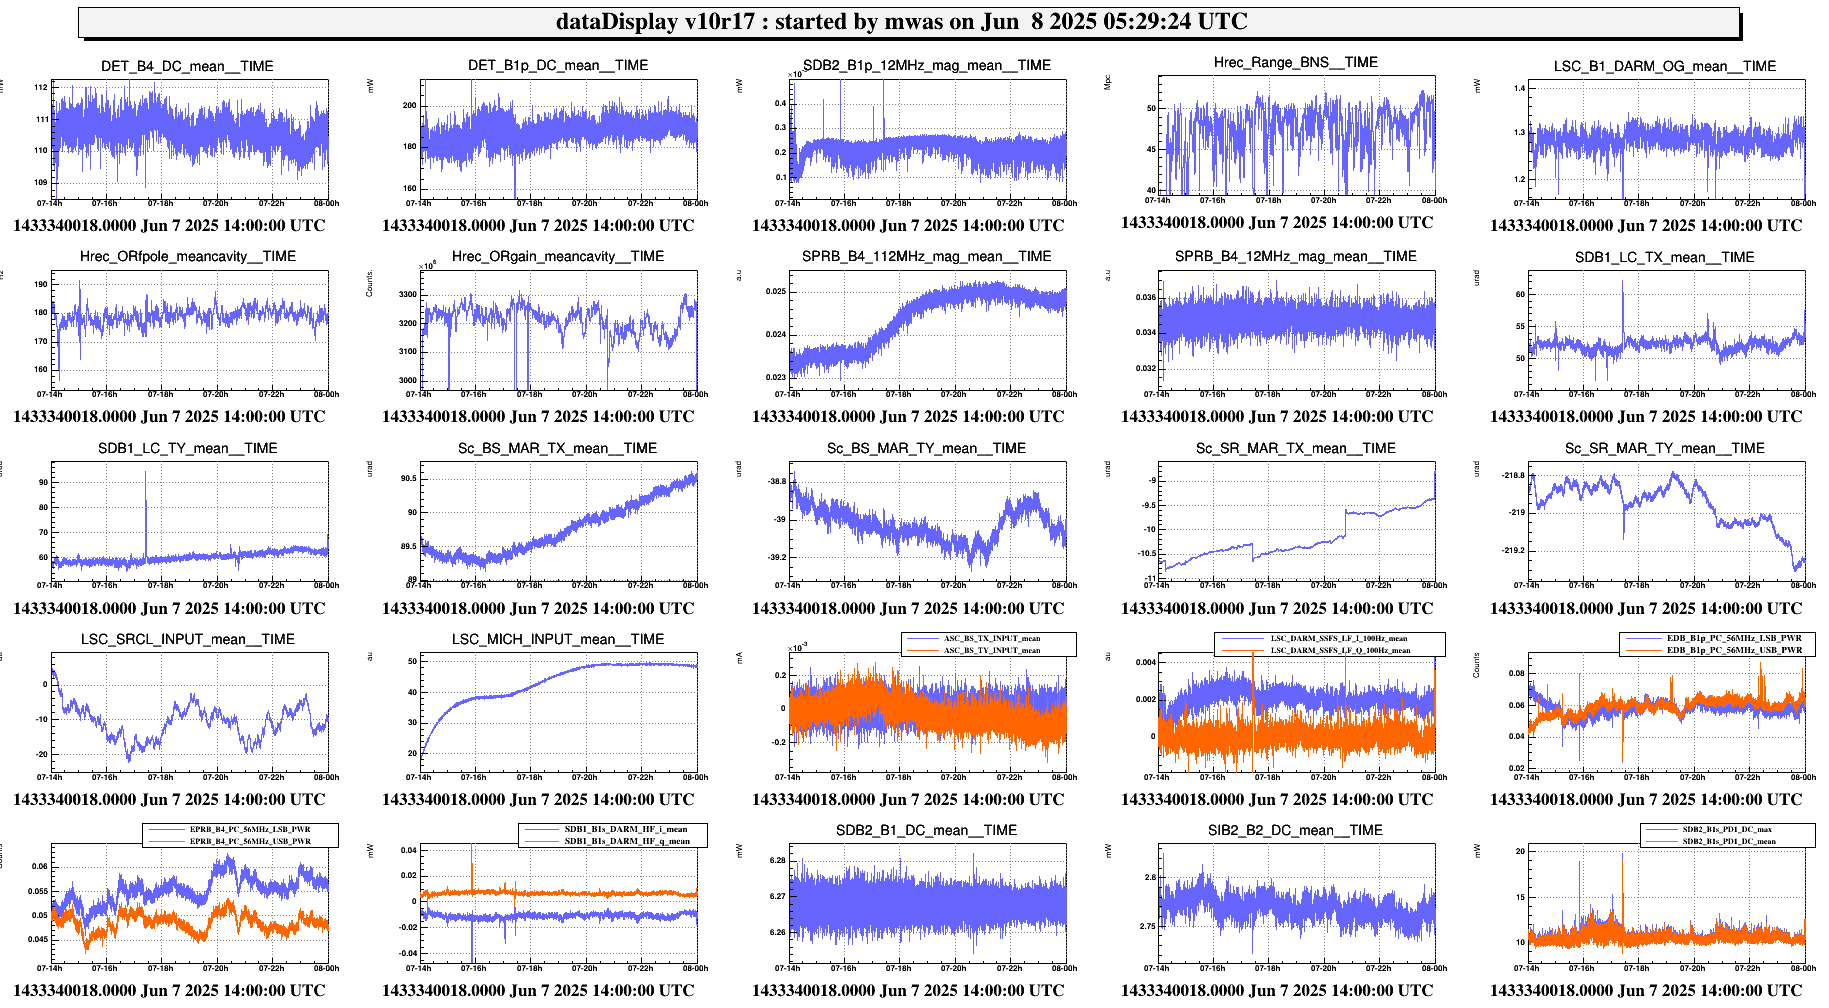
Figure 3 From more usual trends the only clear change is an increase in B4 112MHz mag, and much less clearly maybe a reduction in SSFS coupling to DARM. The BNS range may also have improved slightly, and the rate of glitches may have reduced by ~30%. If possible, making another step of the RH in the same direction today could help understanding if that improvement is real or not.
Today, a new increase of the RH power was applied:
7.3 W [16.5 V] → 7.6 W [16.8 V]
The power change was performed in LN3 at 09.25 UTC .
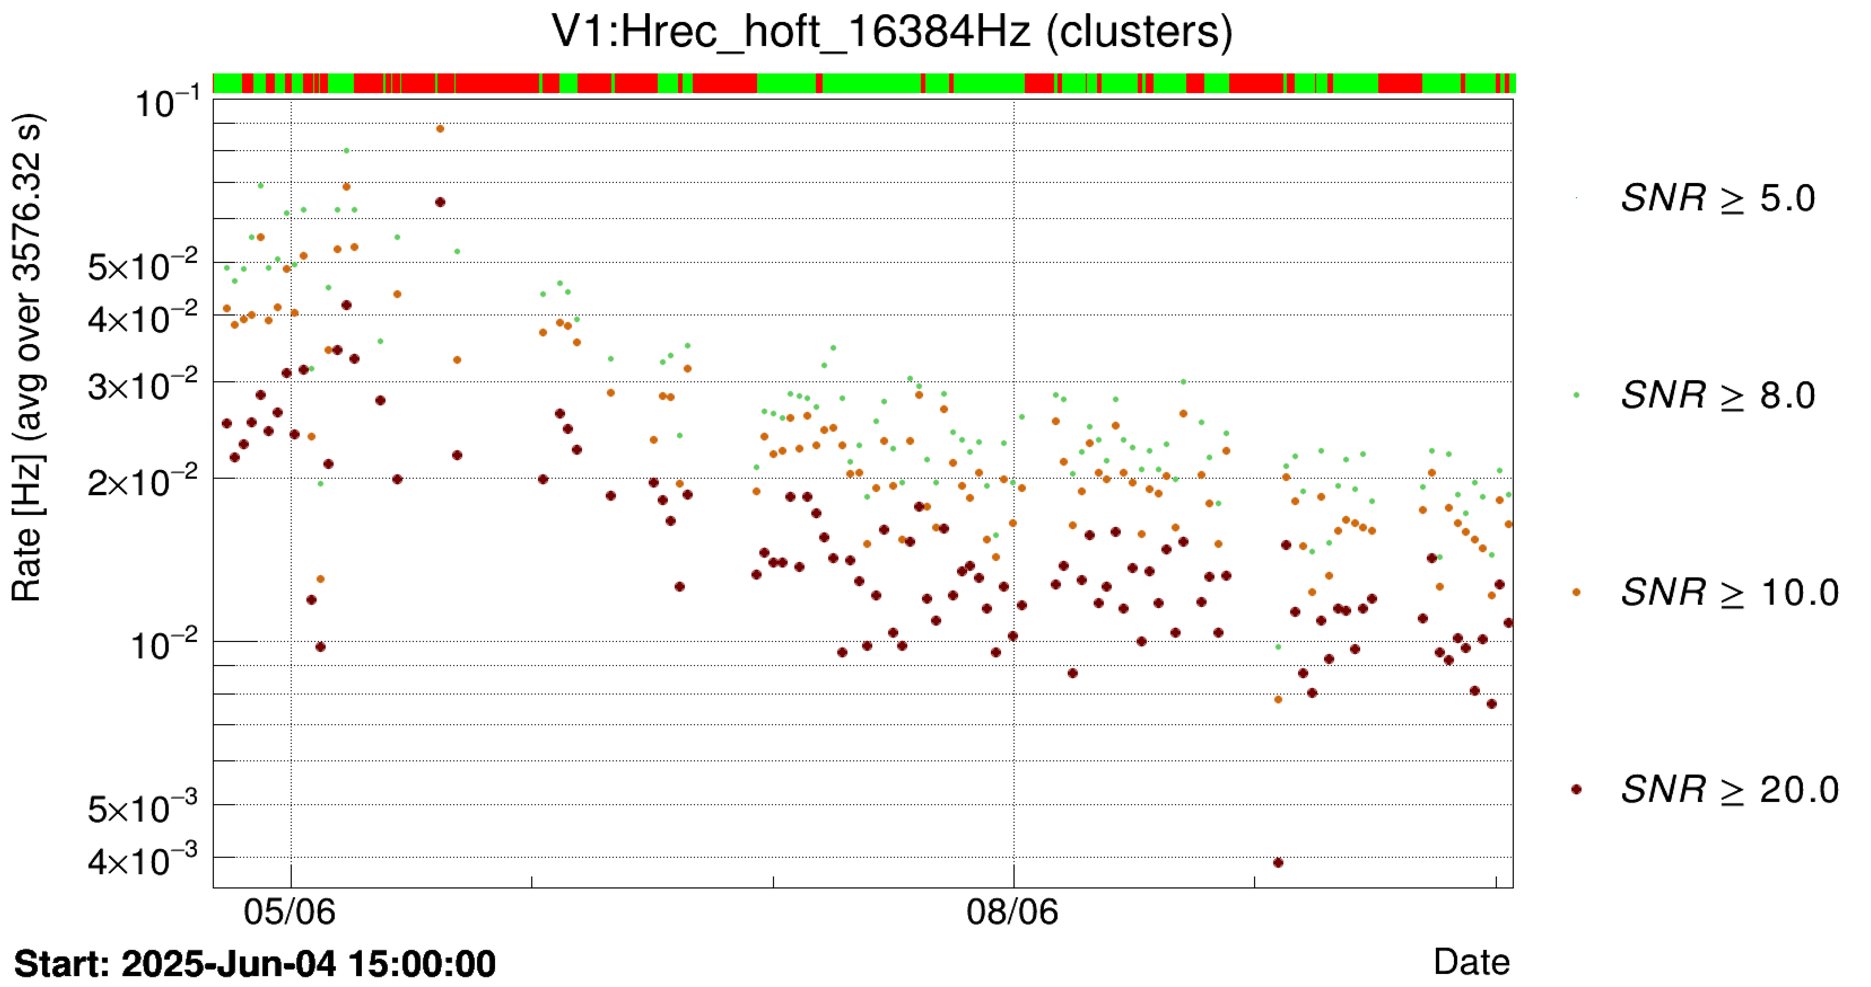
The downward trend observed by Michal is visible on the attached Omicron rate plot that covers the whole GPS range, from Wed. afternoon to this afternoon.
After the earthquake at ~14:00 UTC, two lock acquisition failed a ~minute after opening the OMC slow shutter because the power on B1p and B1s was too high. During the following lock acquisition around 16:10 UTC I have added a MICH offset of +25 before the slow shutter opened. This was sufficient to reduce the B1p and B1s power, and go further with the lock acquisition and get back to LN3.
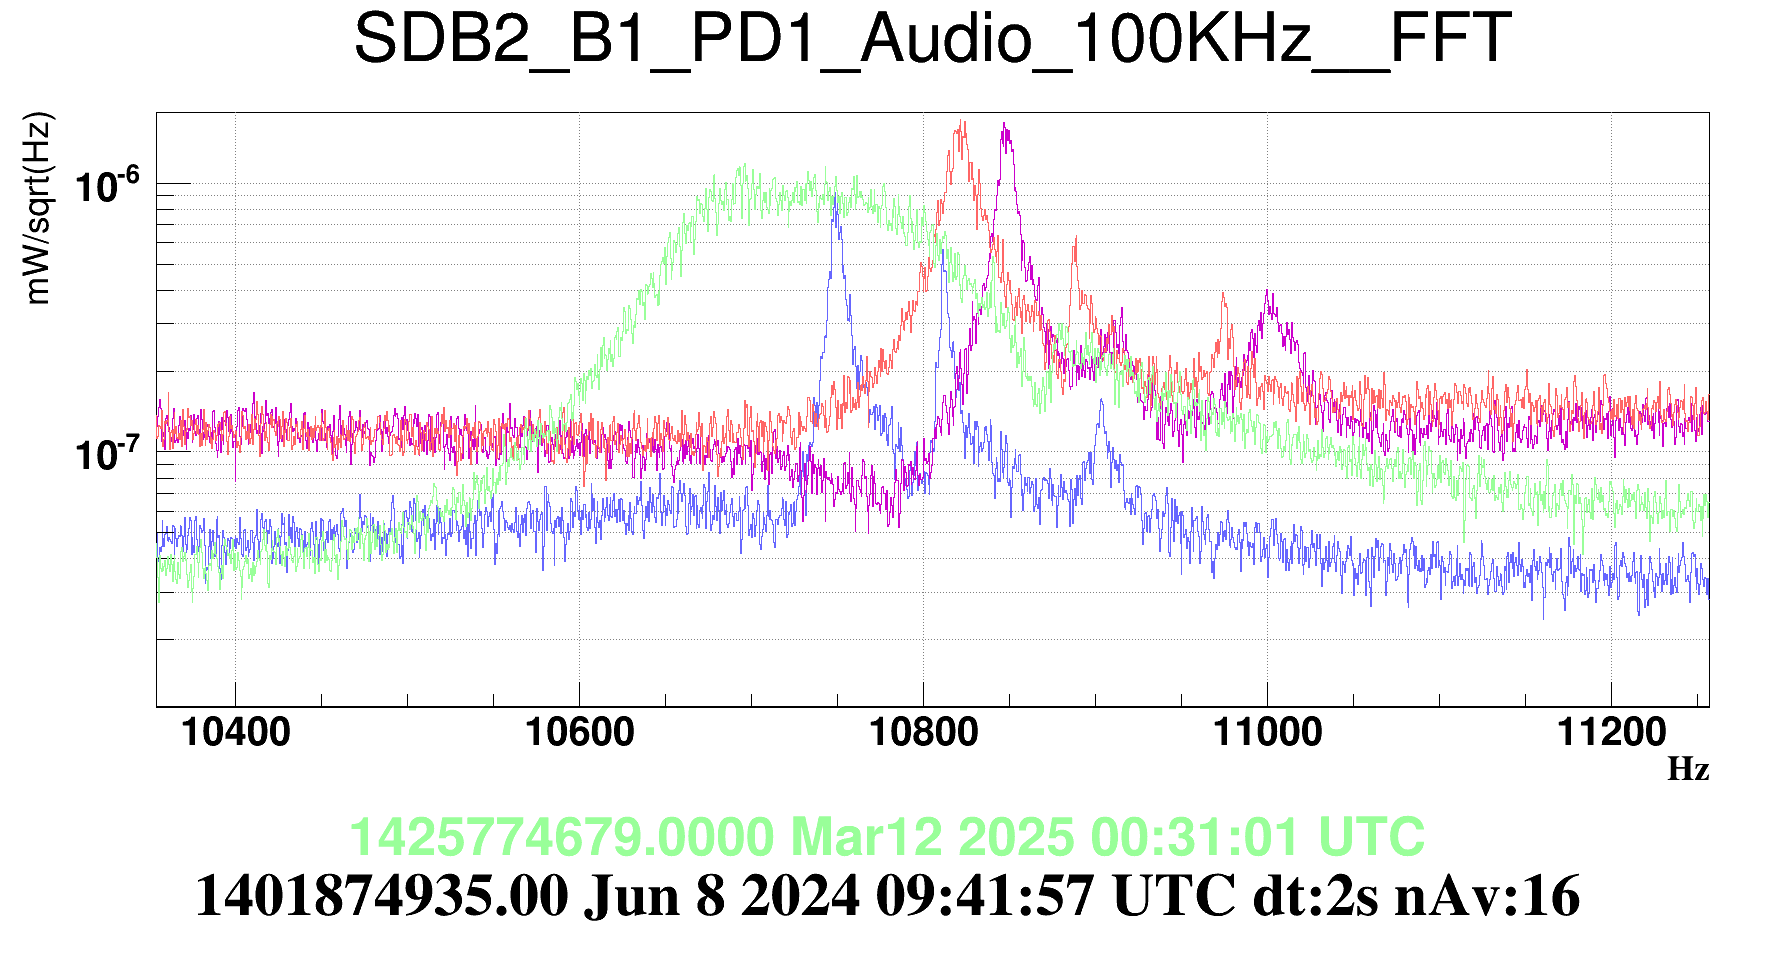
Figure 1. The RH adjustment have made the two arms better mode matched, as witnessed by the order 2 mode peak around 11kHz. The blue peak is after this morning step, the green is a reference from 2 months ago, and the other two are yesterday. The fact that the peak broadens, is actually related to a good mode matching between the arms.
Figure 2 shows in blue a measurement from almost exactly a year ago, when we were doing differential steps of the EM RH. The blue curve corresponded to a state where we could measure by other means that we have made enough steps to make the differential RH tuning clearly worse. And the peak did become separated into three narrow peaks at that time.
I suspect we have tuned the DAS on Thursday/Friday for a mode mis-match between the arms. Initally we had to put negative MICH offsets to lock, and then after the DAS adjusments it was no longer necessary. Now that we have removed the EM RoC difference, we need to undo some of that DAS tuning. In the mean time a MICH offset of +25 before opening the slow shutter, should help with the lock acquisition:
cm_send('LSC_Acl', 'AcConstChSet', 'MICH_SET', 25.0, 250.0)
For the ring heaters, to recover the same Gouy phase in the arms as before, we probably need a step in both the NE and WE RH. The 10% higher laser power is making a bigger bump in the middle of the mirrors (makes the mirrors flatter), and small common increase in the RH should compensate for that, and move the order 2 mode resonance back to where it was in March.
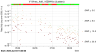
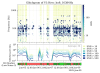
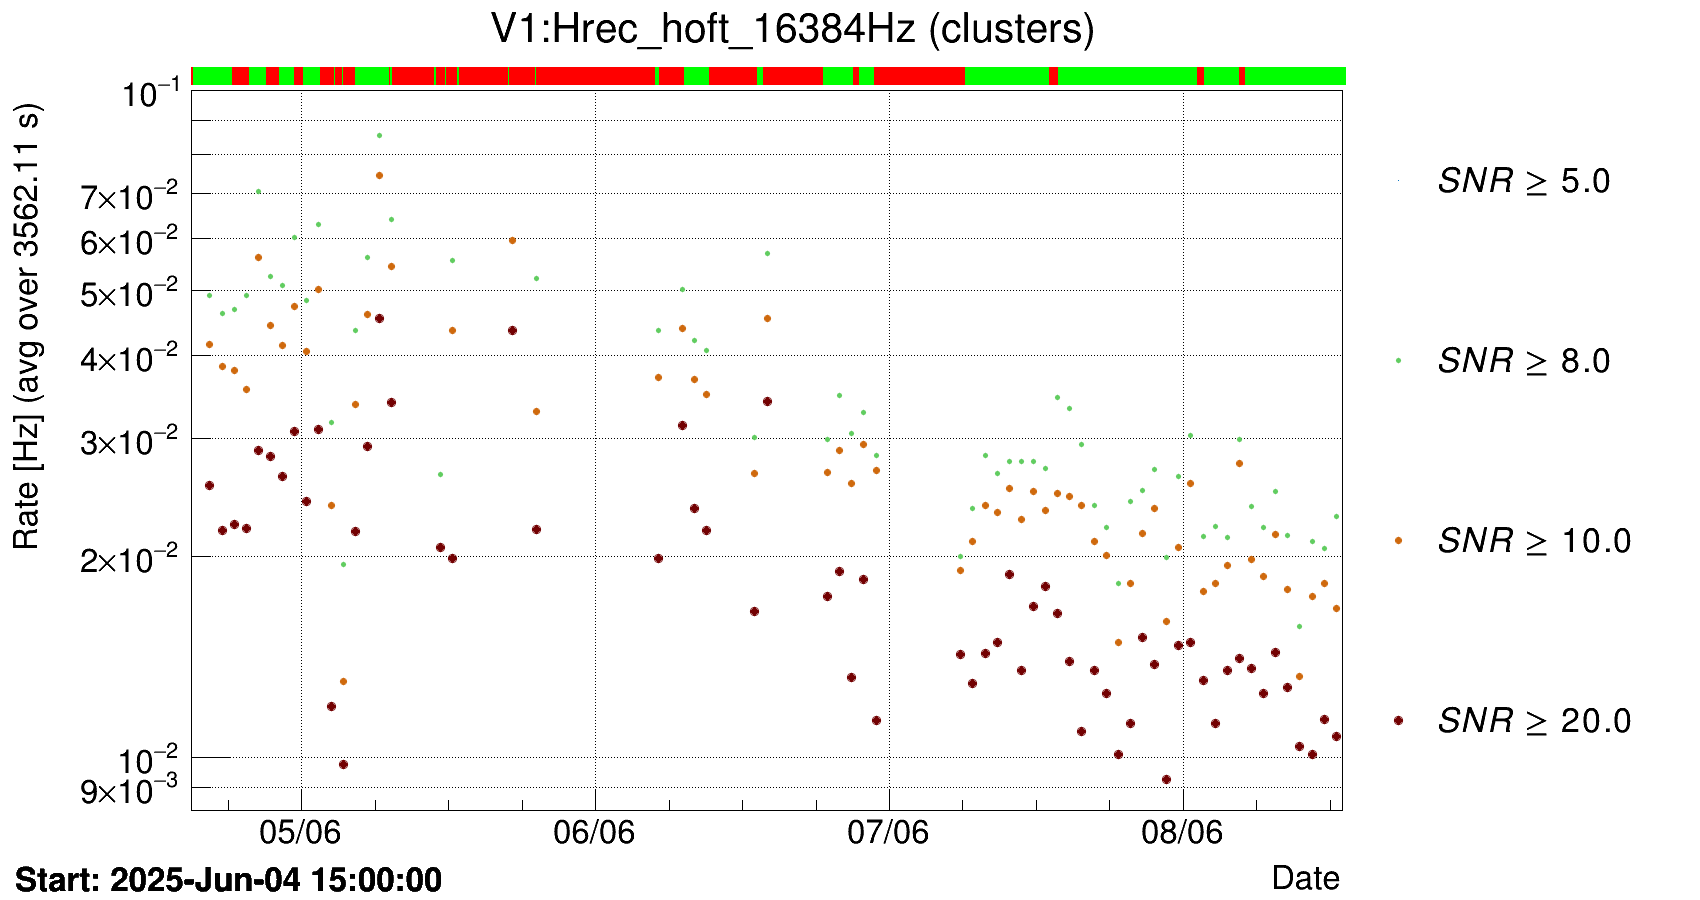
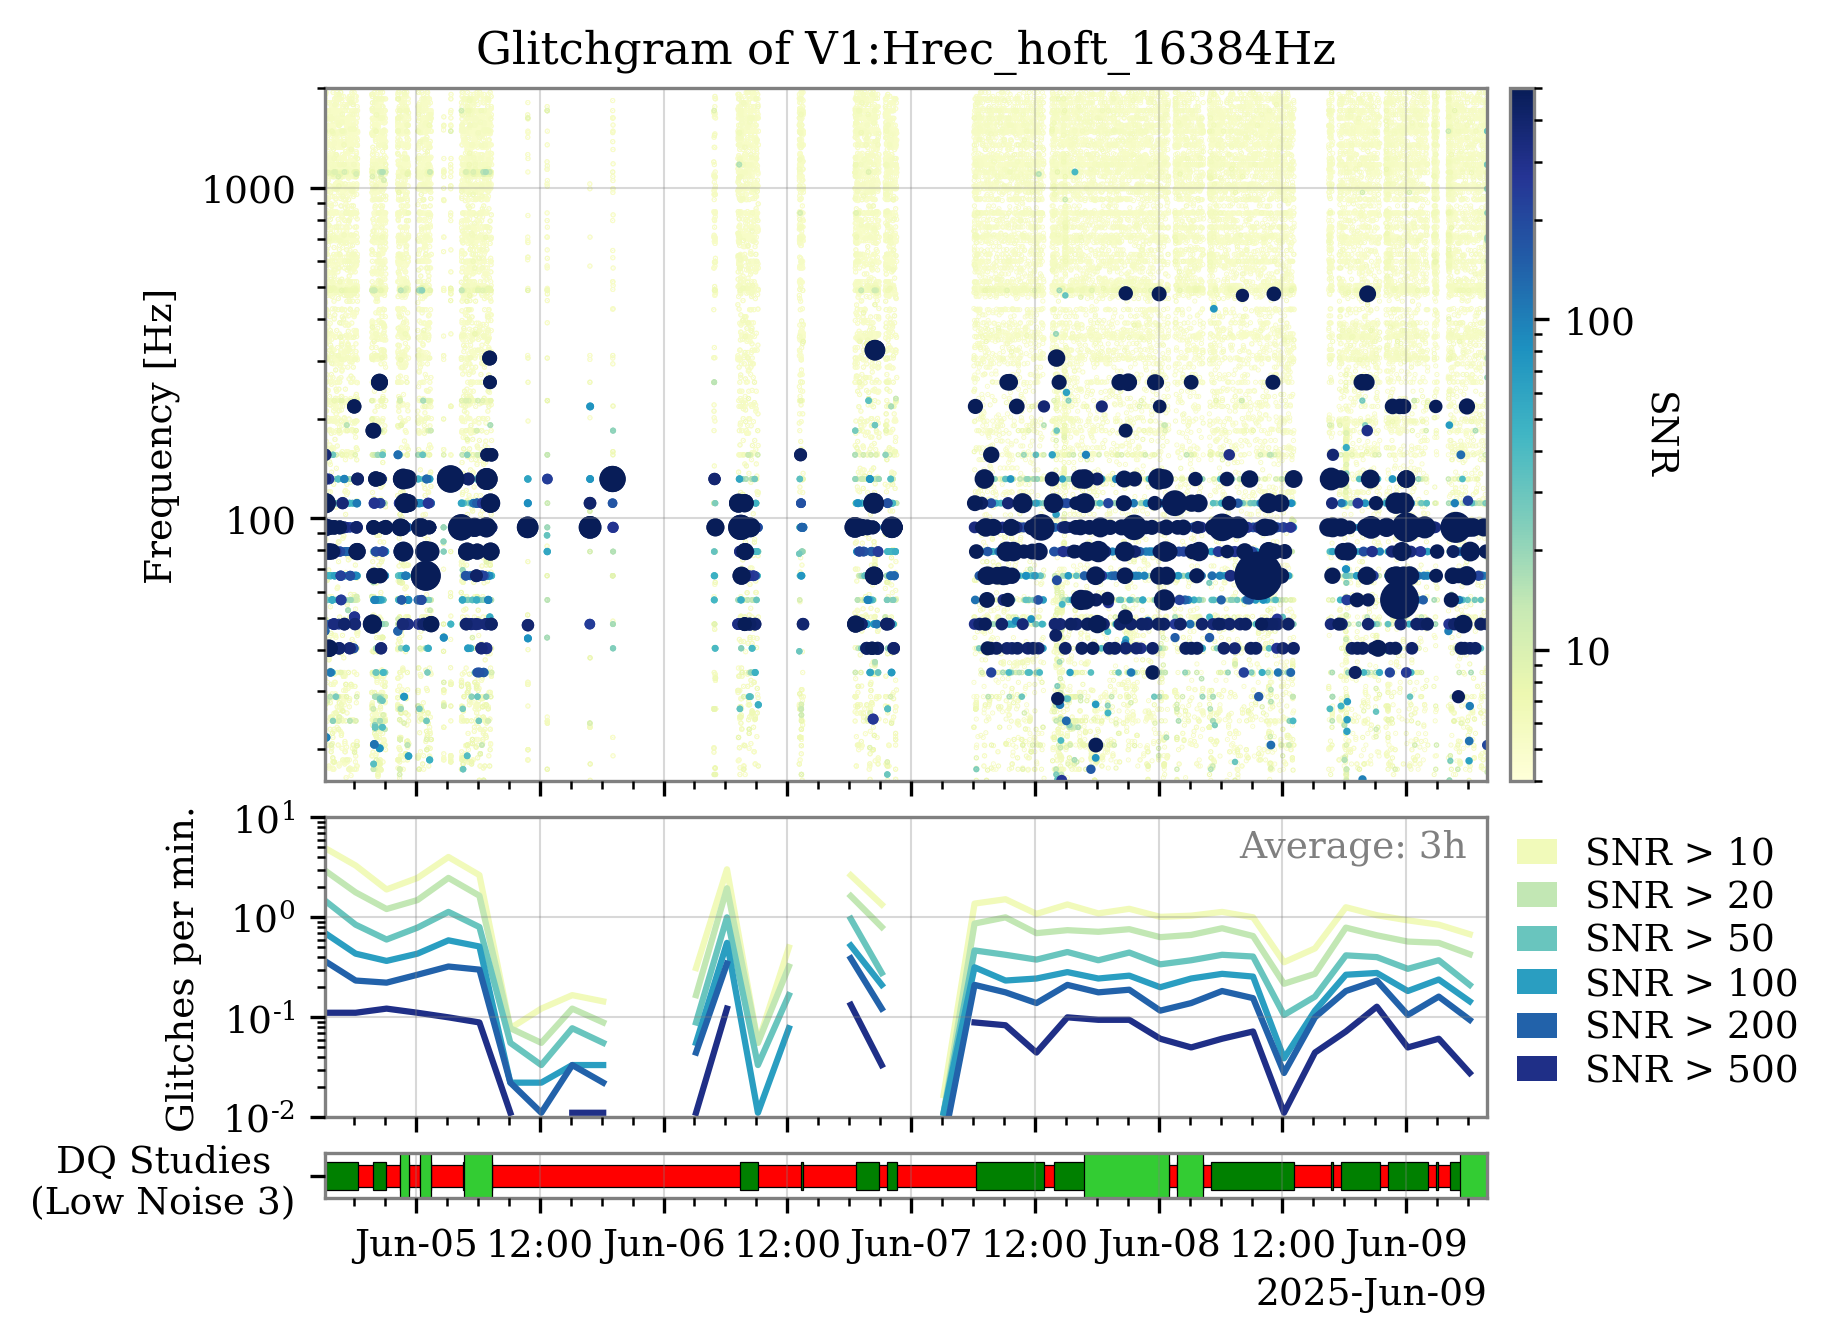
I'm posting an updated version of the plot showing the Omicron trigger rate from June 4 to today. In this version, I increased the averaging window from 1 hour to 3 hours to smooth out normal rate fluctuations and better highlight longer-term trends. I also added more color levels for the SNR to improve visualization of high SNR glitches.
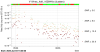
In Figure 1, the top panel shows the usual time-frequency glitchgram. The bottom panel displays the glitch rate per minute, with different colored curves corresponding to different SNR thresholds. The DQ bar indicates segments in DQ Studies mode (light green) and Low Noise 3 (dark green).
A decrease in glitch rate is visible starting from June 7, likely associated with the WE RH power increase from 7W to 7.3W: #66928 . There also seems to be a gradual downward trend in the rate between June 7 and today.
These effects are more evident in the upper curves, hence corresponding to lower SNRs (SNR < 200).
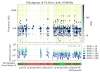
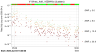
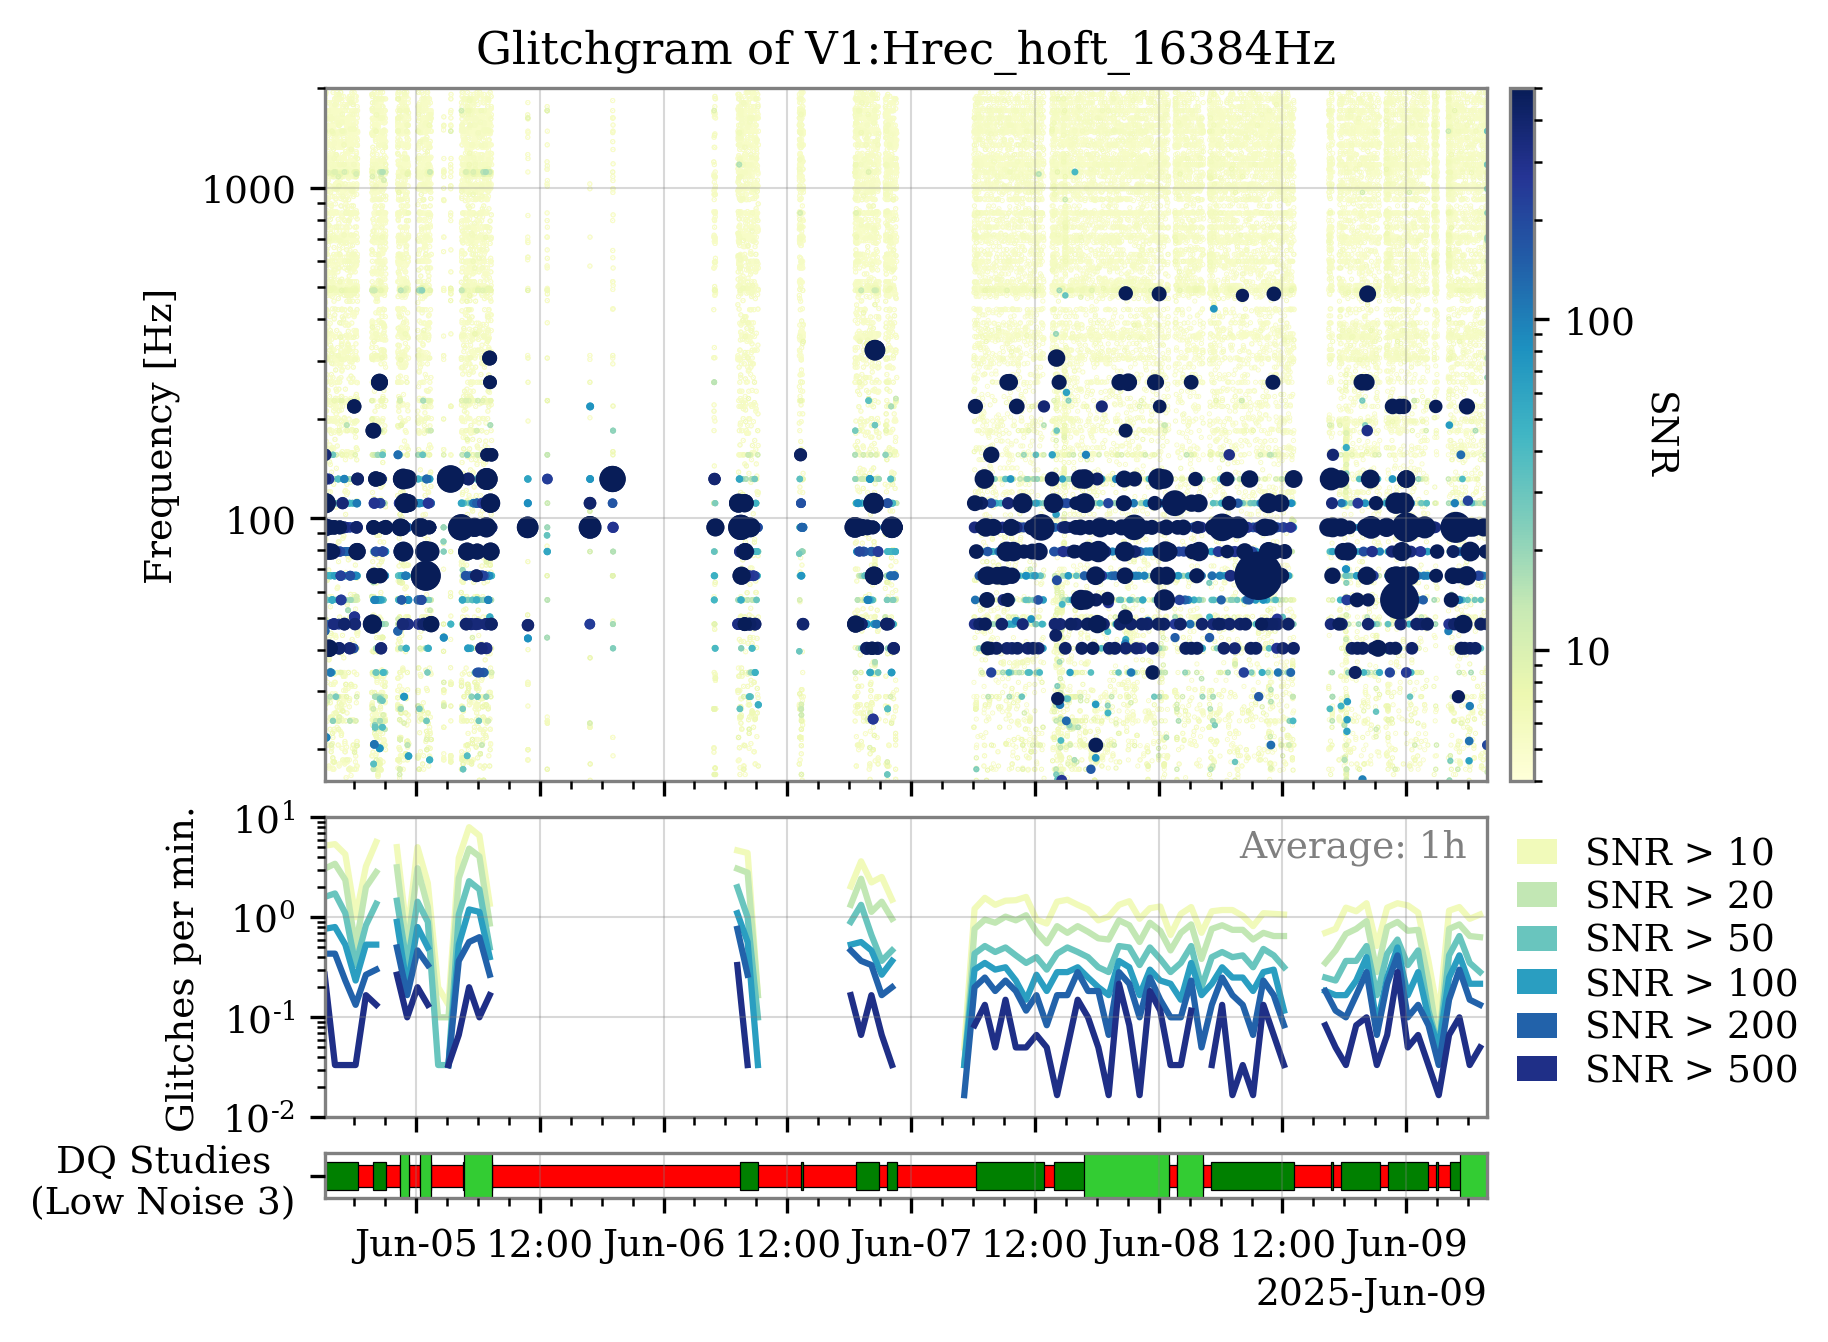
For comparison, I also include a version of the rate plot averaged over one hour (Figure 2), as for the Omicron plot previously posted by Nicolas.
Same plot, updated until this morning 0600 UTC when the maintenance started. The downward trend continues but the glitch rate remains very high.
The slow downward trend seems to continue or maybe the glitch rate is reaching a plateau -- attached plot ending at midnight tonight.

It would be important to have this glitch rate figure with a correct horizontal axis, so that the changes in glitch rate can be compared to what has been done at that time.
We can't with the current Omicron version. There is a dedicated issue open: https://git.ligo.org/virgo/virgoapp/Omicron/-/issues/118.
Updated plot (still with the time axis issue) as of 08:00 LT this morning.
I'm not saying this is really helpful but using the top colored band showing locked (green) and unlocked (red) segments could help locating in time a segment of interest.

Glitch rate vs. time: updated plot until this morning 09:00 LT. It seems the glitch rate is not decreasing anymore.
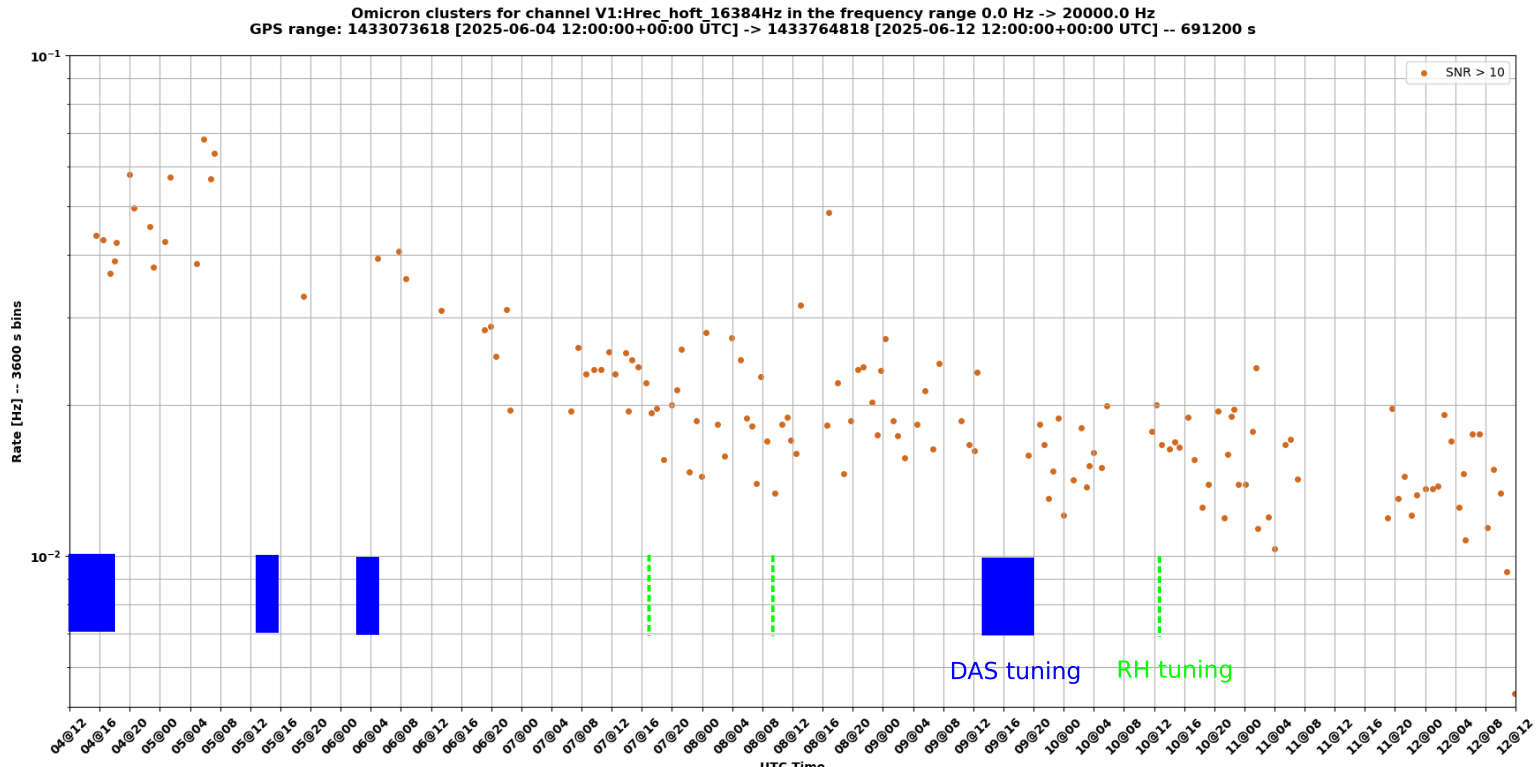
Quick hand-made (and hopefully consistent) Omicron-like plot showing the glitch rate evolution with an UTC time axis tabulated every 4 hours
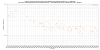
Figure 1, adding the times of the DAS tuning (many hours) as blue rectanges, and the times of the RH steps (an exponential decay starting at the step) as green dashed lines. There might be a relation between the DAS tuning and the step glitch rate, there doesn't seem to be any for the ring heater steps, which means either that the glitches are independent of the RH steps, or require a much larger step to make a difference.
