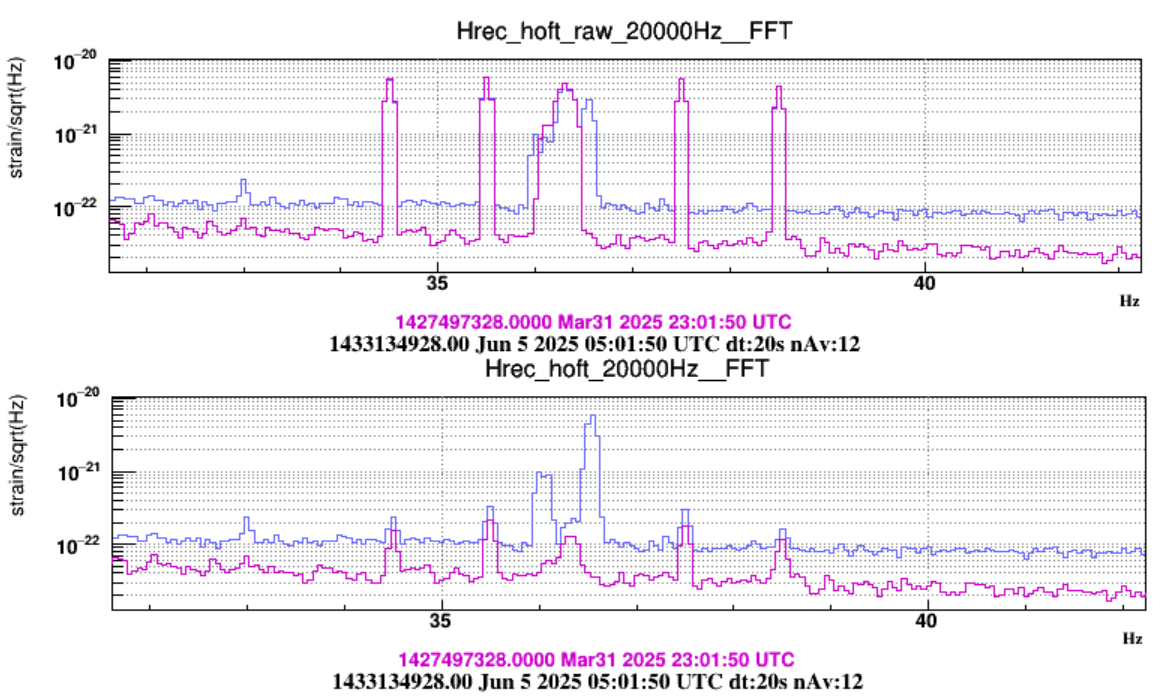
Didier’s observation of the bump in the gated strain channel is very important. It left me puzzled and I spent a bit of time trying to understand what was going on (and ended up rediscovering something pretty basic in signal processing...). I’m sharing some notes here, especially for anyone working on Continuous Wave searches who uses the gated strain channel or applies gating.
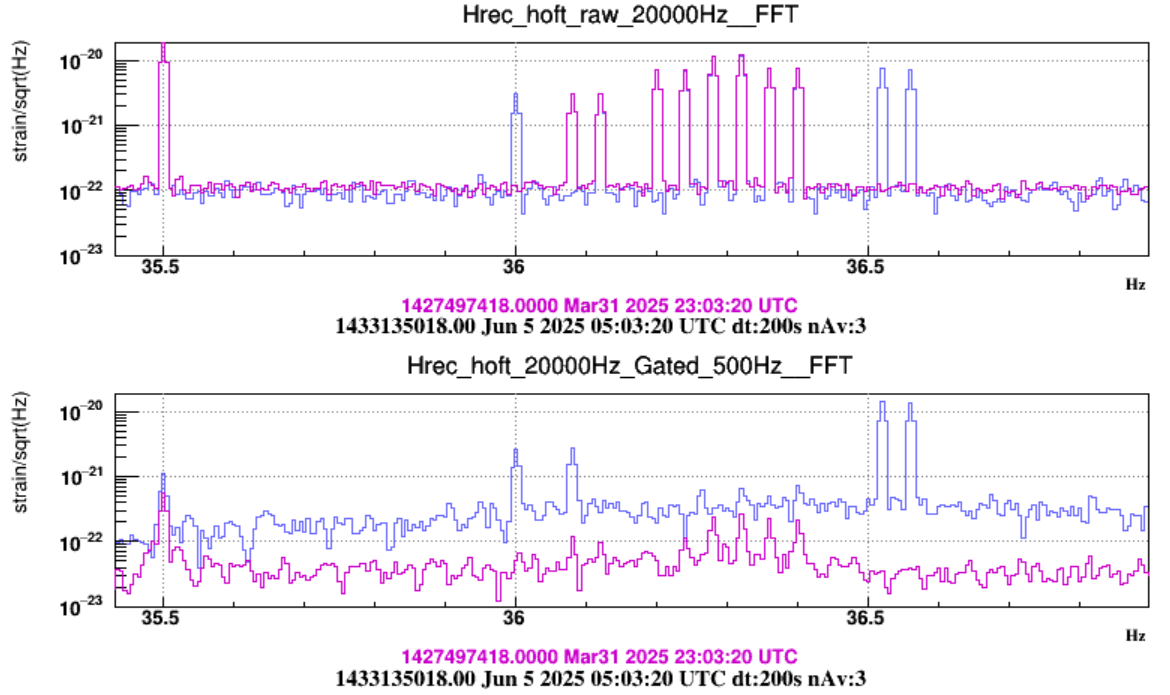
This bump is an artefact of the gating process, and doesn't exist in the original data.
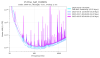
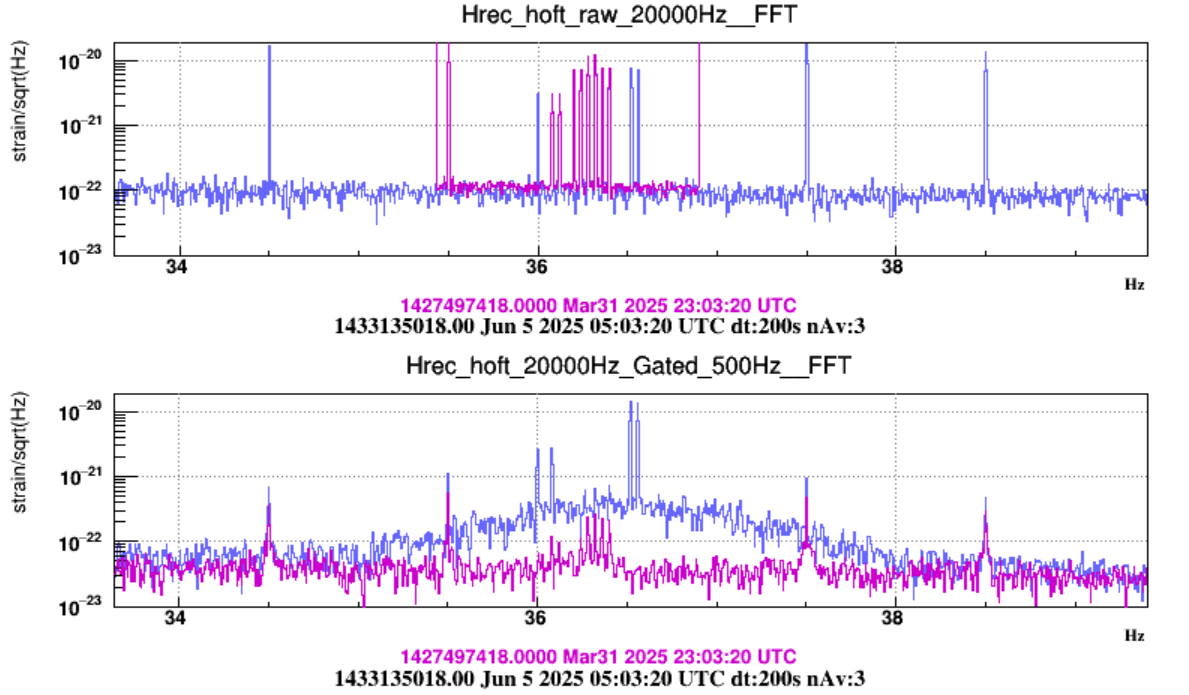
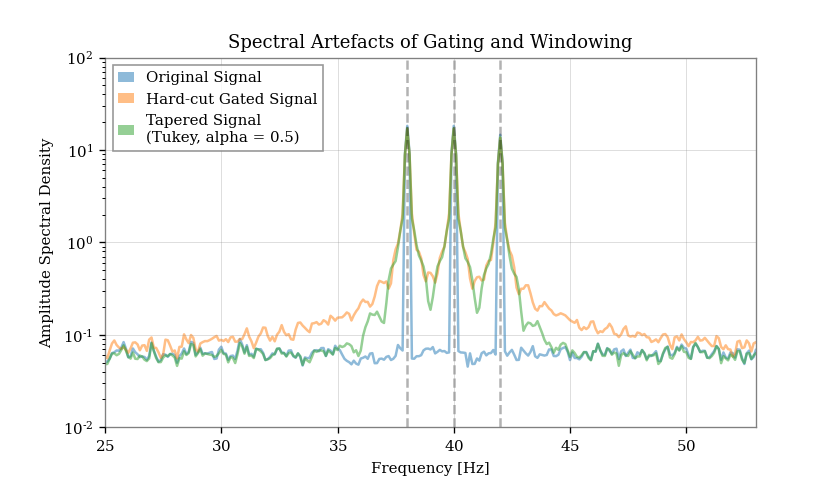
Explanation: When we gate a time series x(t) we actually perform a multiplication with a time domain gate window w(t) to zero out certain parts of it. This can introduce sharp edges if we do it "the hard way", that is, with no tapering to smooth the edges: w(t) = 1 - rect(t), with rect(t) the rectangular window centered around each piece of data to be gated. These sudden changes in the time domain lead to broadband energy in the frequency domain: x_gated(t) = x(t) · w(t) -> X_gated (f) = X(f) * W(f) (convolution theorem). That energy can cause a sharp spectral line to spread into nearby frequencies. For example, for a rectangular window w(t), W(f) = delta(f) - sinc(f). So, if X(f) is a spectral line at frequency f0, X(f) = delta(f - f0), and X_gated(f) = delta(f - f0) * [delta(f) - sinc(f)] = delta(f - f0) - sinc(f - f0). That means, instead of a sharp peak at f0, we get a main lobe and side lobes. With many lines this spreads into the observed "bump": figure 1.
Using tapered gates (like by means of a Tukey window) helps smooth out the edges and reduce this leakage, but it doesn’t completely solve the problem.
I’ve attached a plot from a simple simulation with three sinusoids (at 38, 40, and 42 Hz) in white noise. The blue line shows the Amplitude Spectral DEnsity of the original data. The orange shows what happens when I randomly cut out sections using the "hard gating" described above. There, the bump is very clear. The green line shows the same with tapered gating using a Tukey window: better, but the bump is still there, just smaller.
I’ve also attached the script I used to make the plot: feel free to play with the number and size of gated parts and the window.
EDIT: fixed an error in the formula for the window function after feedback by Samuel.


