I have estimated the relative temperature of the end mirrors point absorbers. For this purpose, I have created a matlab code to measure the temperature of the point absorber w.r.t. the mirror background temperature, excluding the hot points. The calibration in deg C is done using the reference color bar of the thermocamera application. Here are the results:
- Current NE payload:
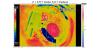
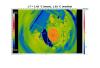
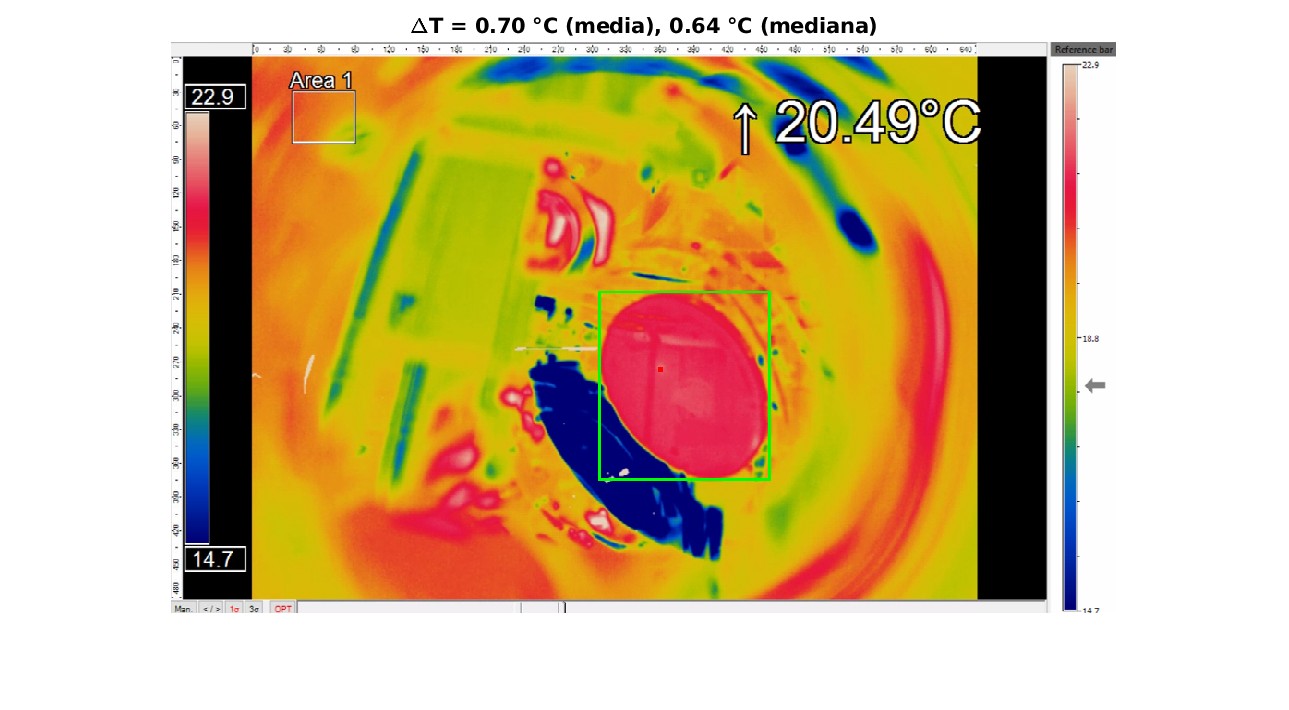
- Fig. 1 shows the image of the thermocamera with the ITF locked in CARM_NULL (see #66798);
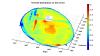
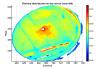
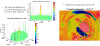
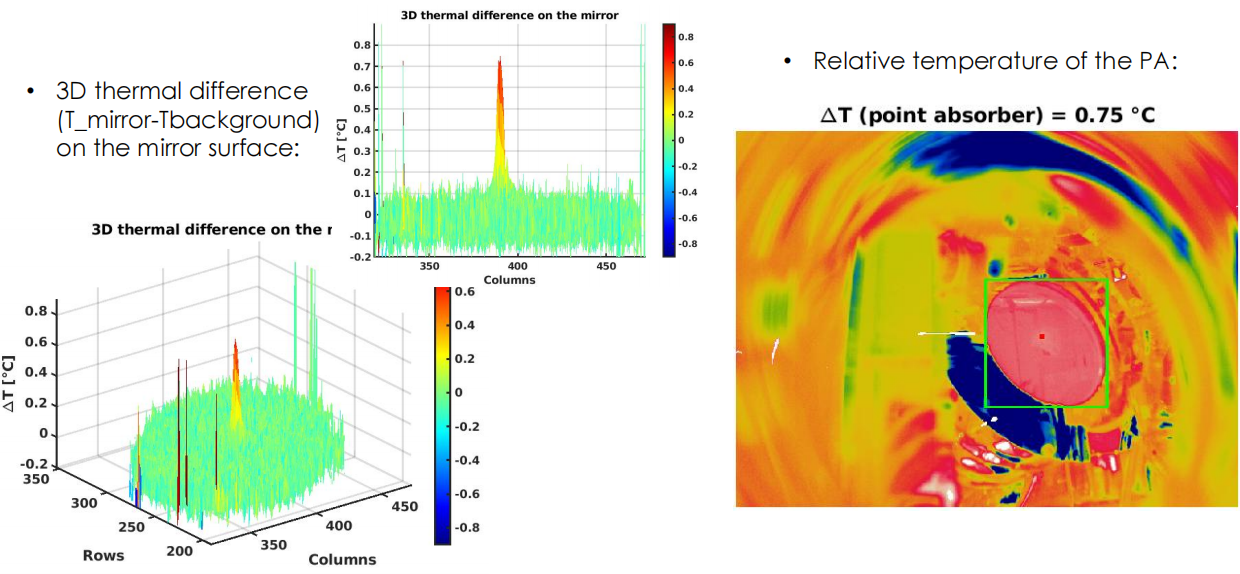
- Fig. 2 shows the output of the matlab code. The green rectangle highlights the selected region on the mirror surface used for background temperature calculation. Note that only the uniform mirror area is considered, excluding hot spots, for the mean background temperature. The point absorber is identified as the location with the highest temperature (marked in red). The calculated temperature difference (ΔT) between the PA and the mirror background is 0.7 °C;
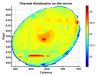
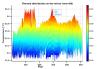
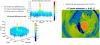
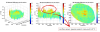
- Fig. 3 provides a 3D reconstruction of the temperature distribution over the mirror surface.
- Old WE payload:
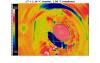
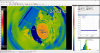
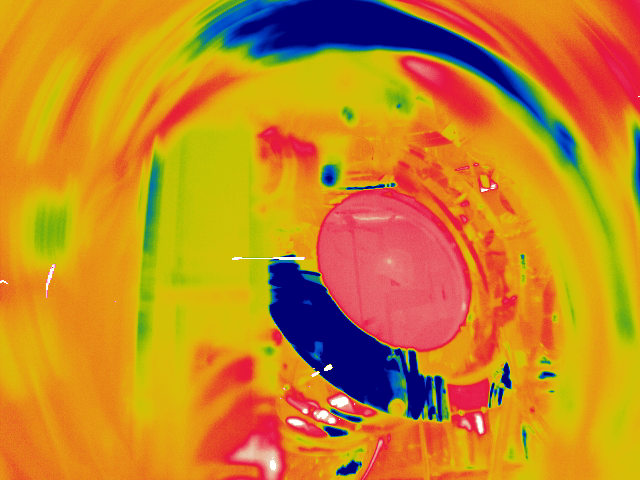
- Fig. 4 shows the old WE payload with the ITF locked in CARM_NULL (images from #66795);
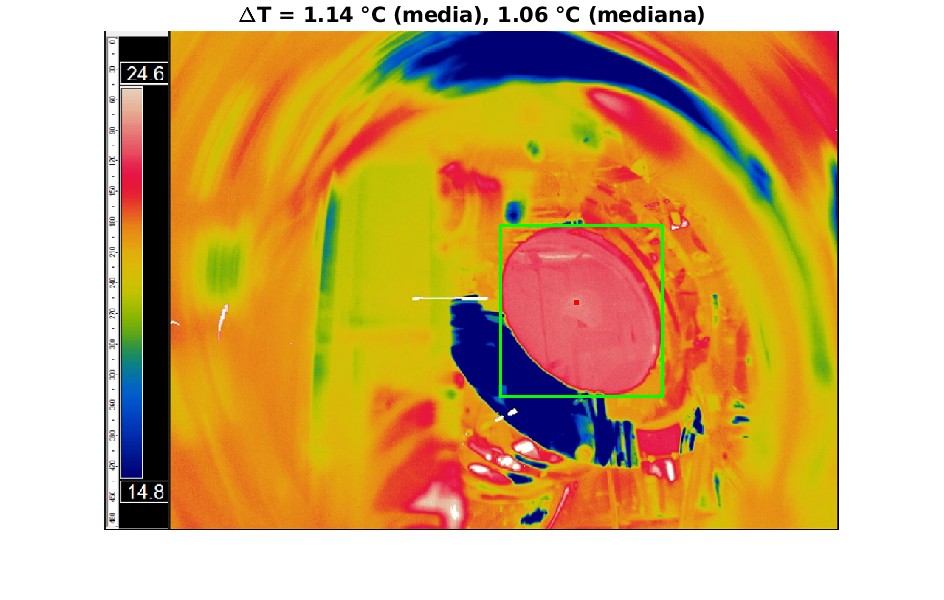
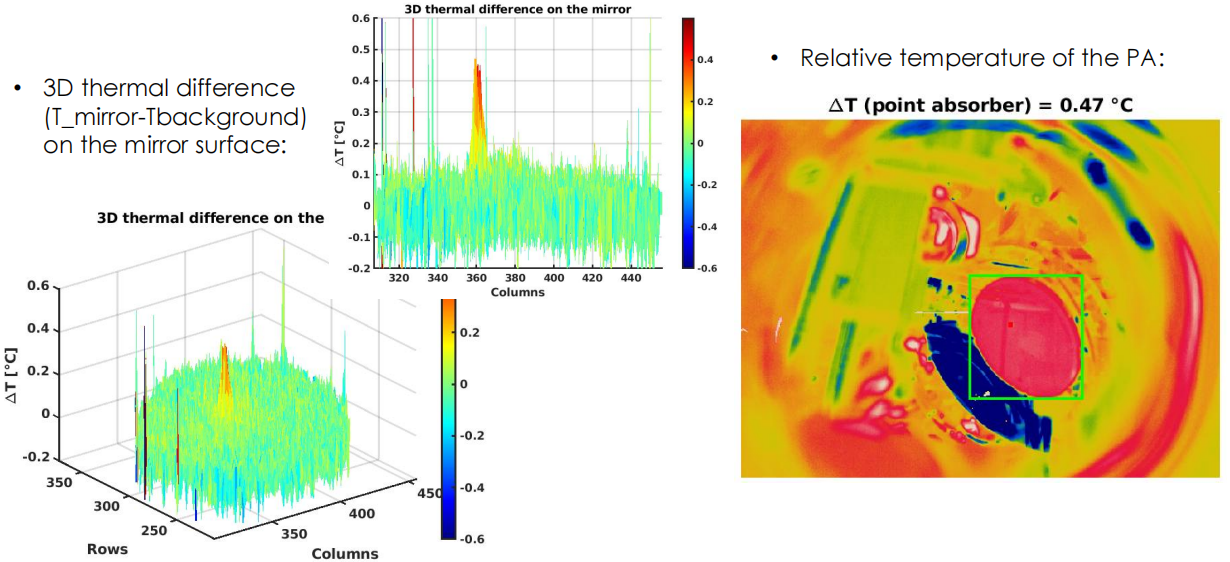
- Fig. 5 shows the matlab output code (using the same methodology as for the NE mirror). The measured temperature difference (ΔT) is 1.14 °C;
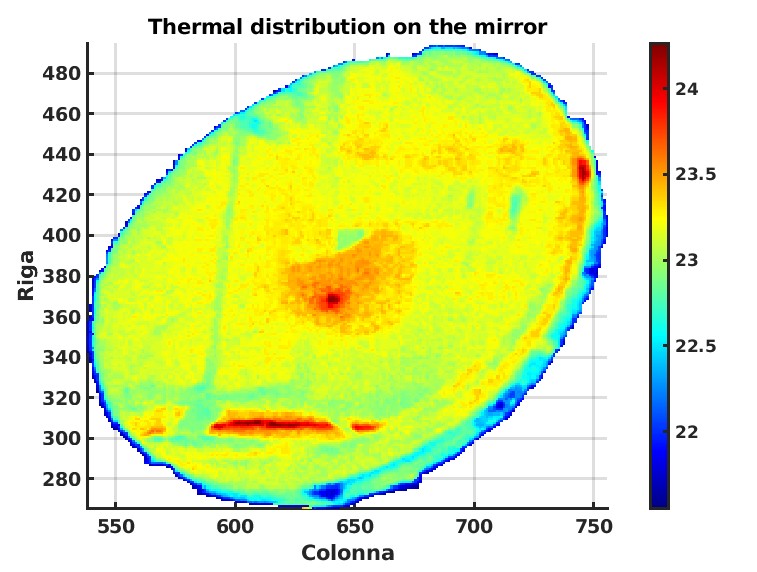
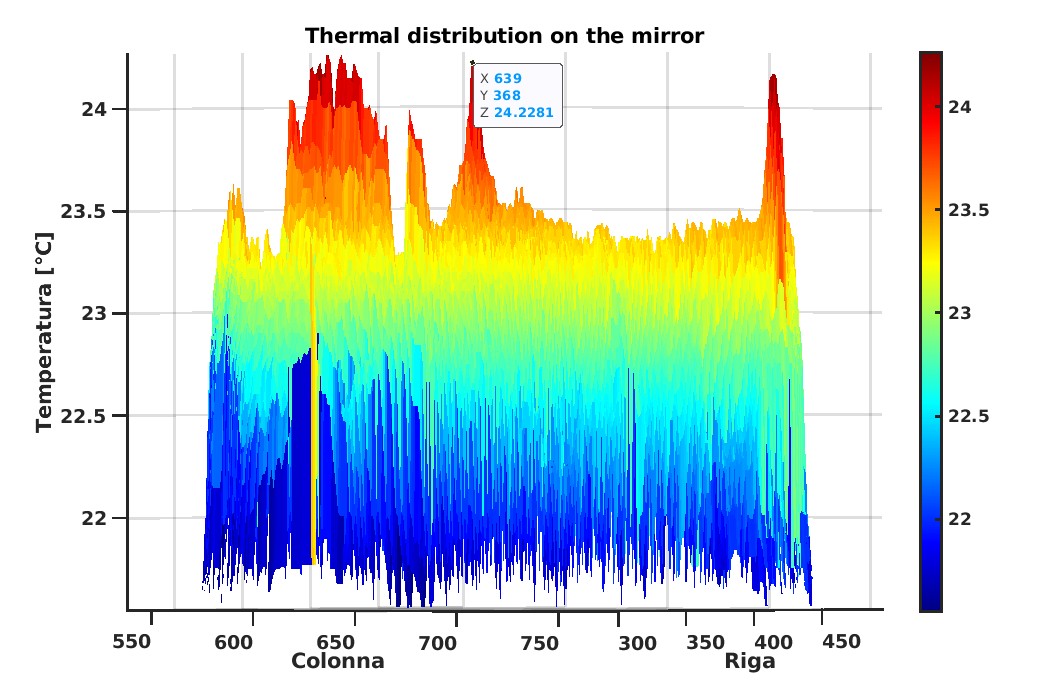
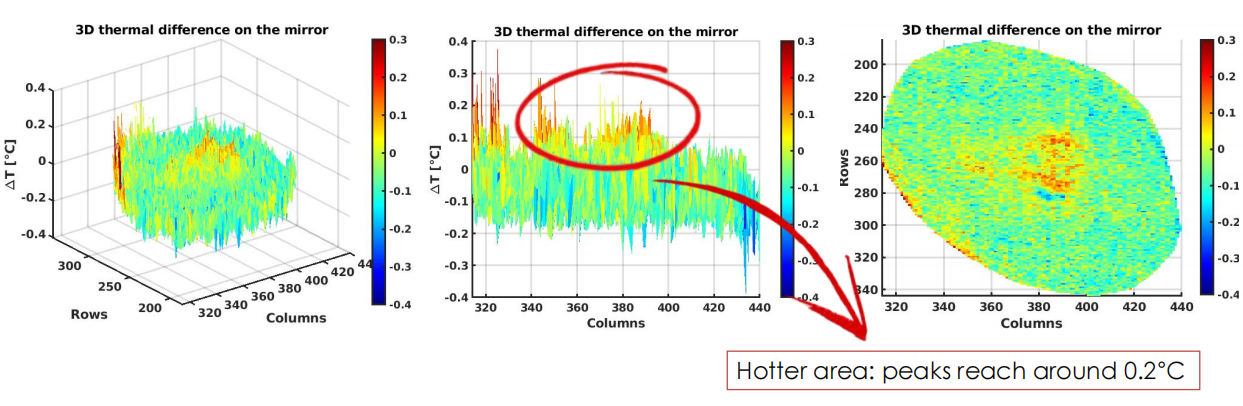
- Figs. 6 and 7 display 3D temperature maps reconstructed from the thermocamera images.
- New WE payload (after intervention #66852):
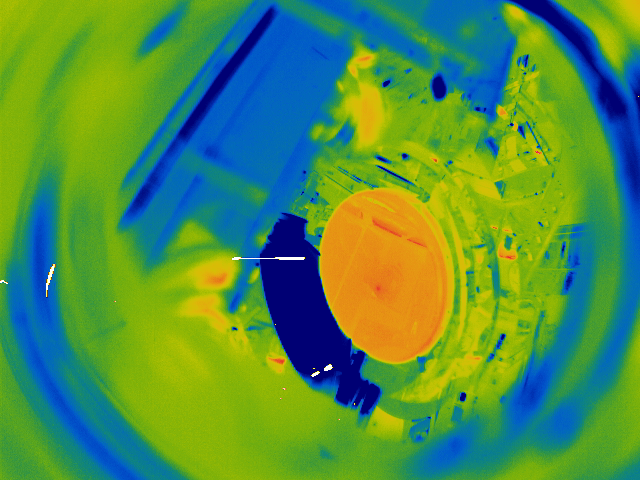
- Fig. 8 shows the new WE with the ITF locked (images taken today during CARM_NULL state, see #66887);
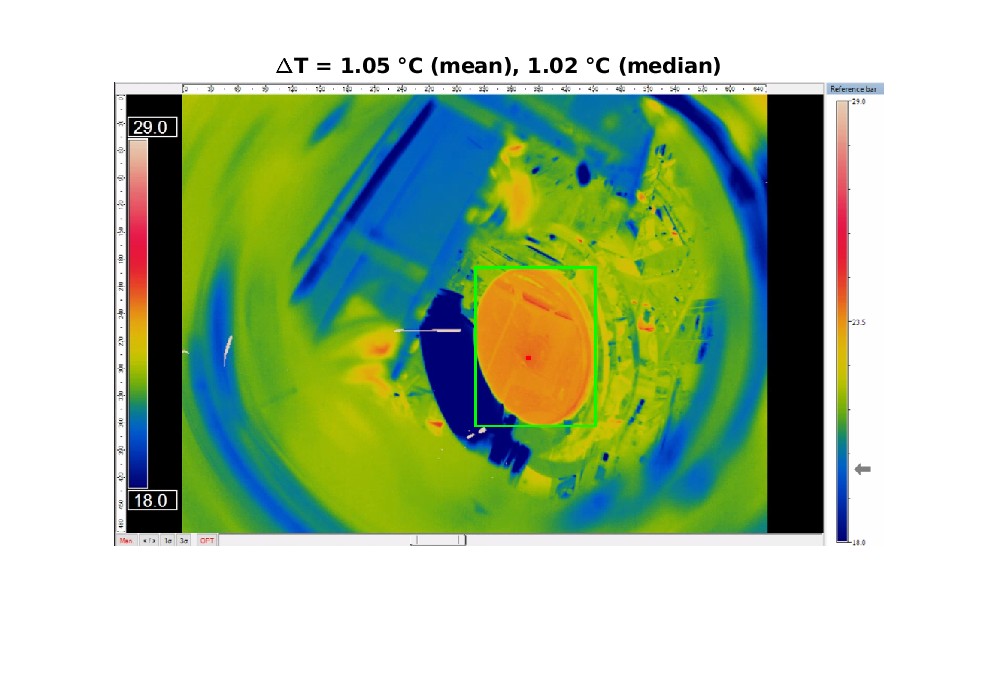
- Fig. 9 shows the MATLAB analysis results. The calculated ΔT between the PA and background is 1.05 °C;
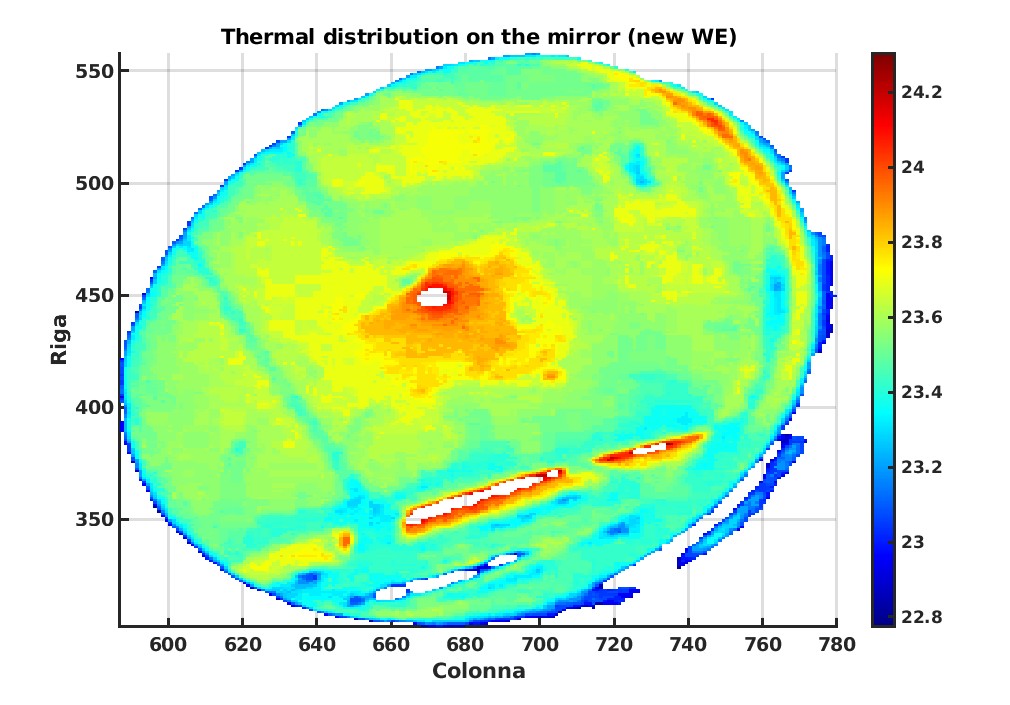
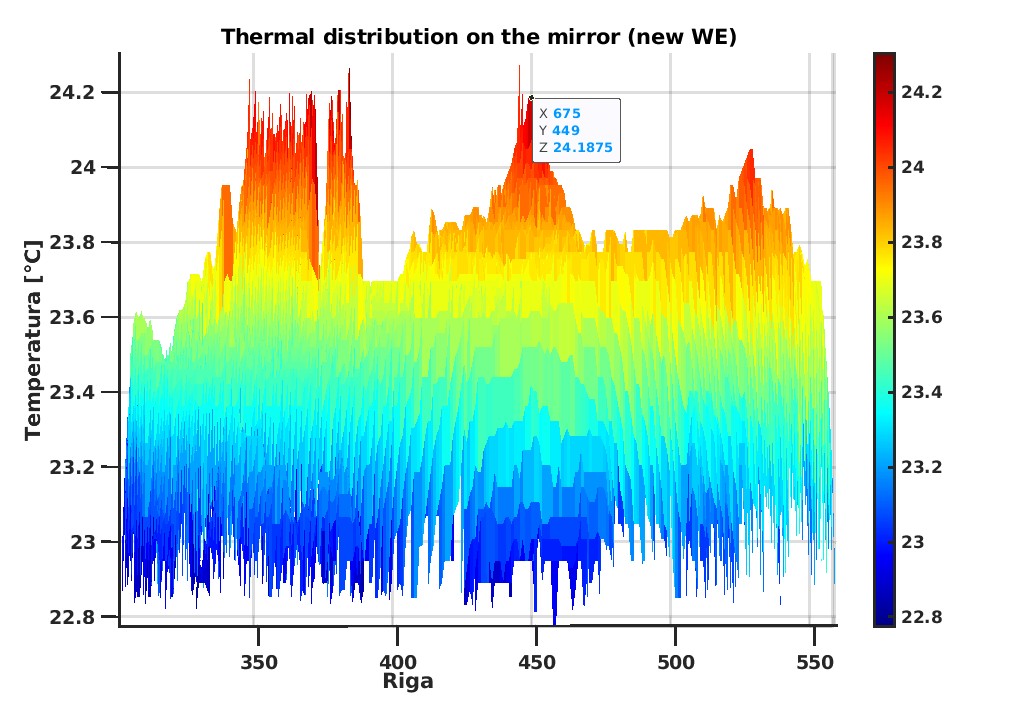
- Figs. 10 and 11 provide the corresponding 3D temperature maps.
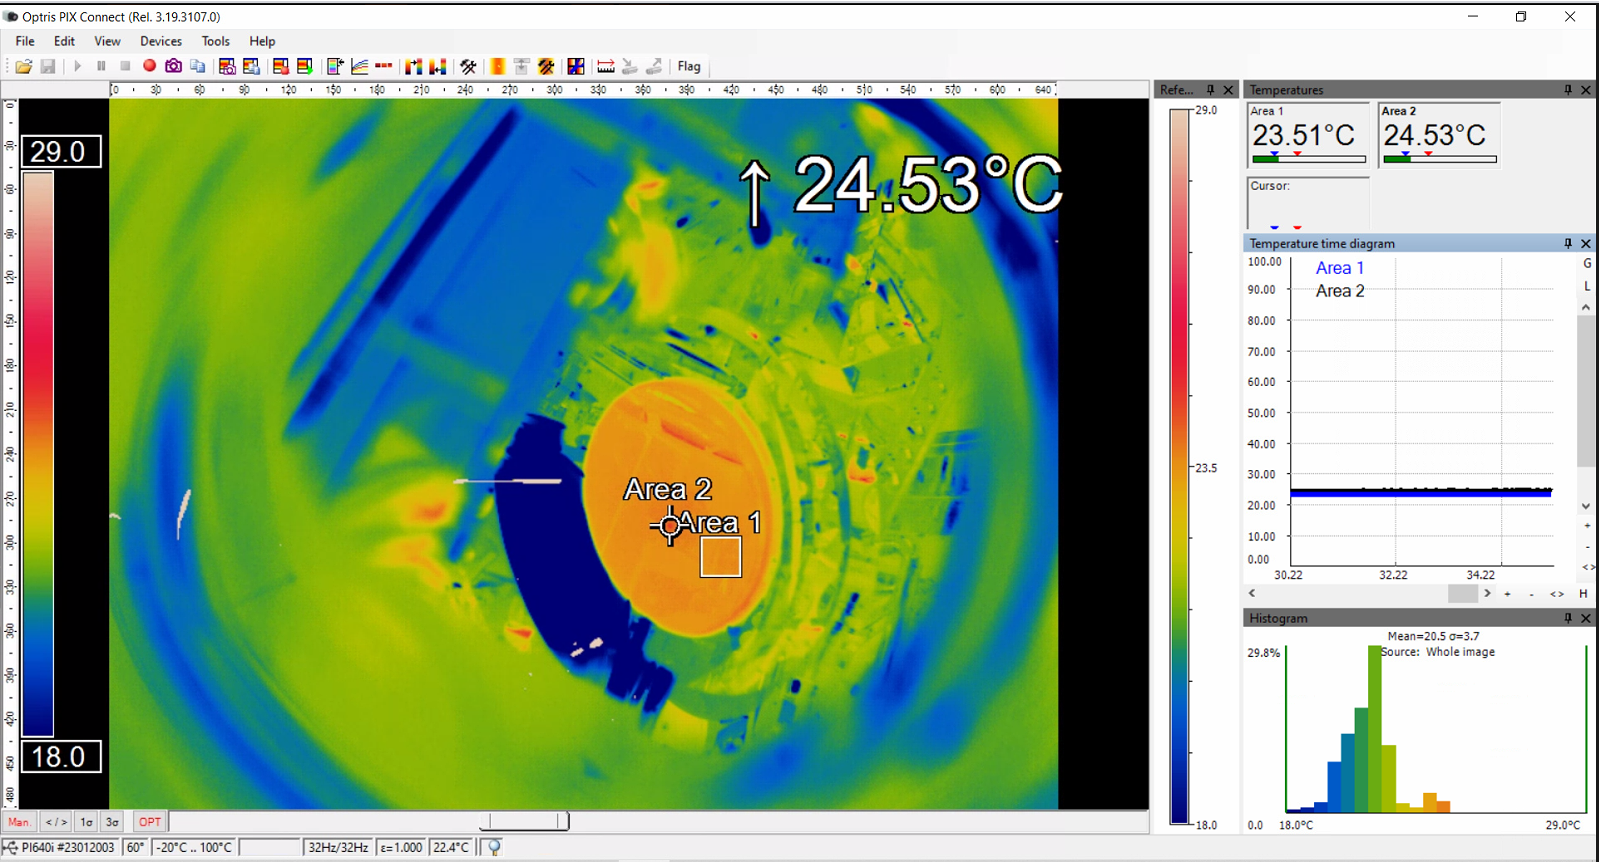
At the time of the measurements of the old WE payload and the current NE the matlab code wasn't ready for use yet. To validate the code’s accuracy, I performed additional measurements today using the Optris thermocamera application. On Fig. 12 we can see the measurements areas defined. "Area 1" represents the mean background temperature within the selected rectangle (23.51 °C), while "Area 2" indicates the maximum temperature at the PA location (24.53 °C). As we can see the temperature difference is 1.02°C, which is very close to the value found with the matlab reconstruction.
.png)


.png)