Some comments on the magnetic coupling functions (CFs) measured since the beginning of the O4b run.
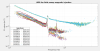
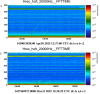
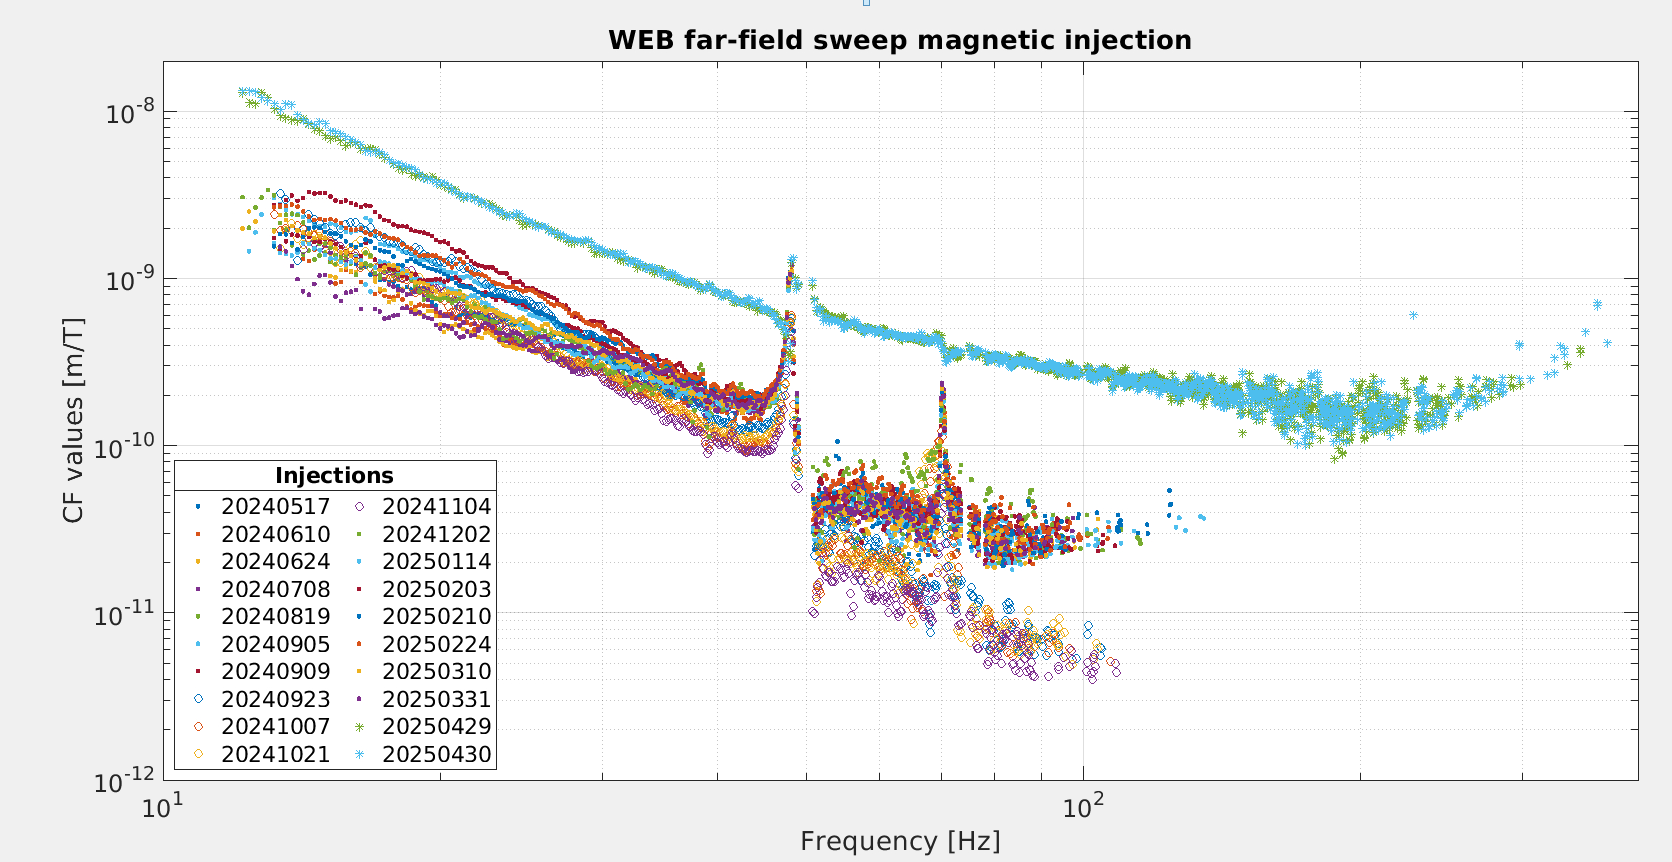
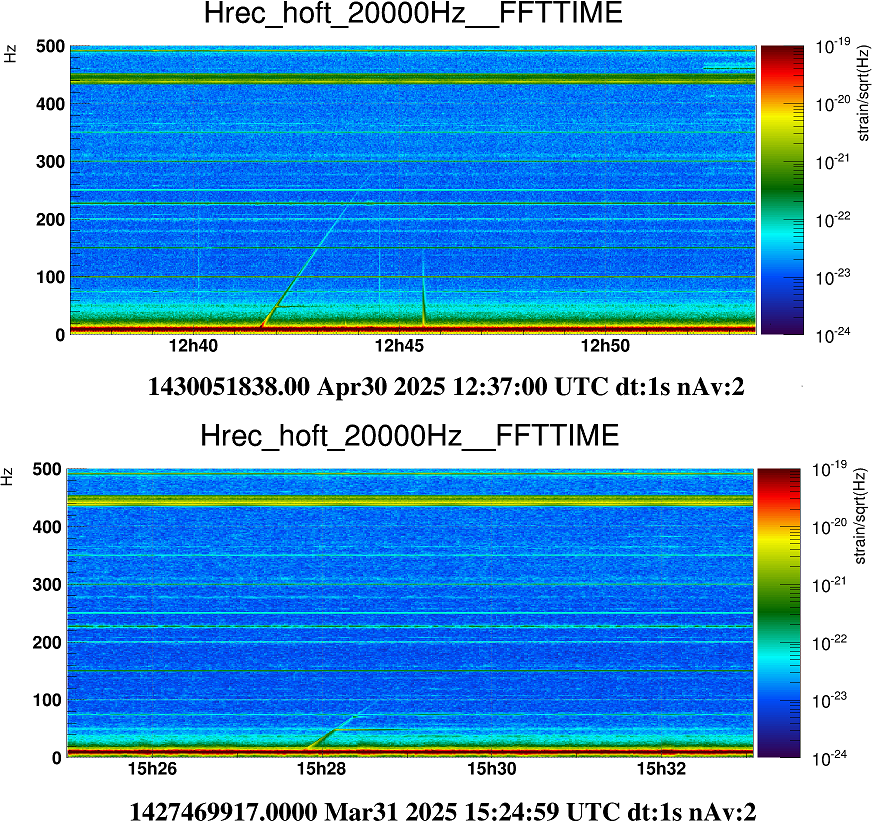
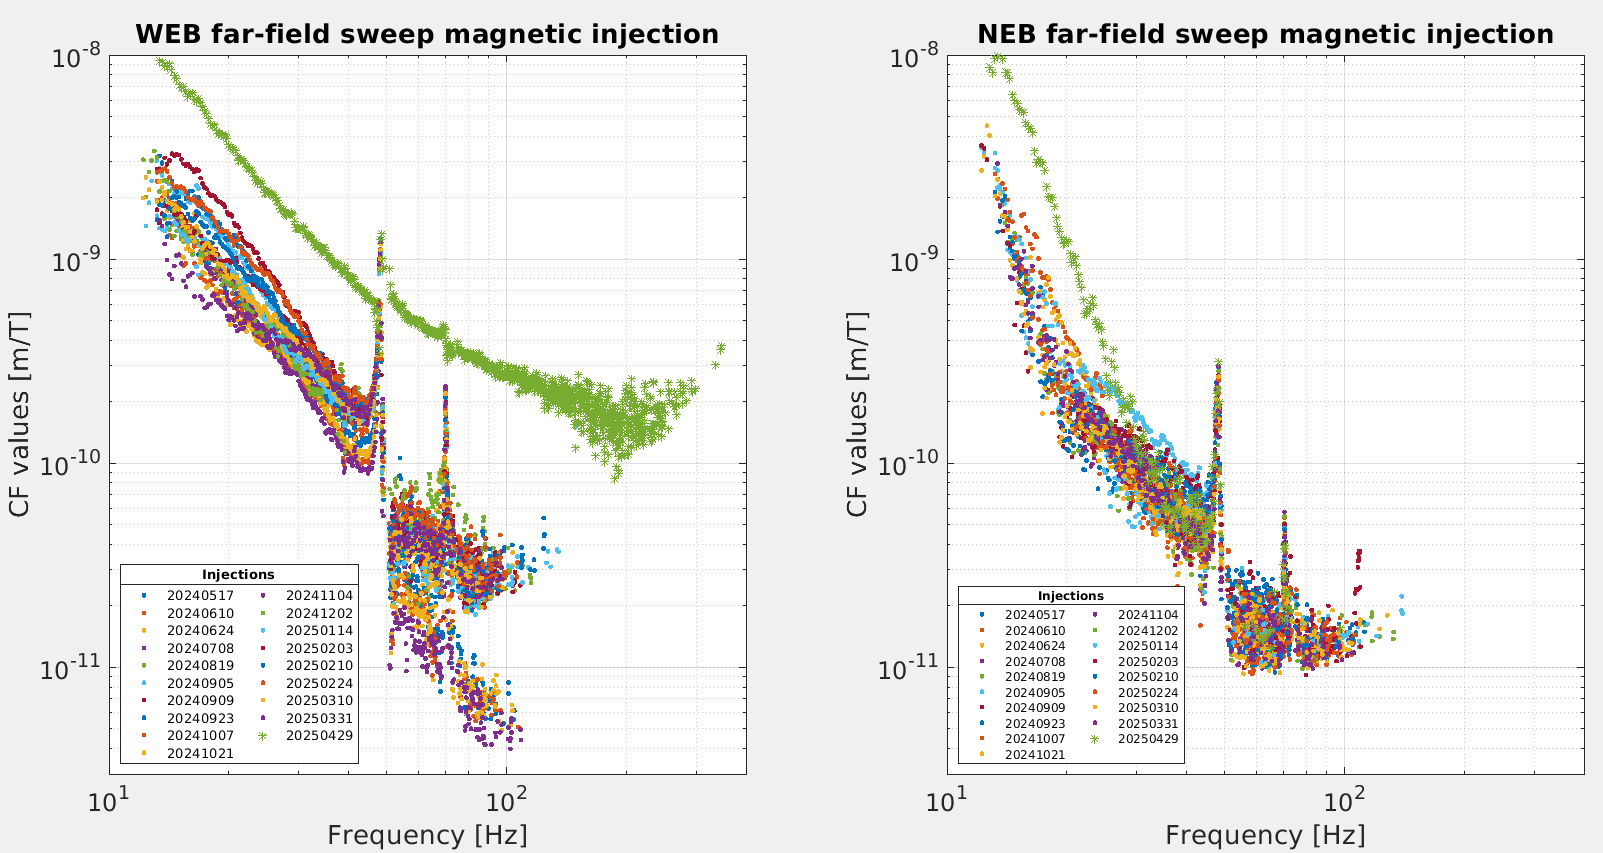
- After the mirror installation, the WE magnetic injections performed on April 29 (ENV shift) and 30 (Autometed injections) show a broadband worsening of the magnetic coupling compared to previous injections, as shown in Figure 1 (green and light blue asterisk markers), and in the Hrec spectrograms (top: after, bottom: before the installation of the new mirror), Figure 2.
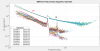
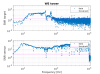
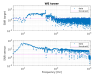
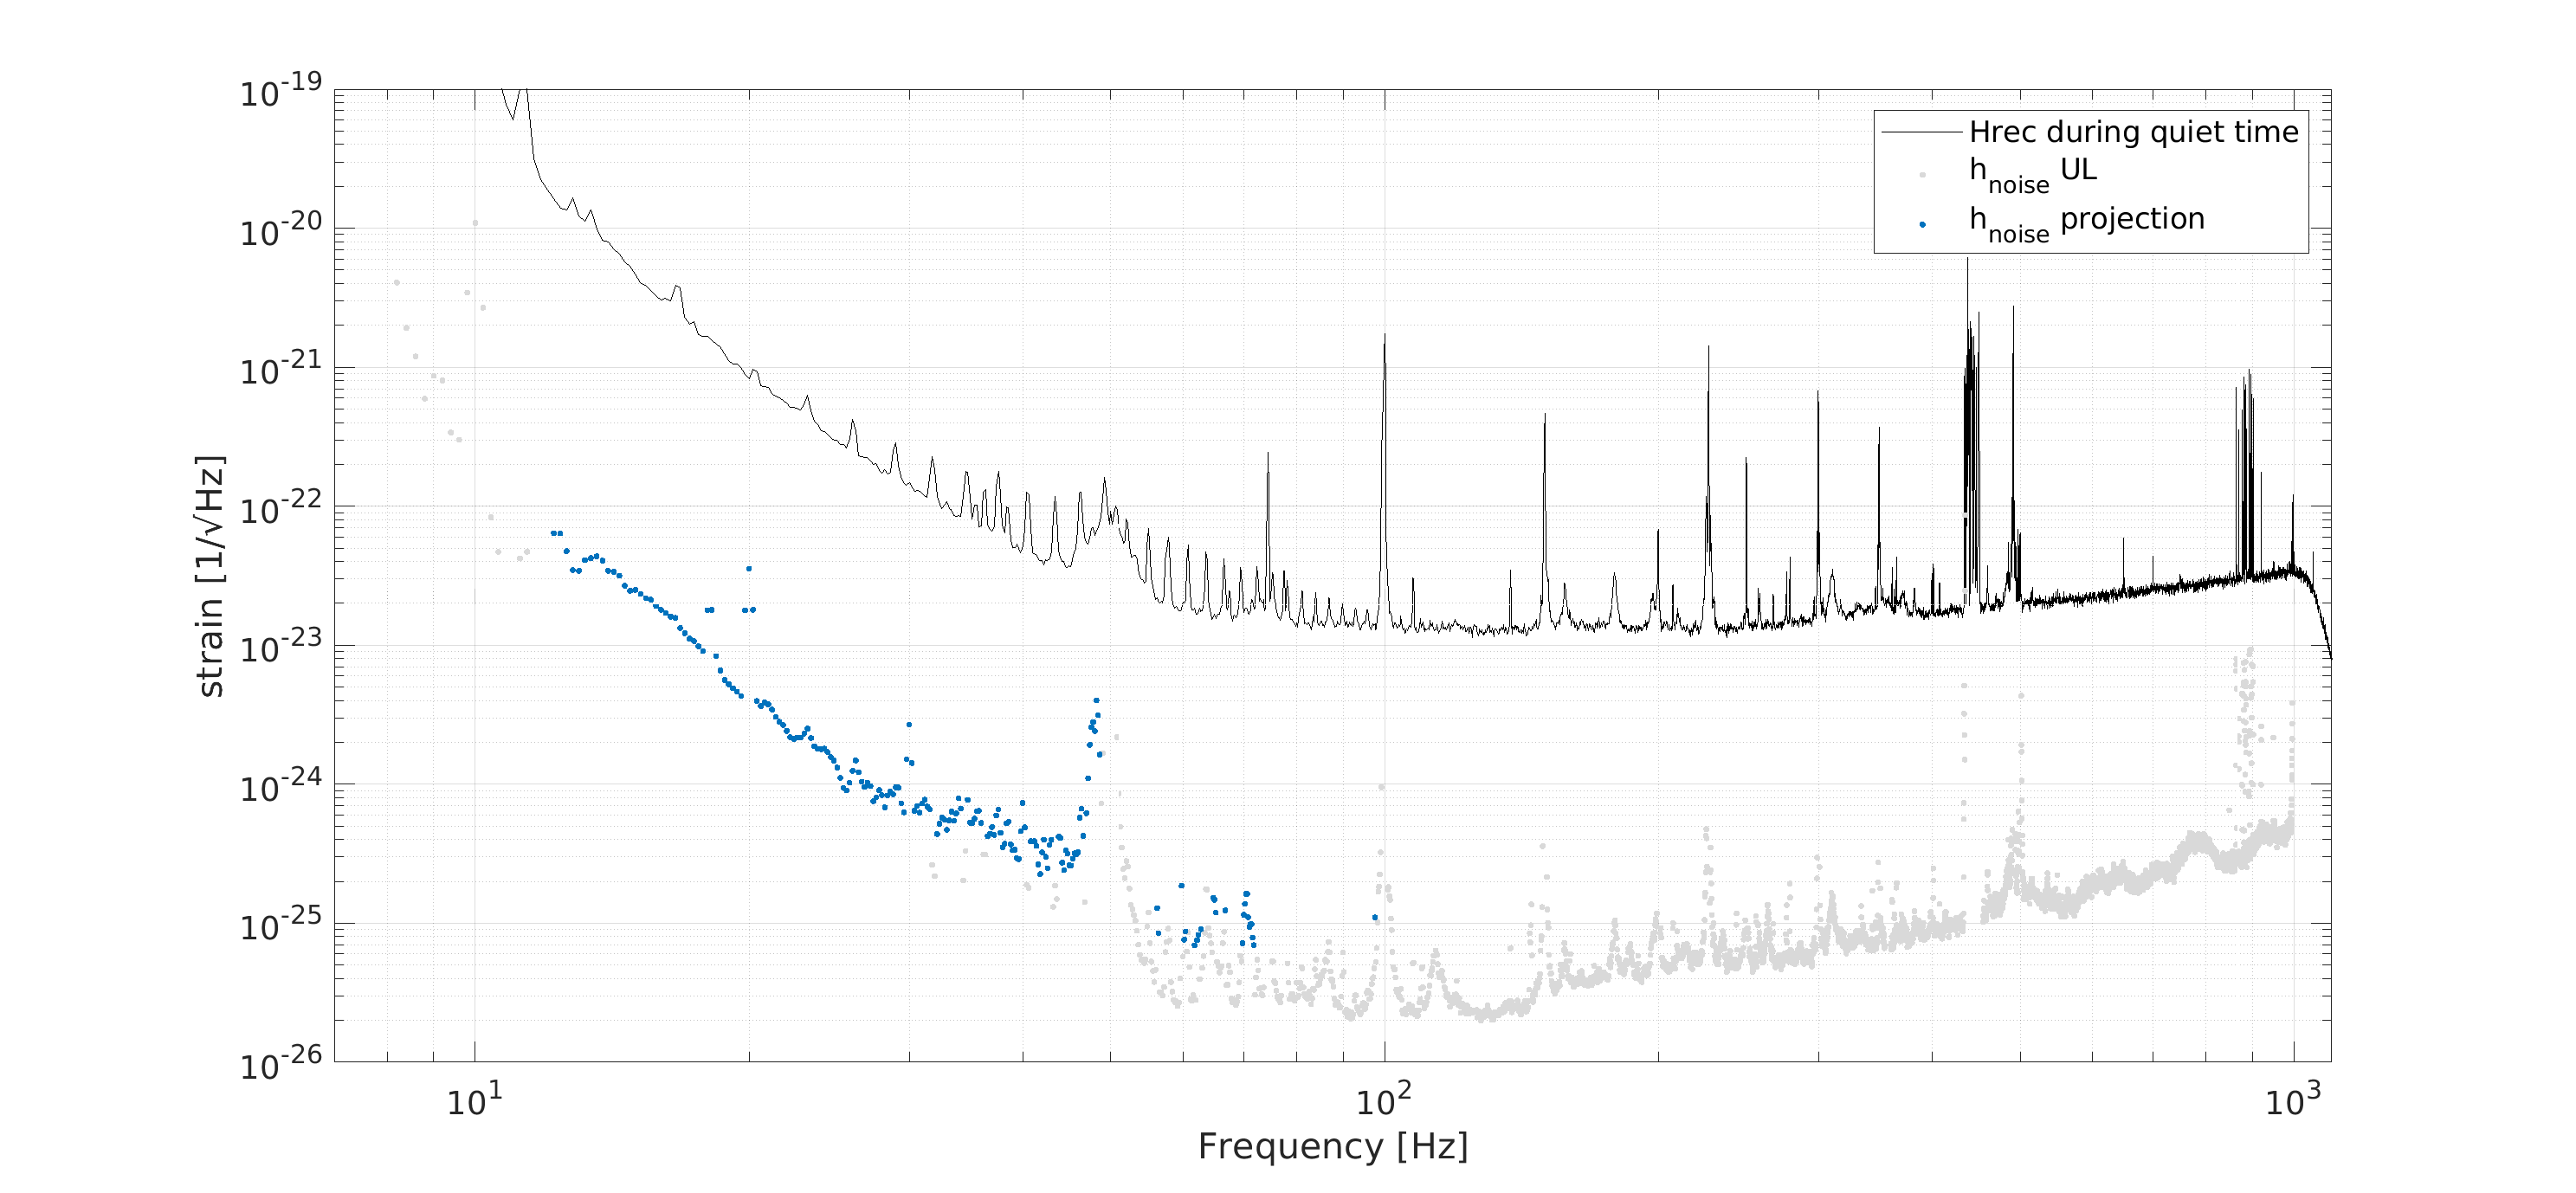
- The WE noise projection (after the mirror installation) indicates a possible limitation of the sensitivity in the range 40-80 Hz, Figue 3.
- Figure 4 shows:
- for frequencies below ~50 Hz, the slope of the coupling functions is approximately 1/f² and appears consistent with that of the previous injections;
- the slope of the CFs is approximately 1/f in the frequency range of ~50–200 Hz.
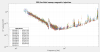
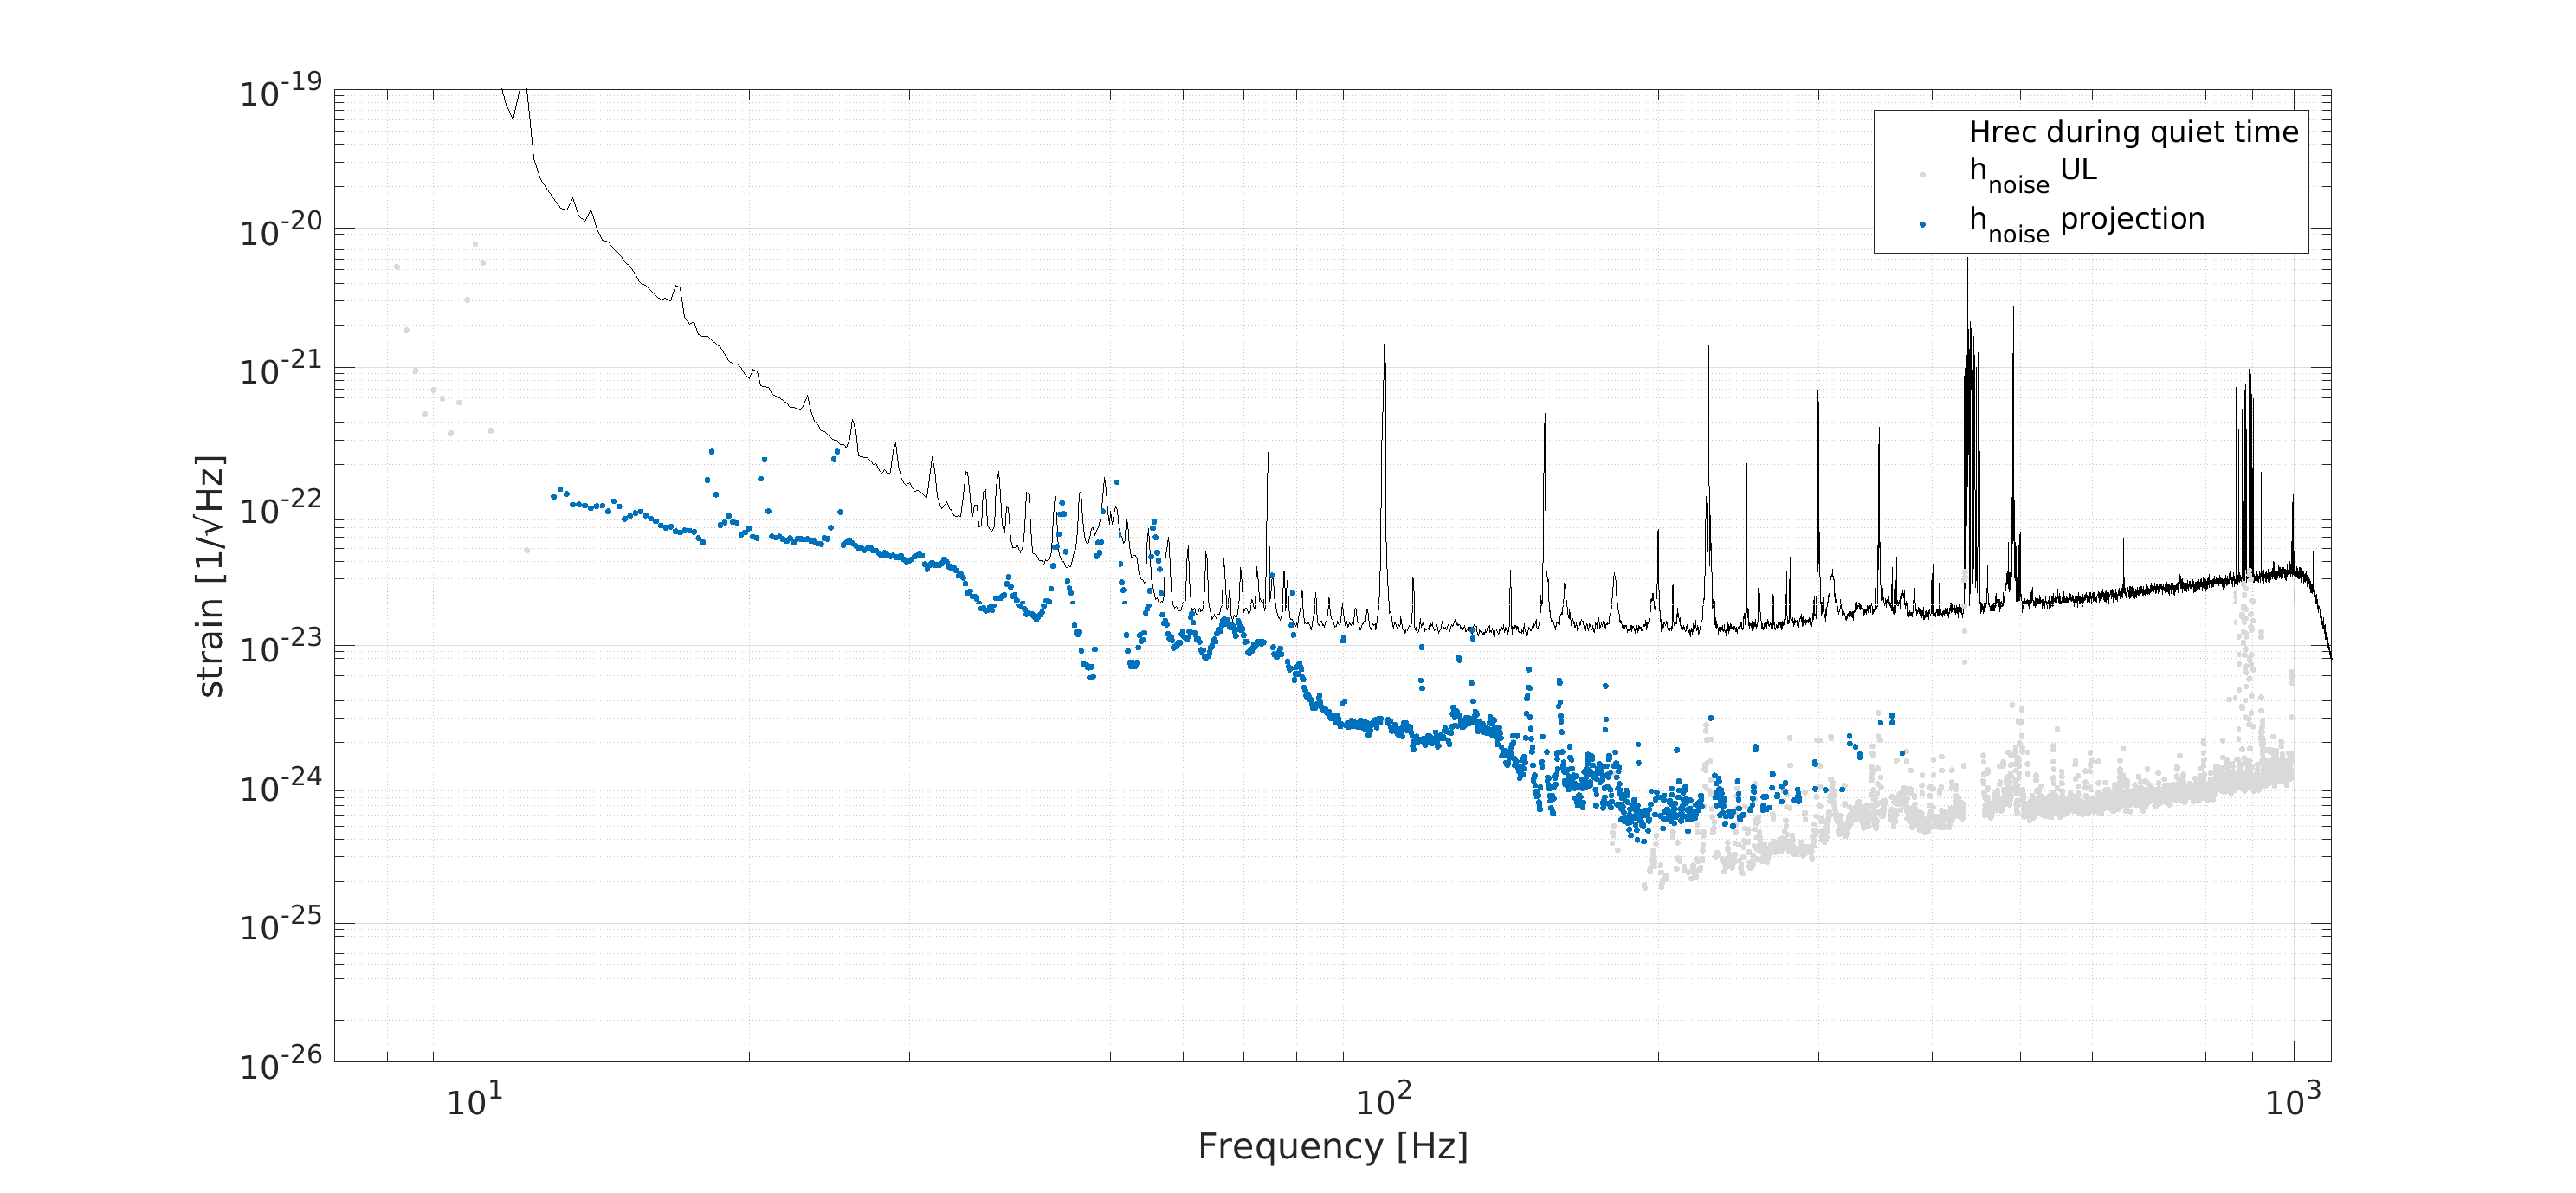
- After the installation of the mirror, the NEB CF also appears to have worsened for frequencies below ~40 Hz, Figure 5 (right plot, green asterisk markers). However, the magnetic noise projection lies below the sensitivity curve and is therefore not a limiting factor, Figure 6.
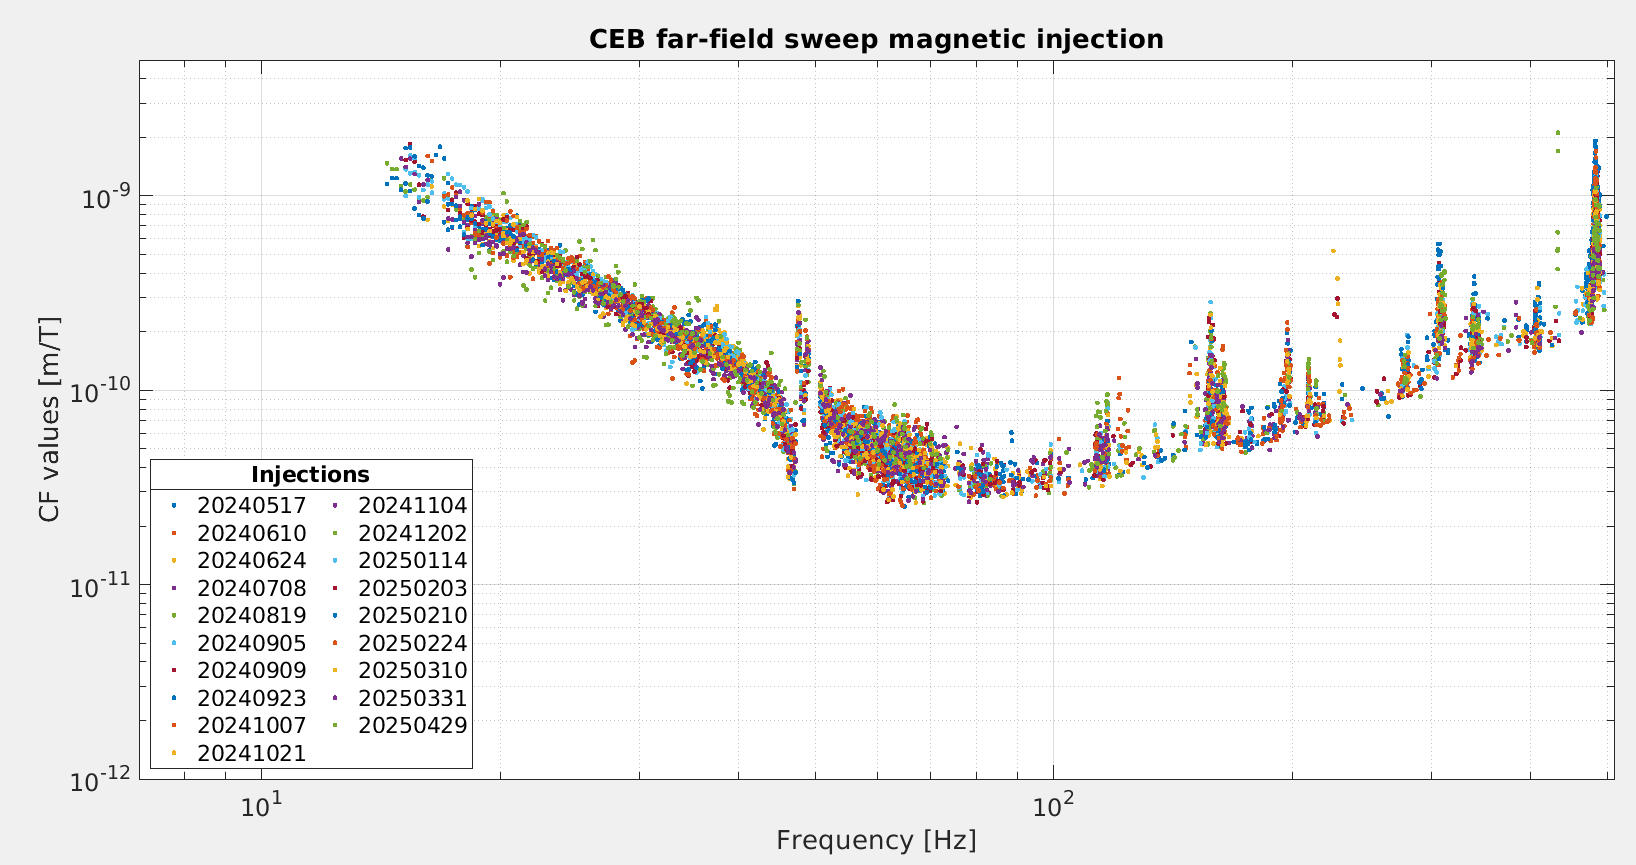
- Regarding the far-field magnetic injections in the CEB, no significant variations are observed before and after the mirror intervention, Figure 7.
- Taking into account the coupling functions computed before the installation of the WE mirror, the following can be observed (see Figure 5):
- the CF values of the WE building are higher than those of the NE building;
- for frequencies ~10-20 Hz, the CFs of the NE building exhibit a steeper slope compared to those of the WE building;
- a reduction in CF values and a change in slope are observed during the WE magnetic injections performed on September 23, October 7 and 21, and November 4, 2024. This behavior is due to an increase in the SNR of the magnetometer for frequencies above ~50 Hz during the injections, Figure 8 (high SNR) and Figure 9 (low SNR).
Note: CF values, upper limits, and main figures of merit are collected in the Git repository: https://git.ligo.org/virgo/environmental/couplingfunctions/-/tree/main/O4/Magnetic?ref_type=heads


