Given the renewed interest in 25-minute glitches, I revisited previous analyses (#63479) using January data, particularly noting a variation in glitch rates around January 12-14.
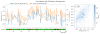
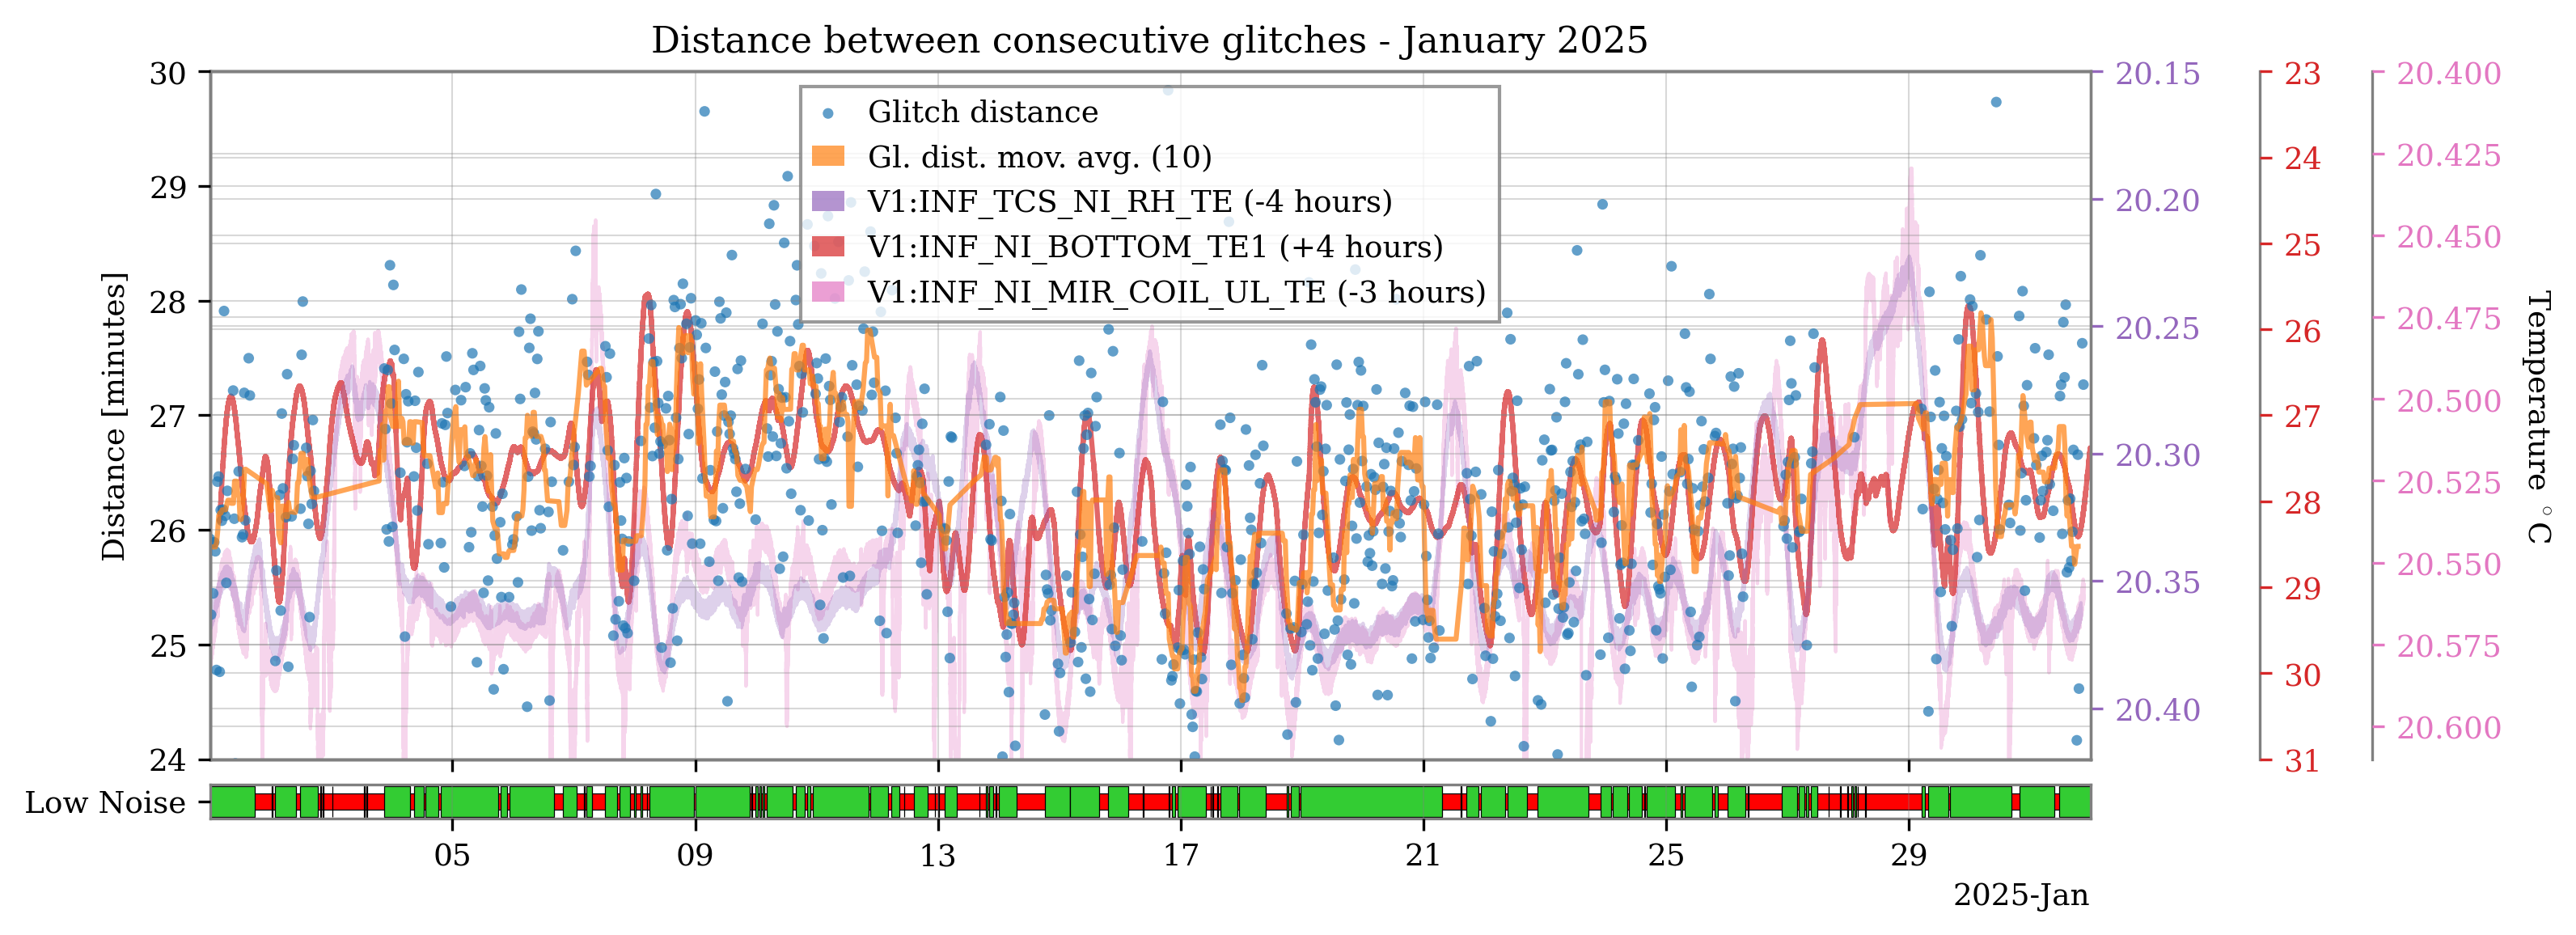
Figure 1 presents a scatter plot of the distances between consecutive glitches, along with their moving median (orange curve). Overlaid are temperature readings from the North Input (NI) bottom, the NI Ring Heater, and the NI mirror coil. The same time delays applied in previous analyses have been used (#63479). The Pearson correlation coefficient with the first temperature channel is -0.72, while correlations with the others are -0.09 and -0.14 respectively. This confirms a stronger relationship between glitch rates and tower temperature rather than mirror temperature.
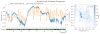
To further investigate the glitch and temperature behavior between January 12 and 14, I analyzed the correlation between the V1:INF_NI_BOTTOM_TE1 channel and all the other temperature probes in the trend frame. The highest correlation was with the corresponding thermometer at the West Input, V1:INF_WI_BOTTOM_TE1: Figure 2. However, the observed temperature jump, and glitch rate increase, were anti-correlated with (and possibly caused by) a 1°C drop in the central building: Figure 3.
Overall, this quick analysis aligns with previous results but provides no new insights into the underlying cause of the 25-minute glitches.
