Investigating the retard relation is definitely a valuable additional piece of information to the characterization of these glitches. However, the estimated delays don't seem to be correct. There is likely an issue with the glitch rate median estimation. I assume the blue curve is a running median on the distances between N consecutive glitch trigger times or the GPS times of the maxima of some Hrec BRMS time series. However, the GPS time to attribute to each estimate must correspond to the central point (ref. for example #63147) otherwise you shift your median estimates by N/2 * "25 minutes". To be more precise, the term within quotes should be the estimated running median delay itself.
In the quoted entry (#63147, fig.4), I estimated that the effect on V1:INF_TCS_NI_RH_TE is delayed by about 8 hours from the temperature measured by V1:INF_NI_BOTTOM_TE1, and the two have typical cycles of about 20 hours. (I don't know how much this delay depends on the temperature itself, as per the Stefan–Boltzmann law, but I will assume it to be negligible in this context) This is why I suspect an error in the original post on the estimated delay of the glitches and the RH TE 268.5 min, and the NI BOTTOM TE 273 min (~ 4h30). These times don't quite add up to 8 hours.
Additionally, in #63147, I "visually showed" the presence of a delay between the glitch time series and the NI BOTTOM temperature, and a much closer similarity/synchronicity with V1:INF_TCS_NI_RH_TE. Let' s reexamine this point, this time avoiding being tricked by the running median. For this reason, I compared directly the glitch distances with the temperature channels.
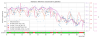
Figure 1: scatter plot of the omicron glitch trigger distance (same selection criteria described in #62965) together with three temperature sensors: V1:INF_TCS_NI_RH_TE (violet), V1:INF_NI_BOTTOM_TE1 (red), and V1:INF_NI_MIR_COIL_UL_TE (pink). There is also a transparent median curve but ignore it for the moment.
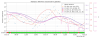
Figure 2: detail of the previous plot around the longest low noise segment. There is visible a delay between all the above quantities, likely due to different irradiation from the heating belts and the specific heat capacity of the various parts.
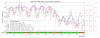
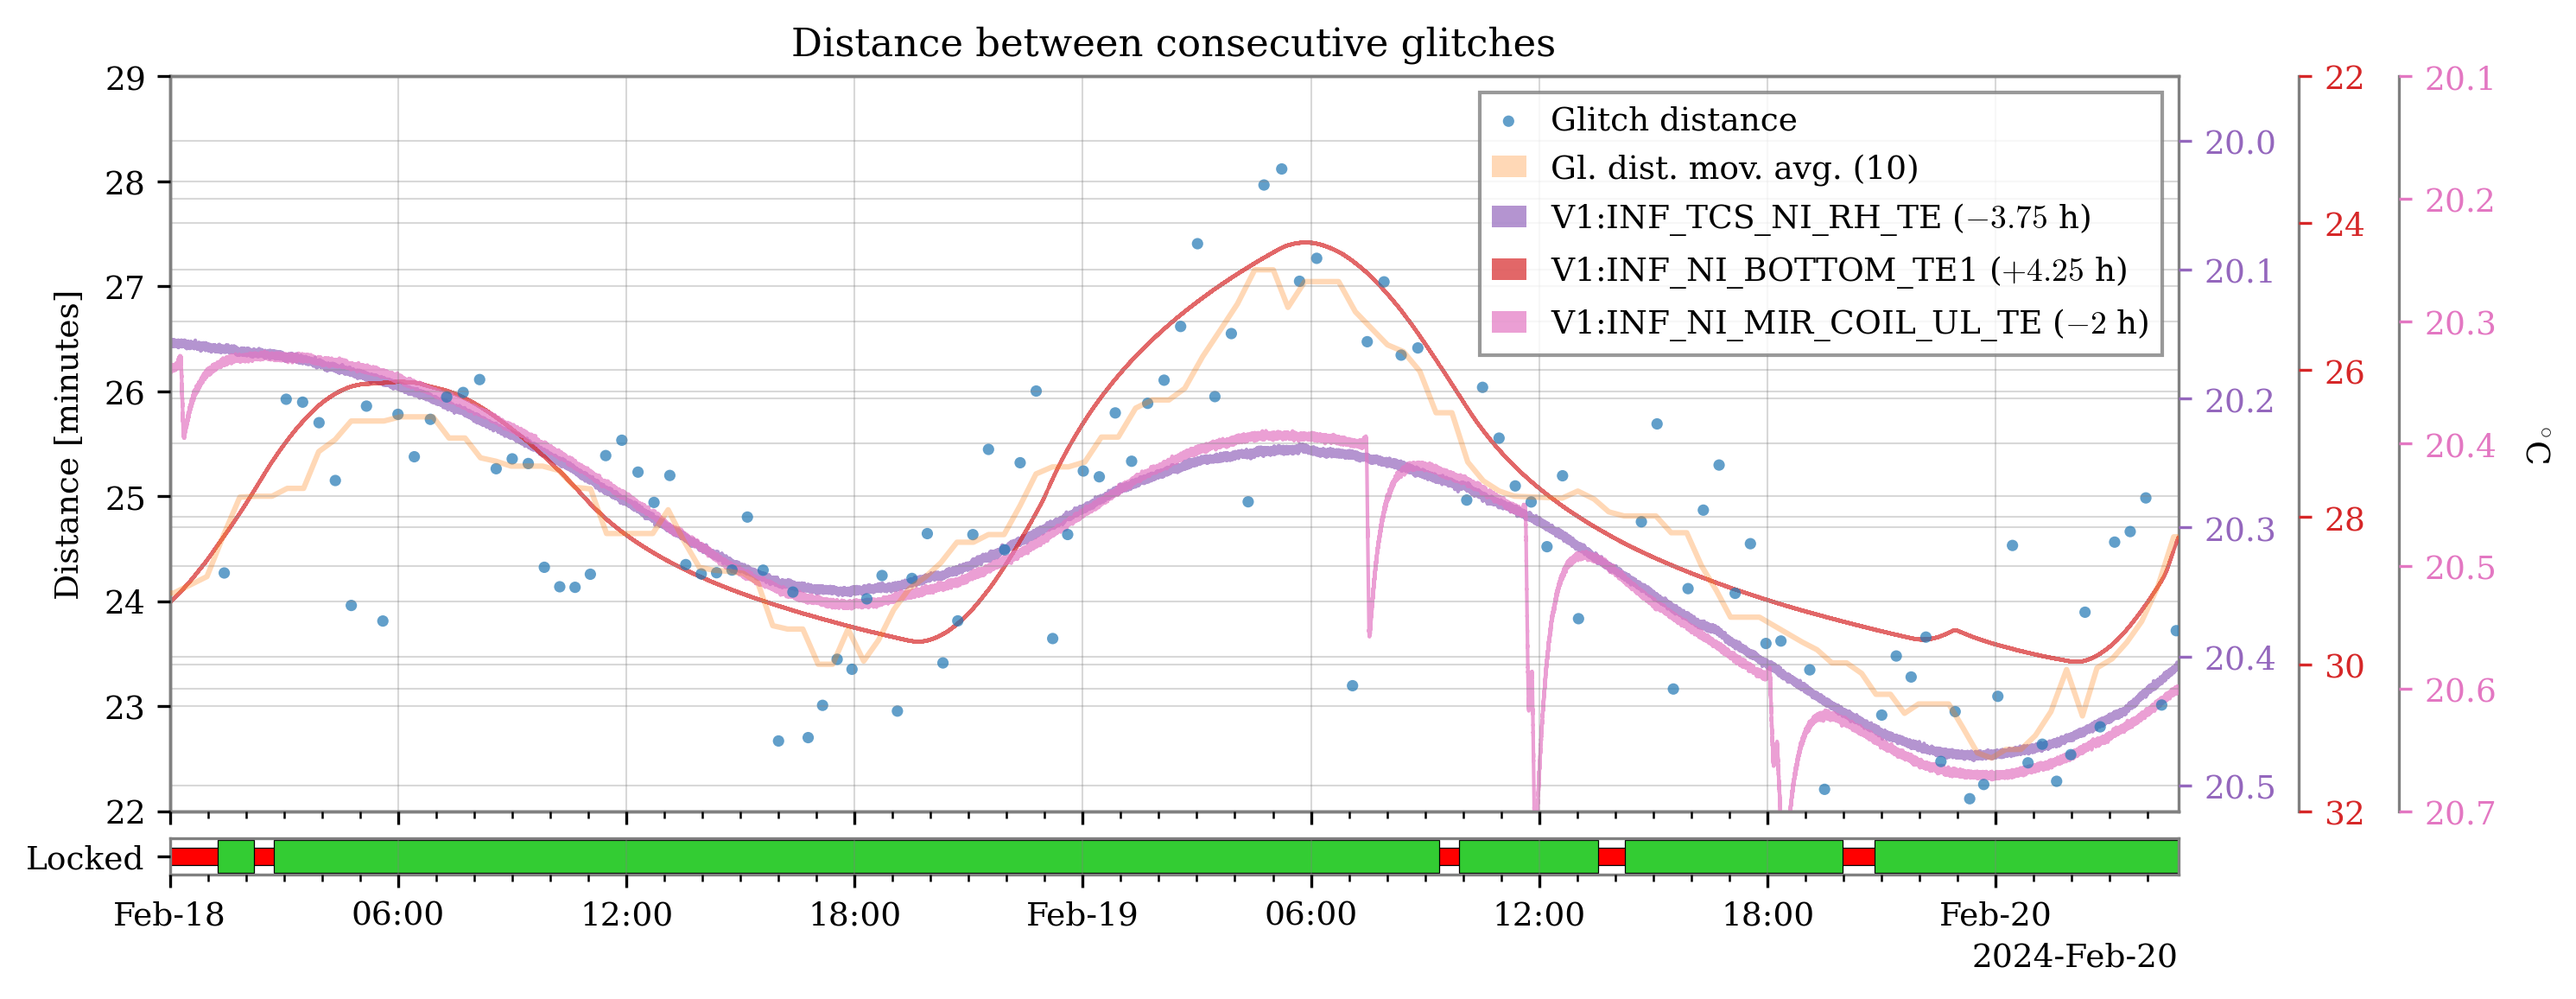
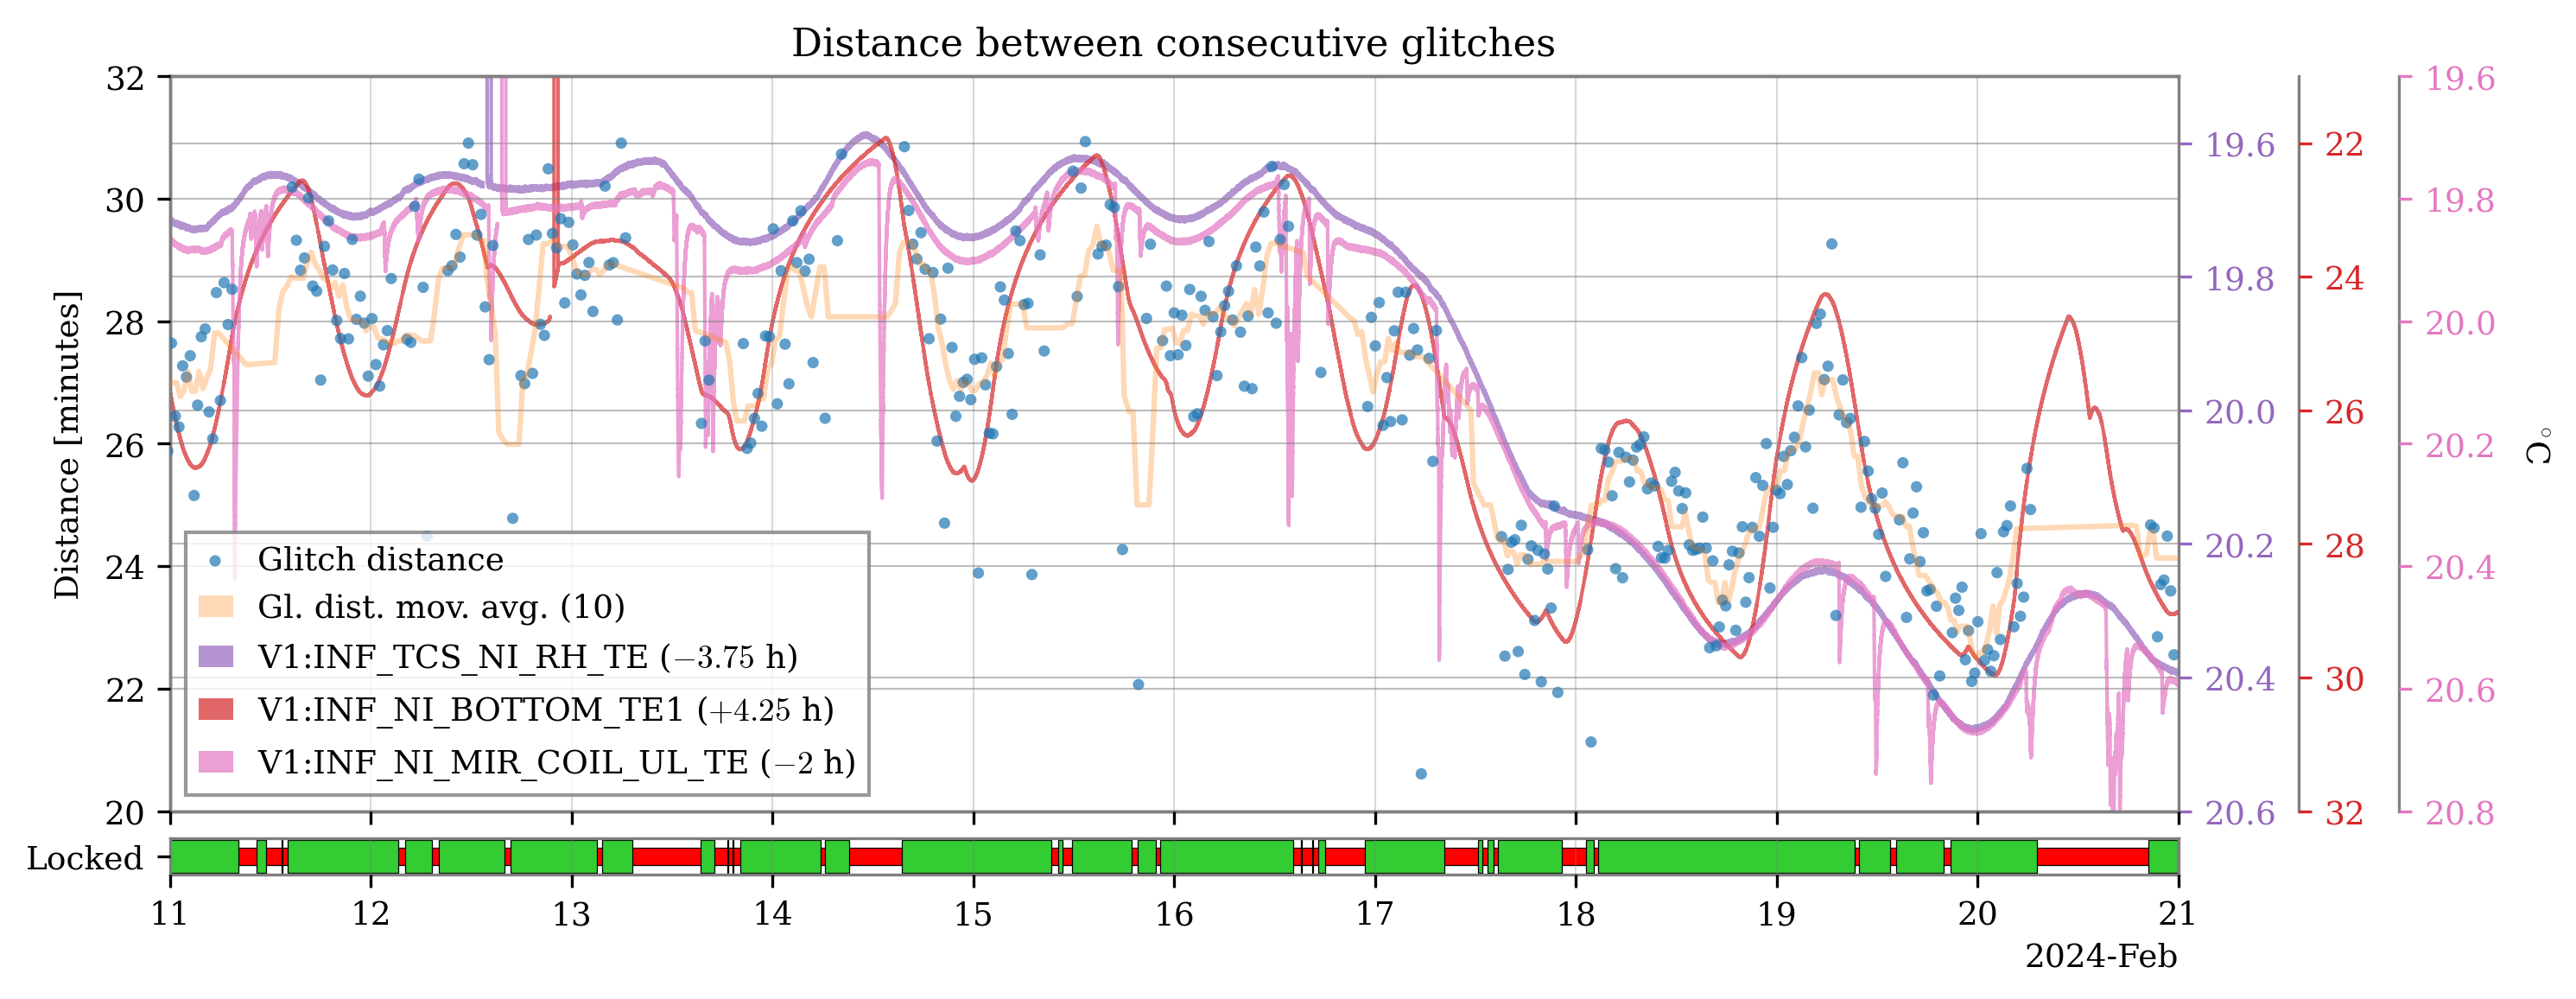
Figure 3: I tried to compensate for the delays by shifting the temperature time series. Just matching by eye the waves, it seems like the glitches follow the NI BOTTOM TE by 4h15, and anticipate the temperature variation in INF_NI_MIR_COIL_UL_TE by 2 hours, and INF_TCS_NI_RH_TE by 3h45.
Figure 4: the first figure with shifts applied. Indeed, with the 4h25 delay, the similarity of the glitches time series and V1:INF_NI_BOTTOM_TE1 is remarkable.
I tried a more analytic approach to estimate the delays finding the lags that minimize the cross-correlation function of the glitch distance with the other temperature time series. The delays found with this method are the following:
V1:INF_TCS_NI_RH_TE: +3:19:50 (the glitch rate changes before the temperature)
V1:INF_NI_BOTTOM_TE1: -4:01:20 (the glitch rate changes after the temperature)
V1:INF_NI_MIR_COIL_UL_TE: +0:48:50 (before)
