The activity of yesterday afternoon was dedicated to the measurement of the RIN of the single bounce beam.
ITF manually unlocked at 14h04 utc.
Gianmatteo set up the NI single bounce beam at 14h07.
We put the zero offsets (reference for single bounce) in the B5 QD2 error signals used for the drift control of SDB1.
I asked Gianmatteo to misalign PR TY further away by -30 urad in order to put the secondary beam out of the B1p camera.
Opening OMC shutter at 14h12.
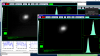
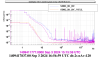
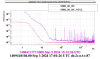
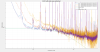
We start by taking reference on the SQZ cameras. first with nominal integration time Fig.1, then integration time multiplied by 10 (Fig.2).
Closing FI shutter from 14h23 utc: first tries +5000 steps (wrong direction), then -10000 steps. Add -20000, -20000, -20000. Total for closing: = -65000 steps
Mistuning waveplate to have 24 mW on B1s: +100, +1000, +1000 +2000 +2000 +2000 +2000 +2000 +2000 (Total = +14100 steps)
Start OMC scan to lockthe OMC at 14h45 utc. OMC locked stably at 14h50 utc. The power on B1_PD3 is 3.9 uW. We expect about 18.7 mW on B1.
We increase the B1 photodiodes power safety threshold (triggering the fast shutter) from 6.0 to 10.0 mW at 15h03 utc.
We Perform an extra step on FI waveplate to lower a bit more the power on B1s : +200 steps with FI waveplate at 15h07.
Open B1 photodiodes at 15h10 utc: we have about 16 mW on B1 beam.
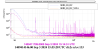
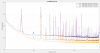
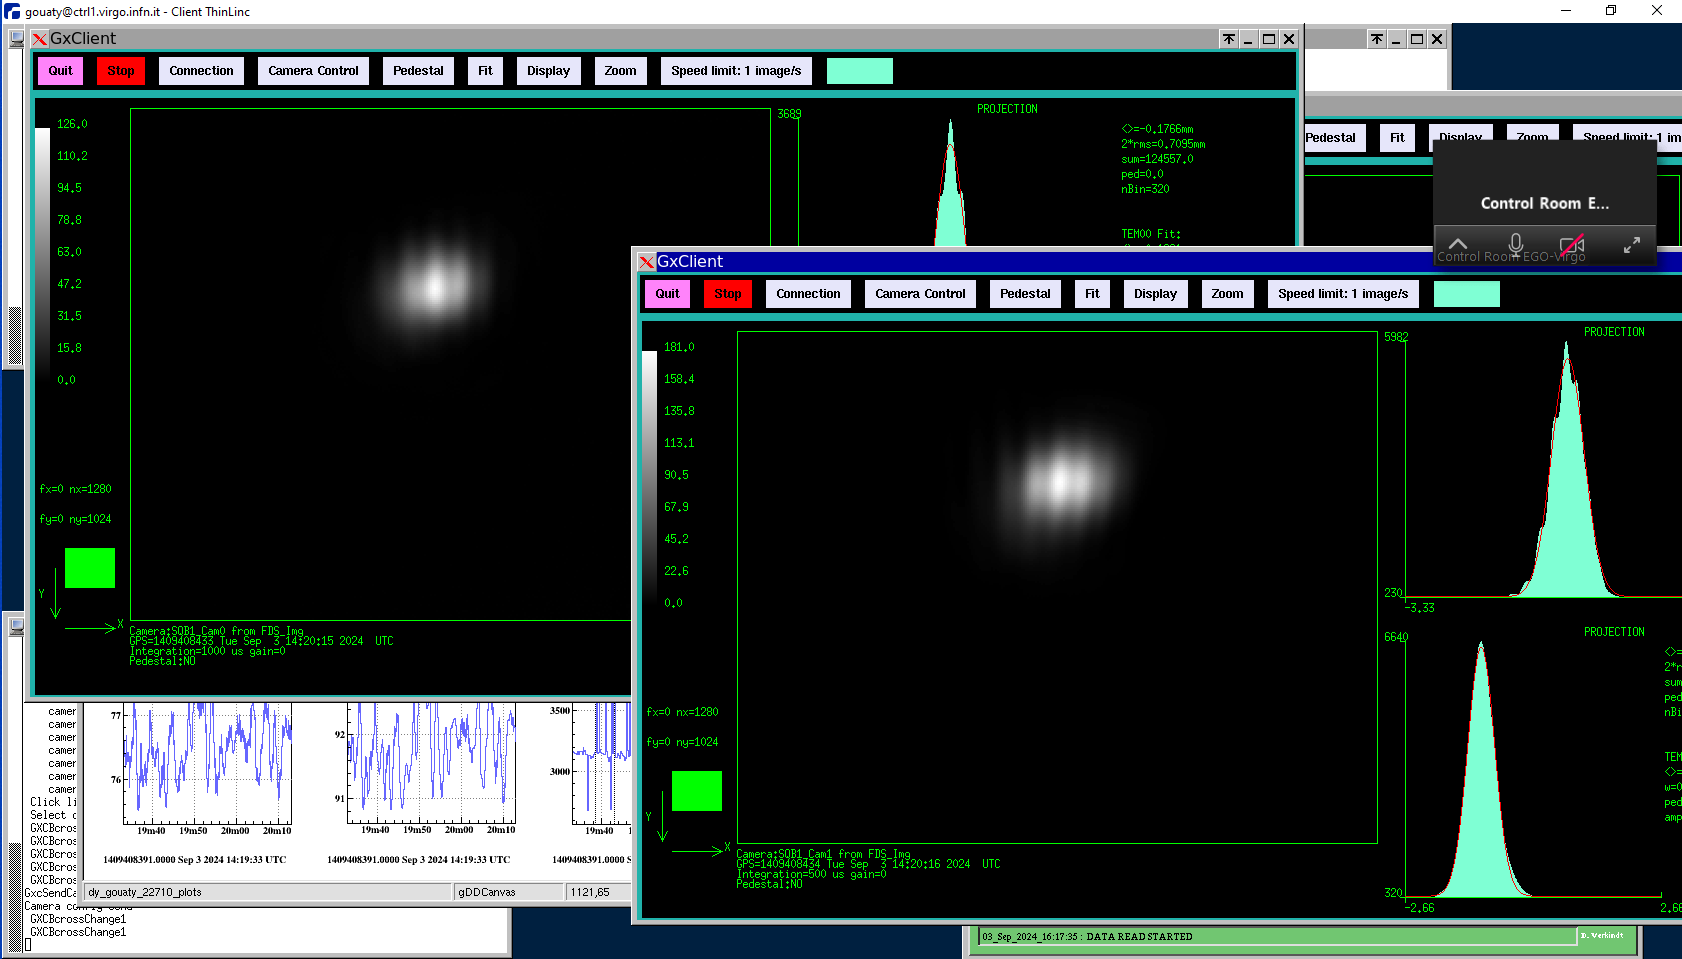
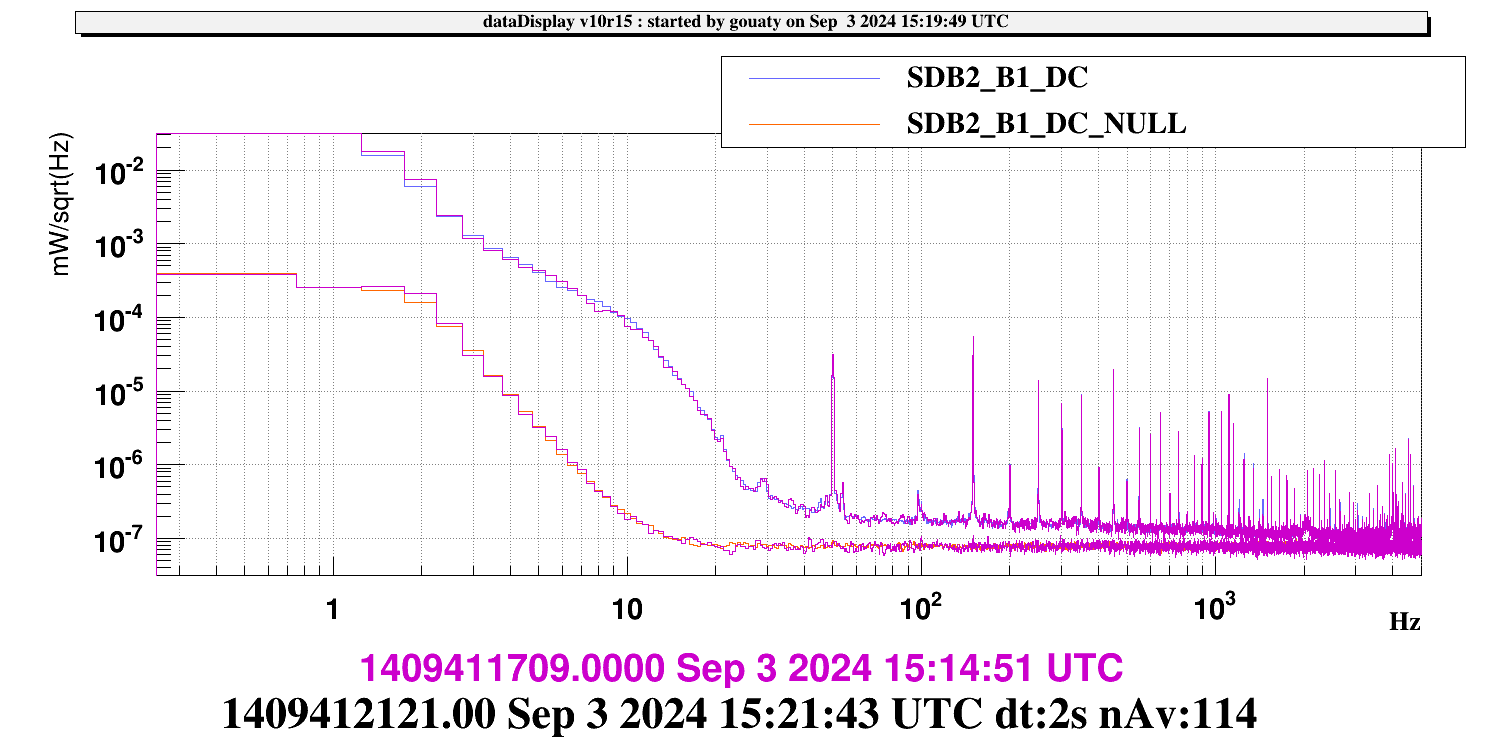
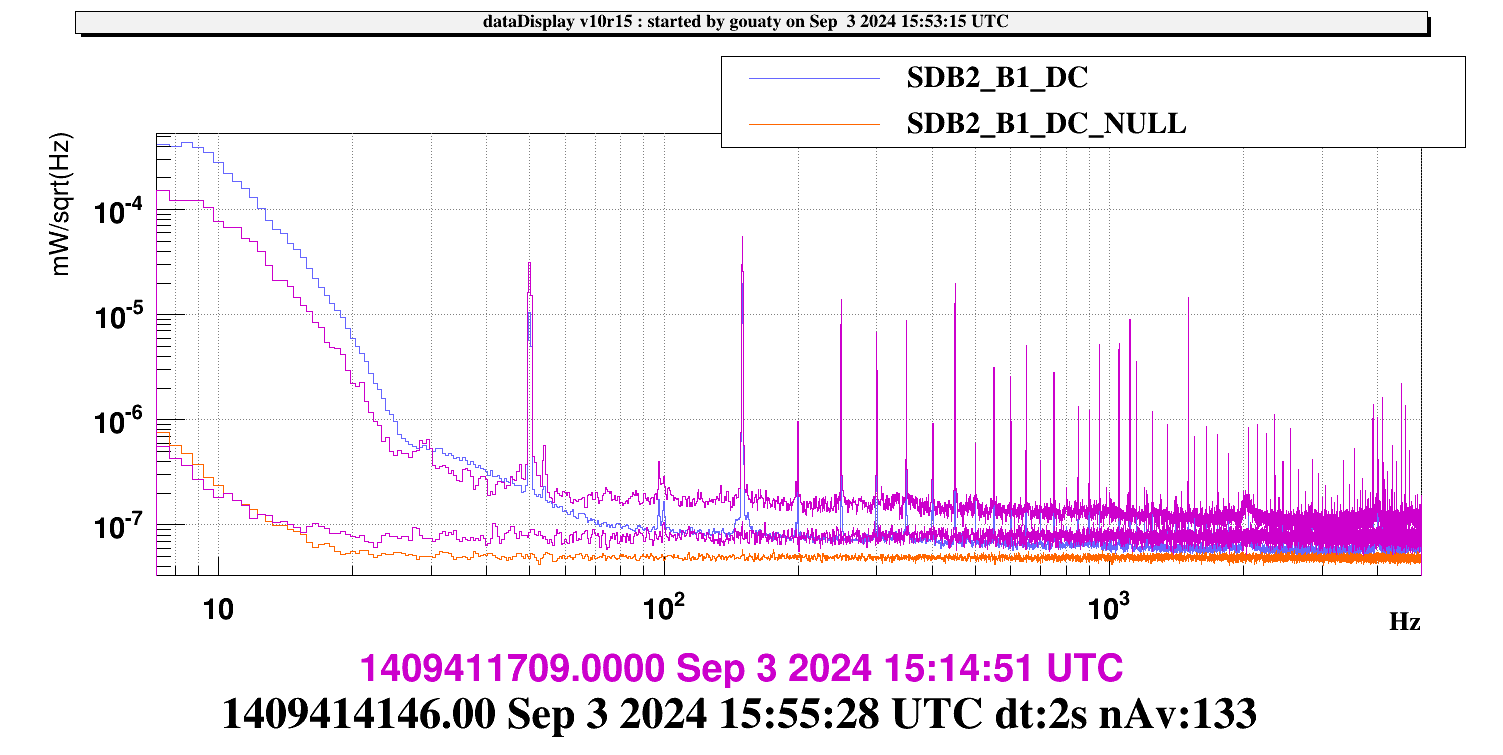
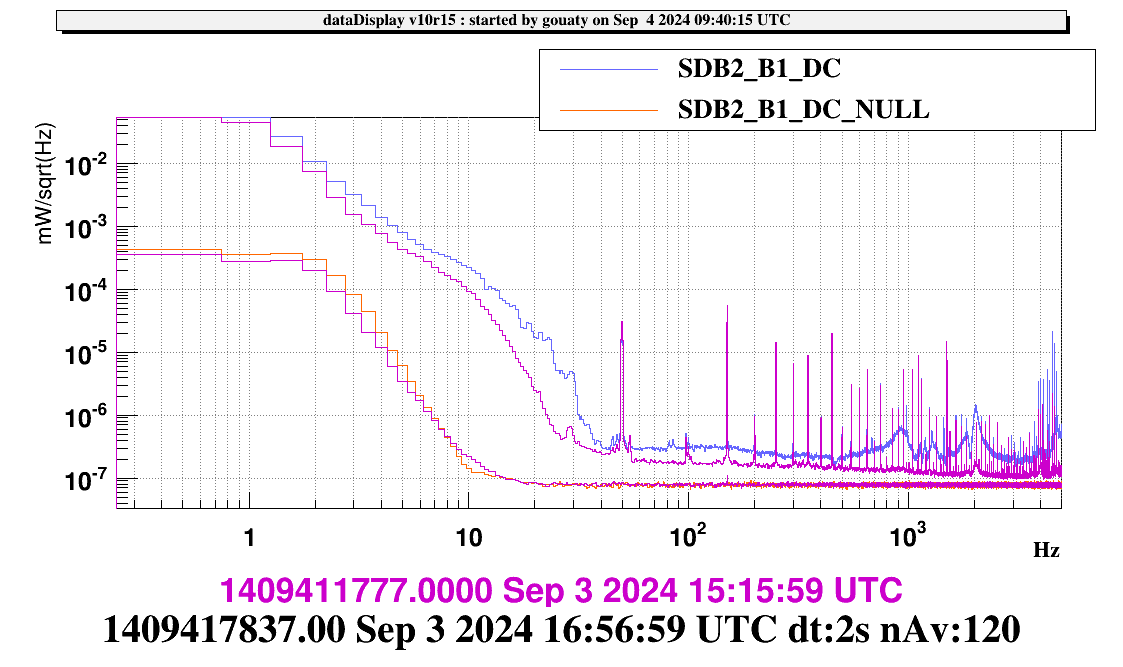
Collecting data from 15h13 utc to 15h16 utc. The Fig.3 shows the obtained noise spectrum on B1_DC, compared to the null stream. The noise floor is clearly higher than the shot noise (by a factor ~2 at 100 Hz).
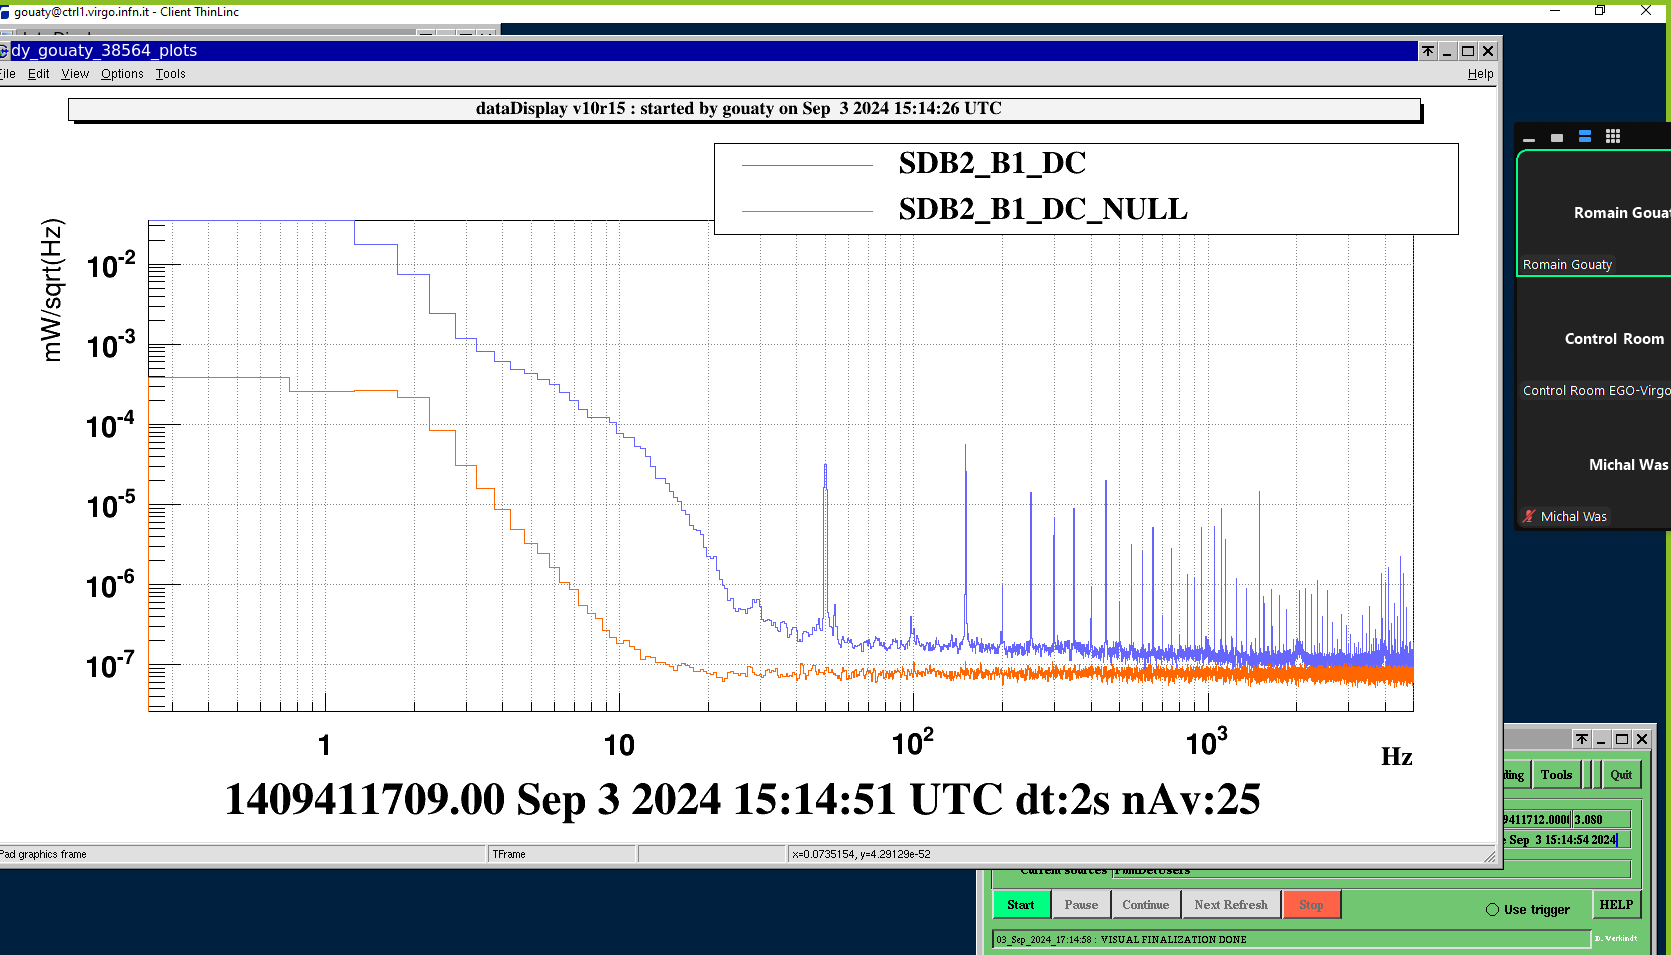
Reducing 8 MHz modulation depth from 0 dBm to -20 dBm at 15h19m20 utc
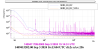
Collecting data from 15h20 utc (5 min). On Fig.4 we have superimposed the noise spectrum obtained after reducing the 8MHz modulation depth to the previous noise spectrum. We can see that removing the 8MHz side band has no impact on the noise.
We tried to reduce the 56 MHz modulation depth by -7dB at 15h26m28, then we restored my mistake the initial modulation depth at 15h26m51. We reduce it again by -7dB at 15h27m36 UTC, and then finally by -16dB at 15h28m32 utc. Collecting data in this configuration from 15h29 utc (4 min). The resulting noise spectrum is shown on Fig.5. The noise has increased with the reduced 56 MHz modulation depth. One possible interpretation is that the RAMS servo is not performing well when we reduce the 56 MHz modulation depth and we could now be dominated by 56 MHz RIN.
We increase back the 56 MHz modulation depth by 7dB at 15h33m52 UTC, and then by 16dB at 15h34m16, reaching again the standard modulation depth.
Recollecting data from 15h35 utc (5 min). We have checked that the noise spectrum is back to the initial level.
We lower the power on B1_DC with additional steps on the FI waveplate: +200+200+200+200+200+200+200+200+200+200+200+200+200+200+100+50+50 (total +3000 steps) > we obtain around 6.2 mW on B1_DC, which is similar to the power we have in Low Noise 3.
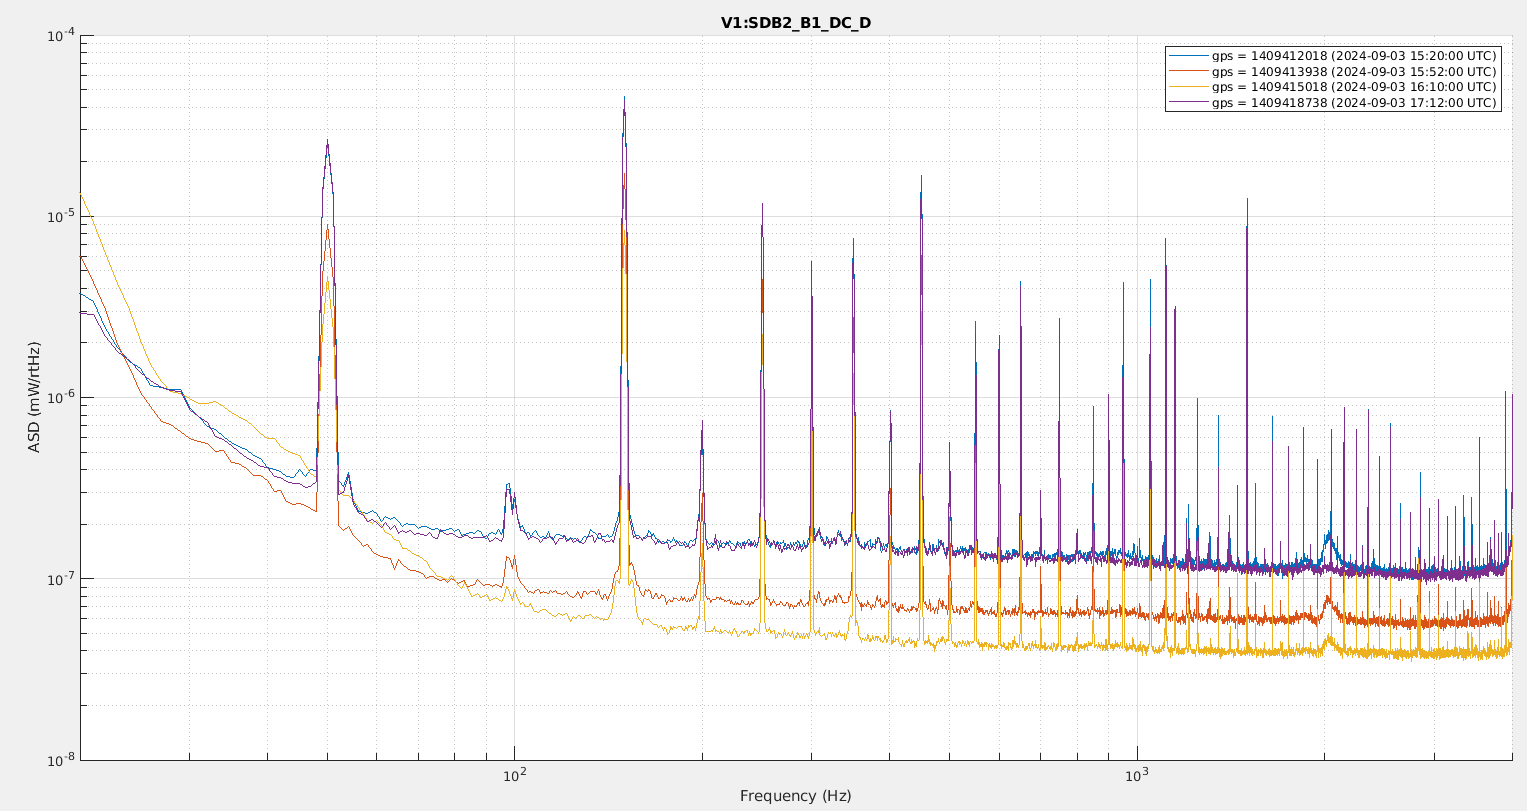
Collecting data from 15h51 utc (9 min). Fig.6 shows that the noise floor is lower with 6.2 mW, but there is extra noise at low frequency which starts to spoil the measurement at 100 Hz.
We lower further the power on B1_DC with additional steps on FI waveplate: +100 +100 +100 +100 +100 +100 +100 +100 +100 +100 +100 +100 +100 +50 +50 (total +1400 steps) > we have about 3.05 mW on B1_DC.
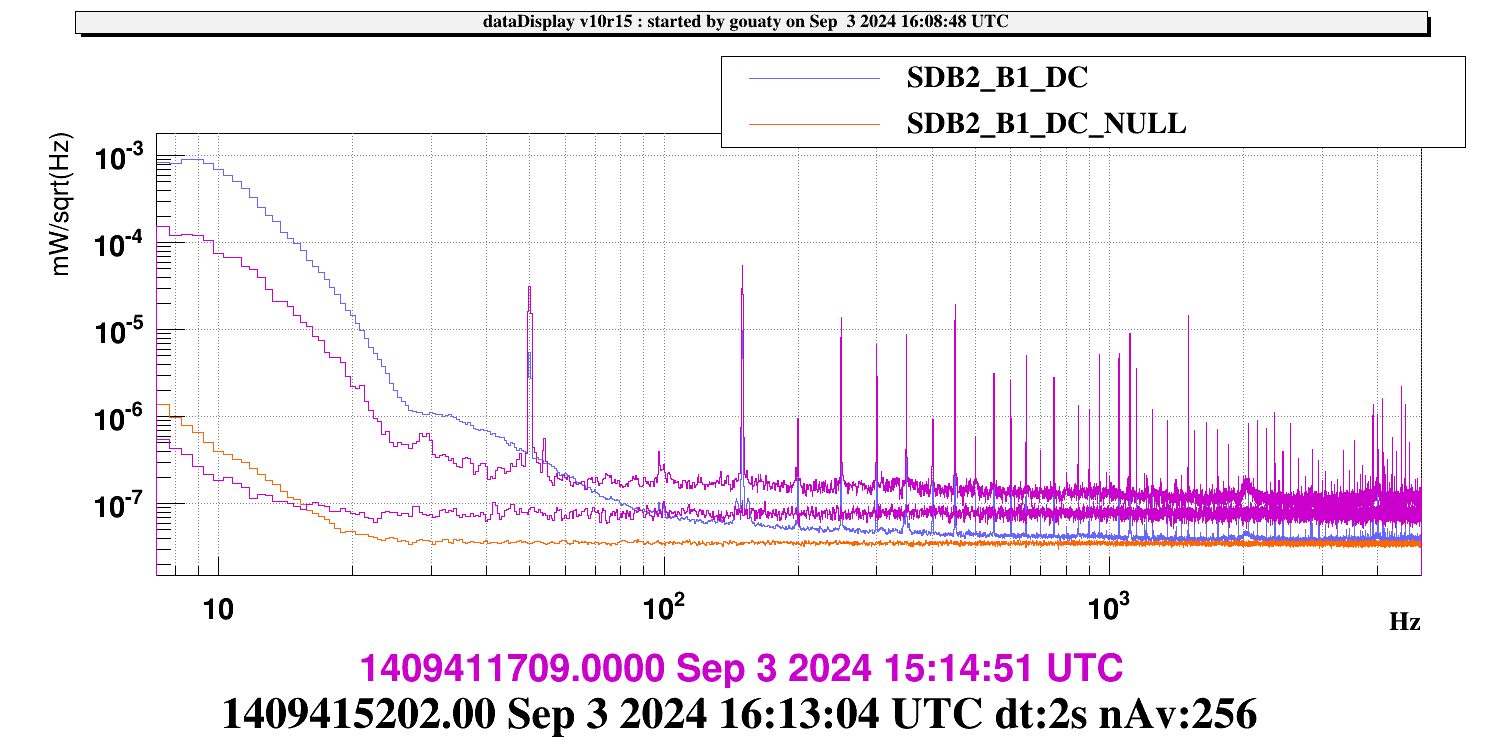
Collecting data from 16h09 utc (6 min). Result shown on Fig.7. The noise floor above 1 KHz is almost reaching the shot noise level (null stream). However we have a larger excess noise at low frequency.
Increasing back the power on B1_DC to ~16 mW: -200 -200 -200 -200 -200 -200 -300 -300 -300 -300 -300 -300 -300 -300 -300 -300 -100 -100 (total -4500 steps) > reaching about 16.2 mW
We then test the effect of adding an offset in the OMC error signal:
offset = 10.0e-5 V at 16h27 utc.
offset = 30.0e-5 V at 16h28m45. Collecting data for 4 min. See Fig. 8. A low frequency noise is rising up with the offset.
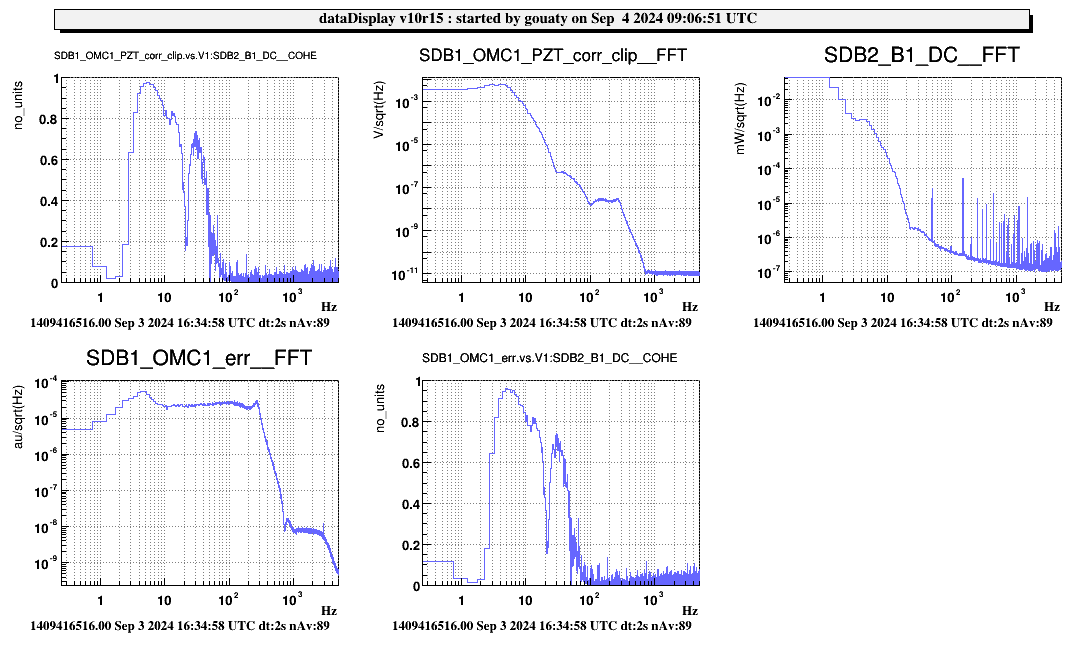
offset = 60.0e-5 V at 16h33m15. Collecting data for 3 min. See Fig. 9. The noise is rising up further. At low frequency (up to 50 or 60 Hz), the noise is highly coherent with the OMC error signal and correction signal (Fig.10). Therefore this part of the noise can be attributed to the OMC length control noise. Around 100 Hz and above, it is liketly that the limiting noise is the thermorefractive noise of the OMC (whose coupling scales proportionally to the offset).
Zero the offset at 16h36m55 utc.
Calibration of the OMC: we inject a calibration line at 119 Hz through the OMC PZT, with starting amplitude 0.5e-2 V, starting from 1409416857.
Line increased to 1.0e-2 at 1409417062 to improve the SNR on the OMC error signal - Injection stopped at 1409417387.
We test the effect of changing the OMC PZT modulation depth:
Increase PZT modulation depth from 0.001V to 0.03V at 16h53m50 utc. Collecting data from 16h54 (5 min). See Fig.11. The high modulation lines are introducing a large excess noise.
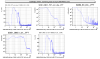
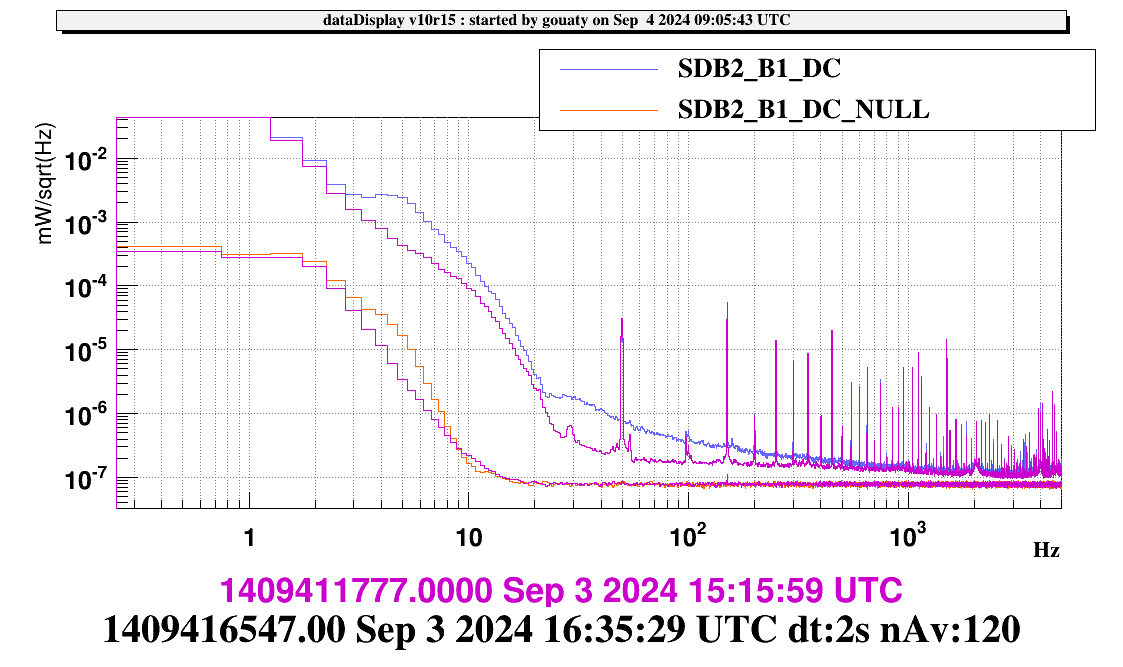
Reducing PZT modulation depth to 0.01V at 16h59m20 utc (4 min). We recover the noise floor at 100 Hz but we are still limited by excited mechanical resonances around 1 kHz and 2 kHz (Fig.12).
Reducing PZT modulation depth to 0.001V at 17h03m28 utc (5 min). With the low modulation line, the noise floor at high frequency is cleaned but we are now dominated by the OMC length control noise (due to the noisy error signal) at low frequency (Fig.13).
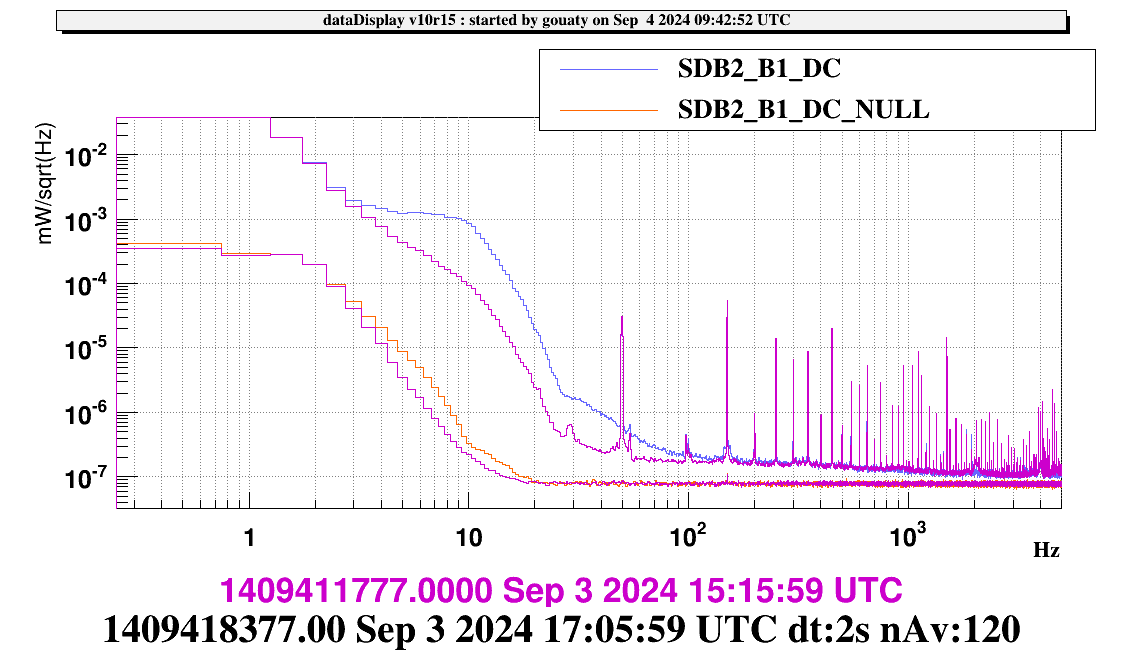
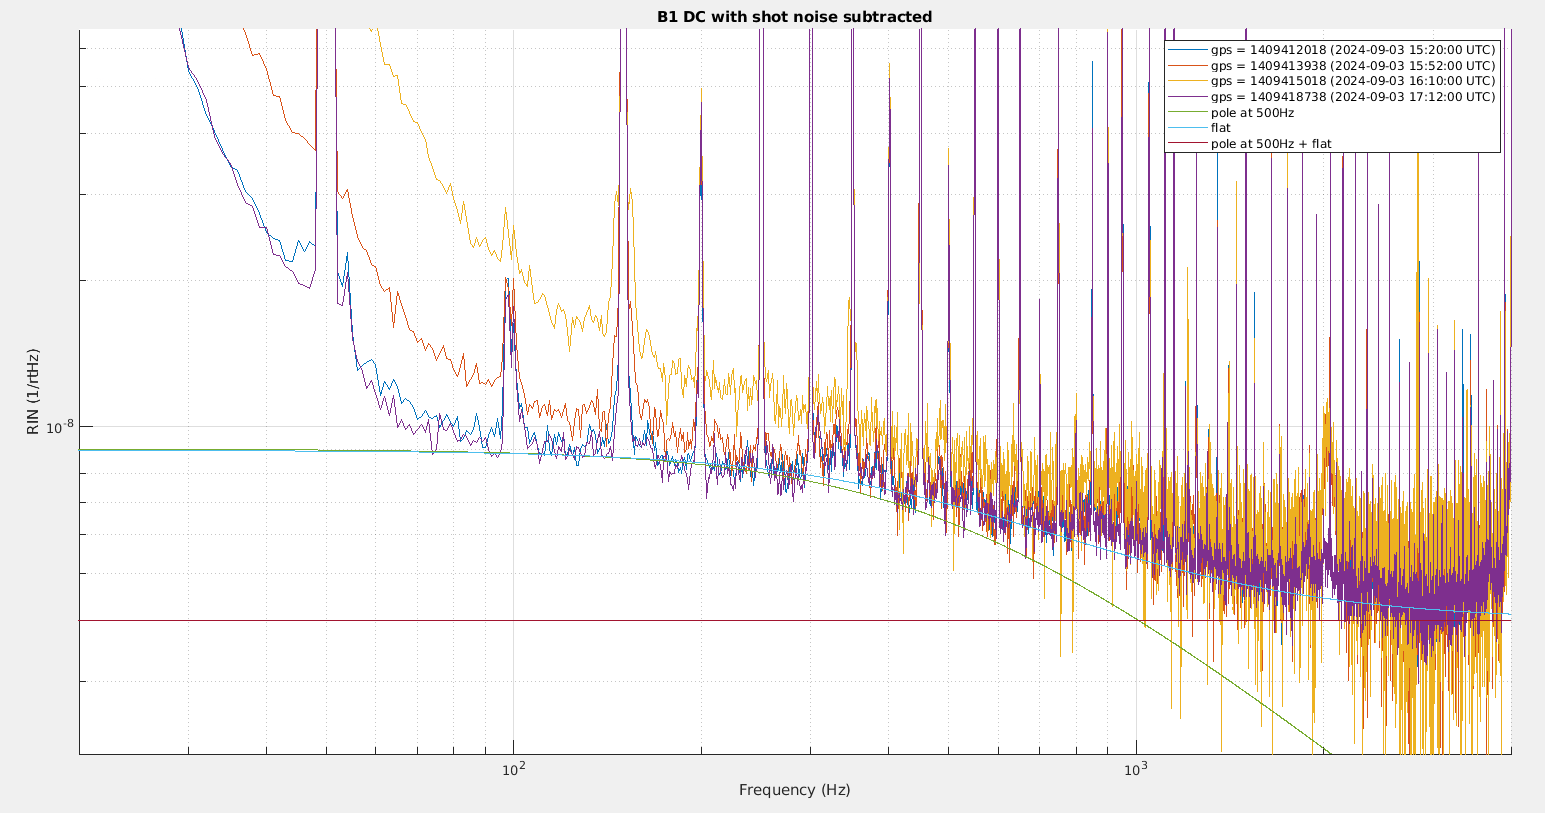
After realizing that the OMC is still controlled with the B1_PD3 signal (which has little power), we decide to change the OMC error signal (on B1_PD2) at 17h09m15 utc (while keeping the low modulation depth 0.001V for the PZT). This makes the lock less noisy. Collecting data from 17h11 utc (6 min). This is actually the best data to be used for the RIN measurement (Fig.14).
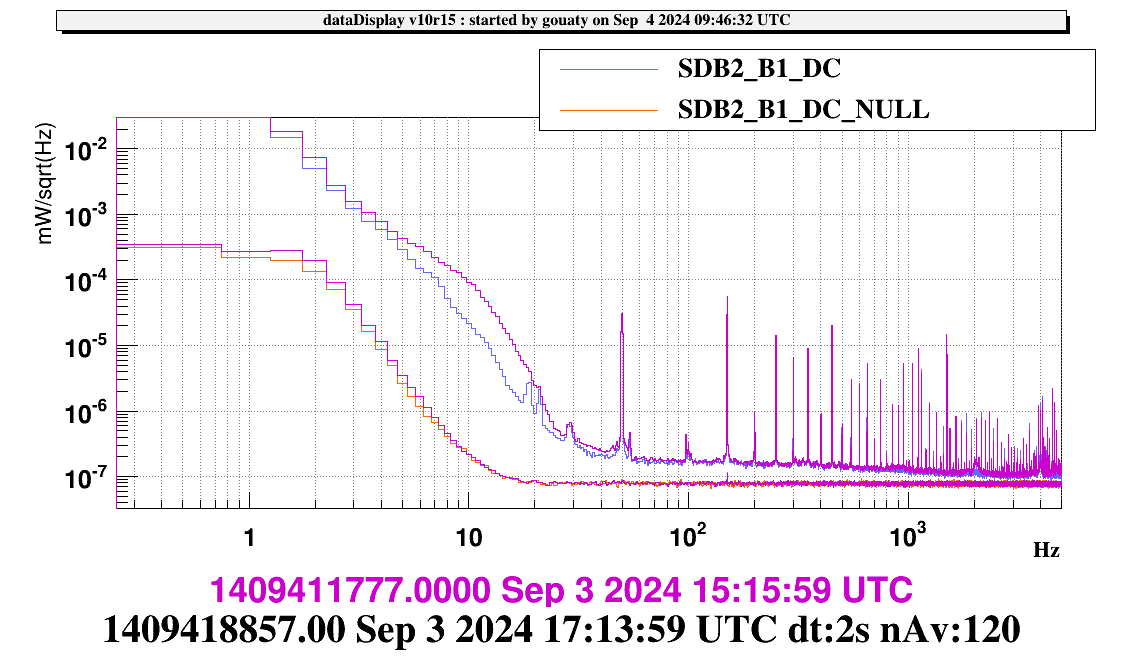
Try to add an OMC offset of 60e-5 V at 17h18m00 utc (5min): these data seems to provide a nice measurement of the OMC thermo refractive noise (Fig.15), to be analyzed later. Offset removed at 17h23m20 utc.
Calibration of the OMC: injecting line at 119 Hz with amplitude 0.25e-2 starting from 1409419460 . Stopping line at 1409419791. Calibration data will be analyzed later.
Close B1 photodiodes. restore safety threshold at 6 mW at 17h34m33.
Act on FI waveplate to increase back the power on B1p: -4000 -2000 -2000 -2000 -2000 -2000 -2000 -1000 +2000 (total -15000 steps) > reaching a plateau on B1s/B1p. Collecting data from 17h41m50 (5 min).
Increase back 8 MHz modulation depth to 0dB at 17h48 utc.
Closing OMC shutter at 17h51 utc.
Reopening FI shutter: +50000 steps -10000 steps = +40000 steps
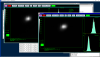
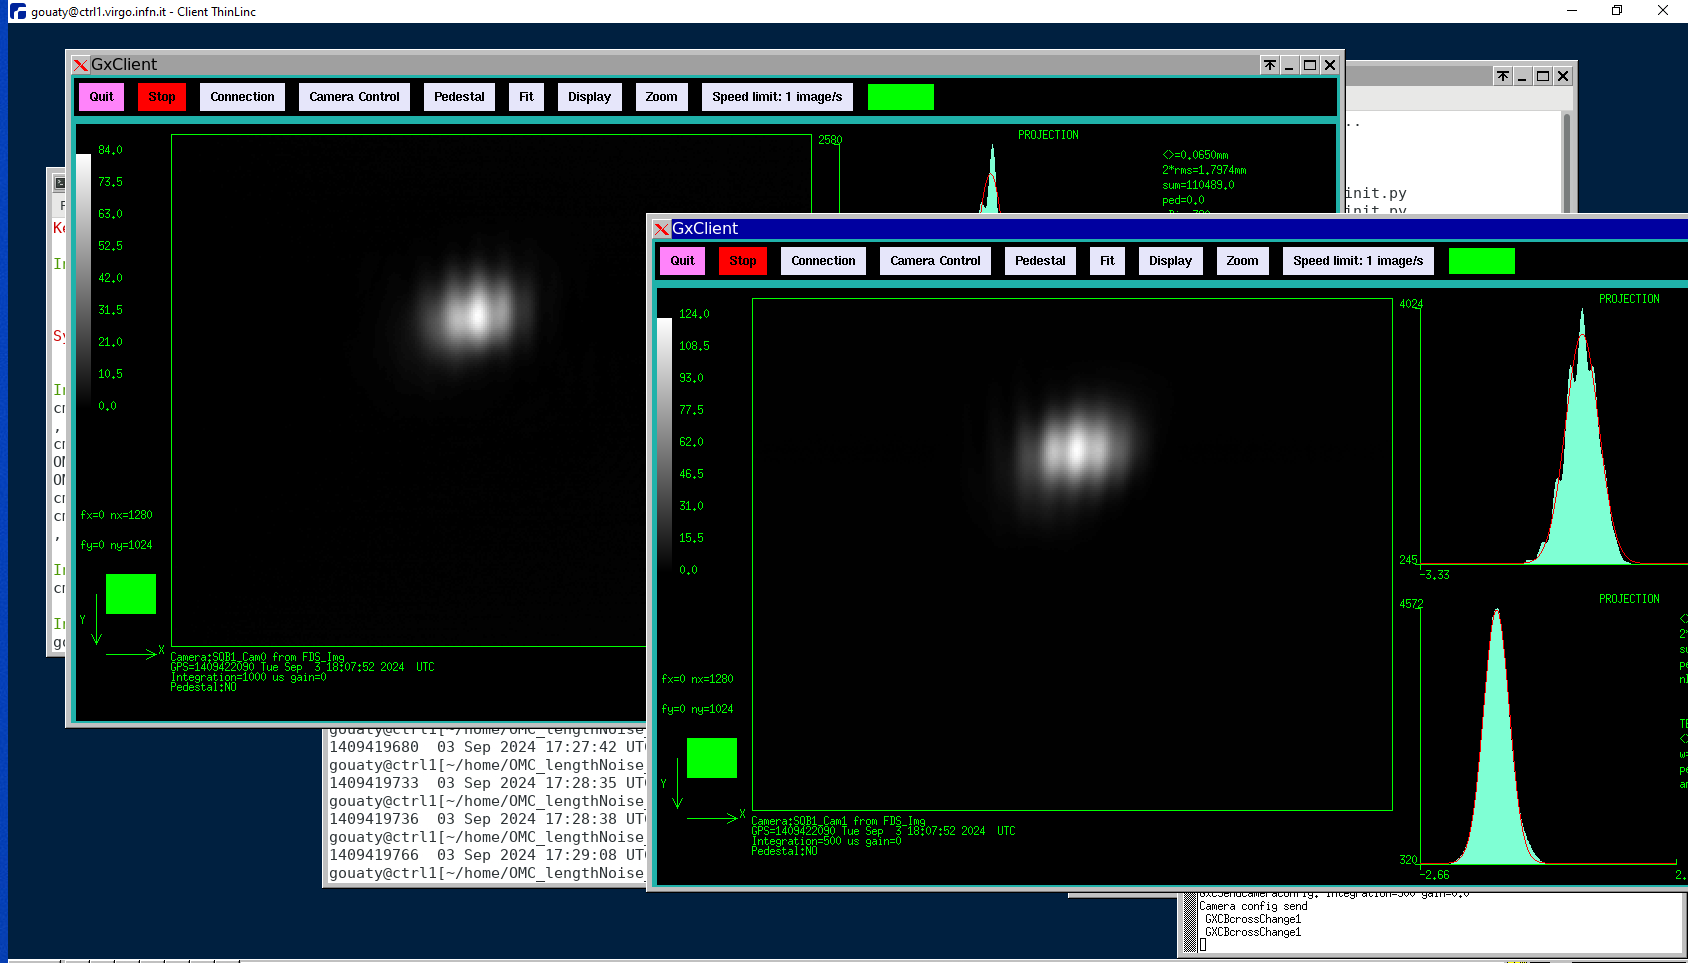
Adjusting FI waveplate with small steps to minimize power on the SQZ camera: We concluded this tuning at 18h09 utc. Fig.16 shows the images on the SQB1 cameras, with same integration time as the one used for Fig.2. From the color bars we can see that the residual power is actually smaller than the one we had before mistuning the waveplate. However, when the ITF was relocked in Low Noise 3 a few hours later, we observed excess scattered light at the SQZ dither line frequencies, which indicates that the tuning performed in single bounce was not efficient.
Restoring B5 QD2 offsets for dark fringe operations at 18h10 utc. ITF put back in DOWN under request from the operator to allow the on-going activities.
Since we have noticed that with the lowered OMC PZT modulation the little bump around 2 kHz is no longer present, we have decided to keep this modulation depth for the next lock in Low Noise 3. The OMC_LOCK ini file has been updated accordingly (low noise modulation amplitude is now 1mV instead of 3 mV).


