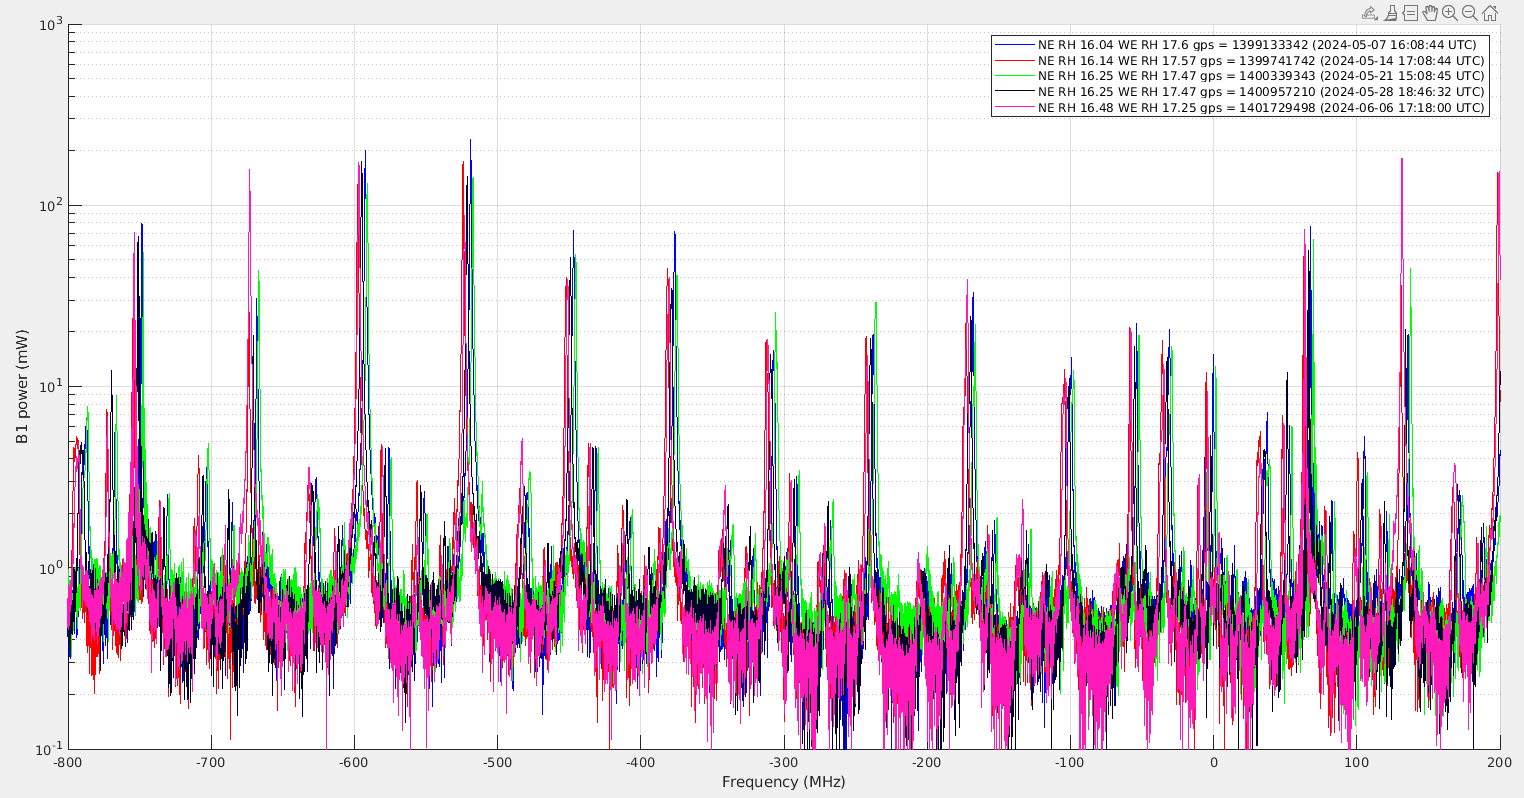
There have been 4 scans do in CARM NULL 1F for the different setting of EM RH.
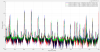
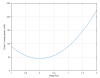
Figure 1 shows the 4 sets of OMC FSR scans superposed, the calibration of time into MHz is not perfect as the scans are not completely linear, but it can be clearly seen that a peak belonging to a given mode a grouped together and can be visually compared between the 4 scans. The TEM00 mode is at 0MHz and at -830MHz. And the higher order modes should be at multiples of 72MHz starting from the TEM00 going in the positive direction. For example the order 2 modes should be at around 145MHz and 690MHz. The order 1 mode is easy to recognize as it is a mory noisy peak due to fast fluctuations of alignment that modulates the amplitude of that peak while scanning through it.
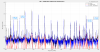
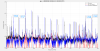
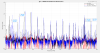
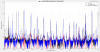
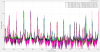
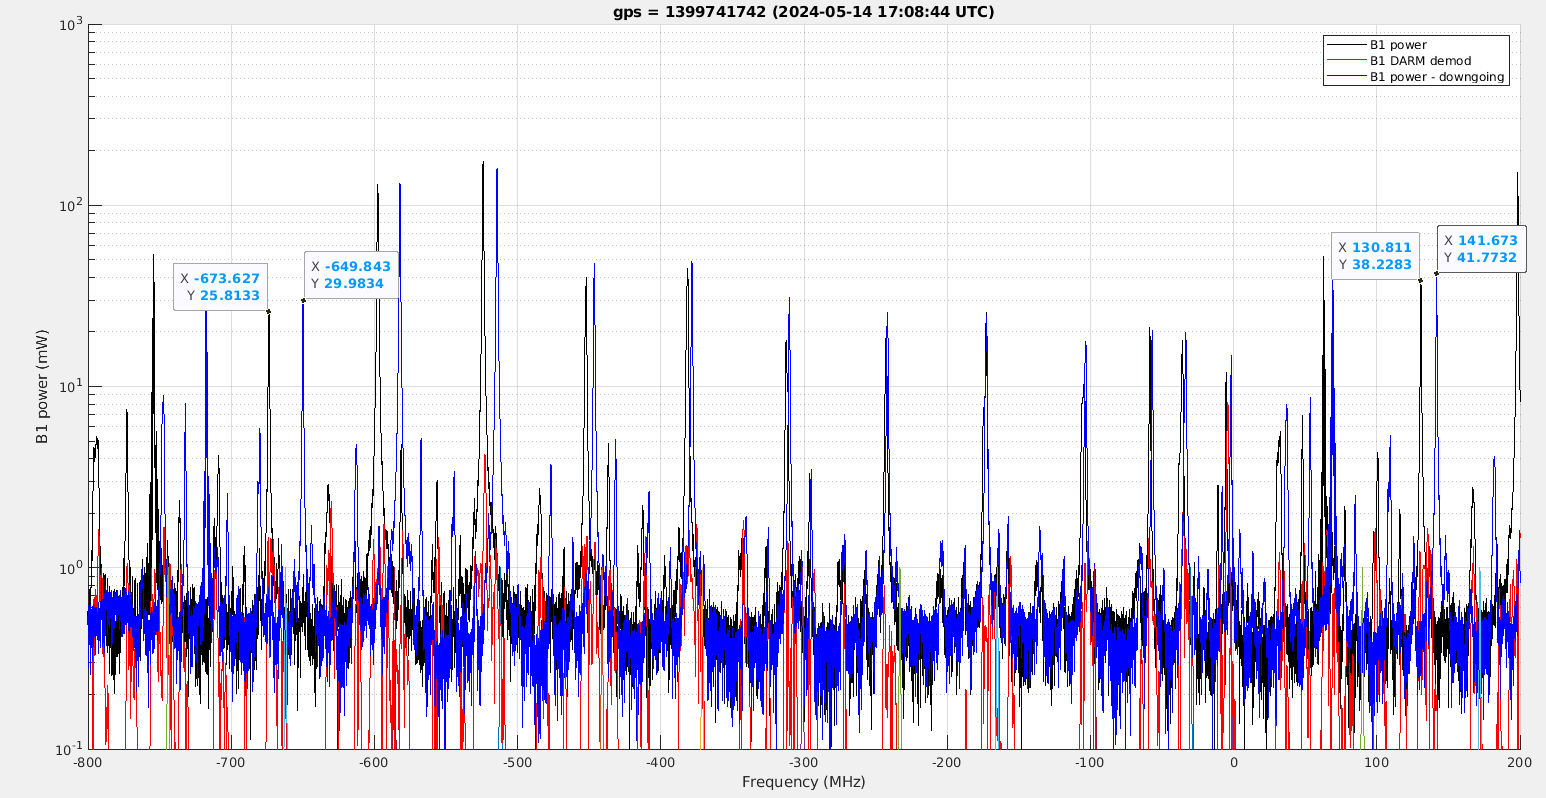
Figure 2-4 show each scan individually, with both the up-going and the down going scan super-imposed. The order 2 mode appears four times in those scans, and the order 2 peaks are higlighted by markers on the figures.
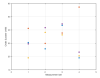
The amplitude of the peaks for each set of measurement are below, with one row per measurement.
30.500 41.200 19.000 29.500
25.800 29.900 38.200 41.700
43.500 37.700 36.300 44.550
19.000 57.200 20.500 23.300
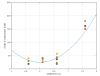
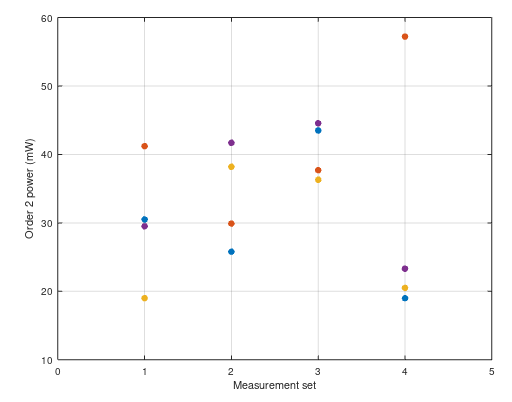
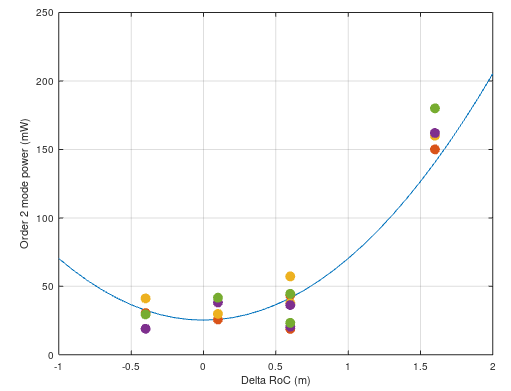
Figure 6 shows this data in a graphical form. I do not see any pattern appearing with the order 2 mode becoming higher or lower, there is a large scatter between the points for each measurement.
If I try to compute analytically the expected changes. A difference of 2m on the RoC of the EM would change the waist in the arm by 0.5% in value, and that would correspond to a change of order 2 mode power on the dark port of 7mW (assuming 90kW in the arms, which correspond to 320W in each of the short arms of the Michelson). So it reasonable that we have not been able to see any effect given the large scatter in the measurements.
/users/mwas/OMC/OMC_scan_demod_20240507/OMC_SCAN.m
