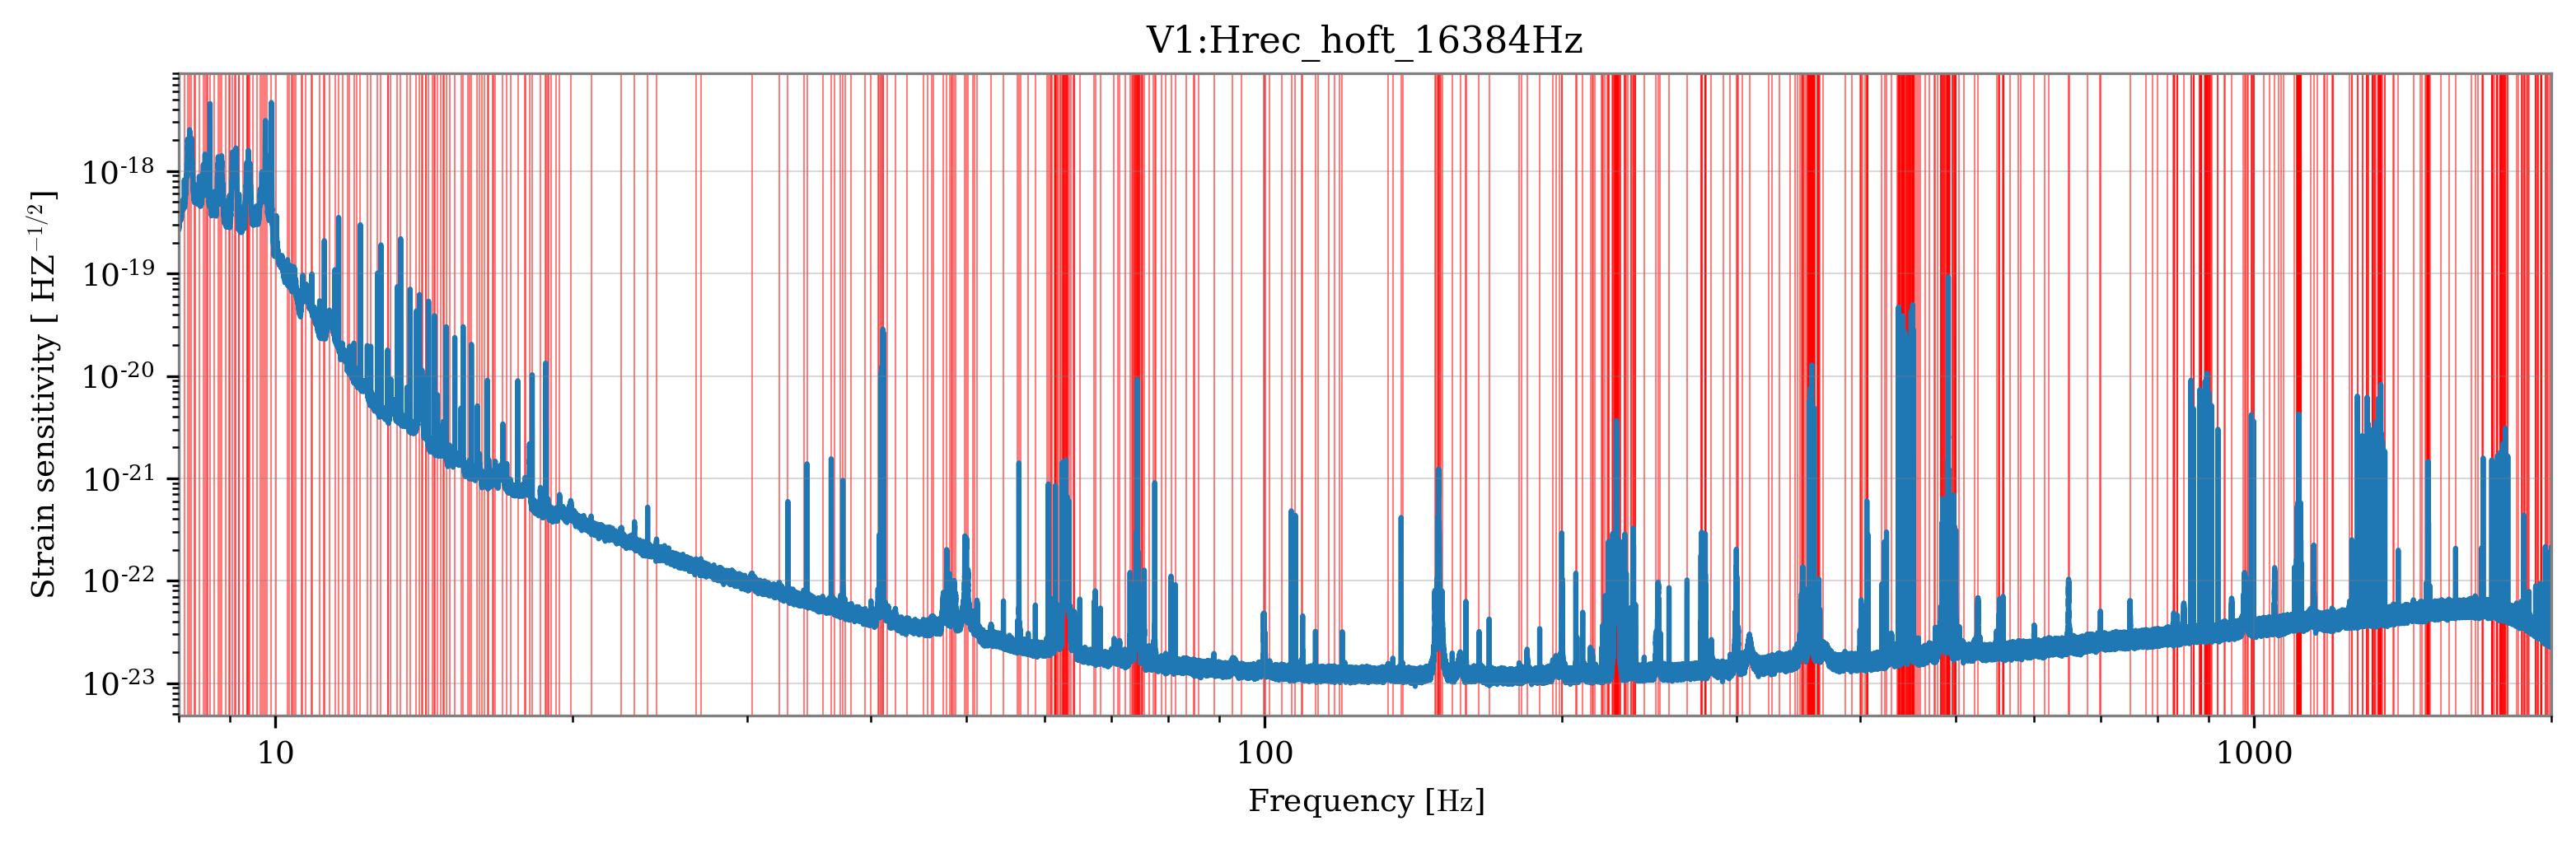
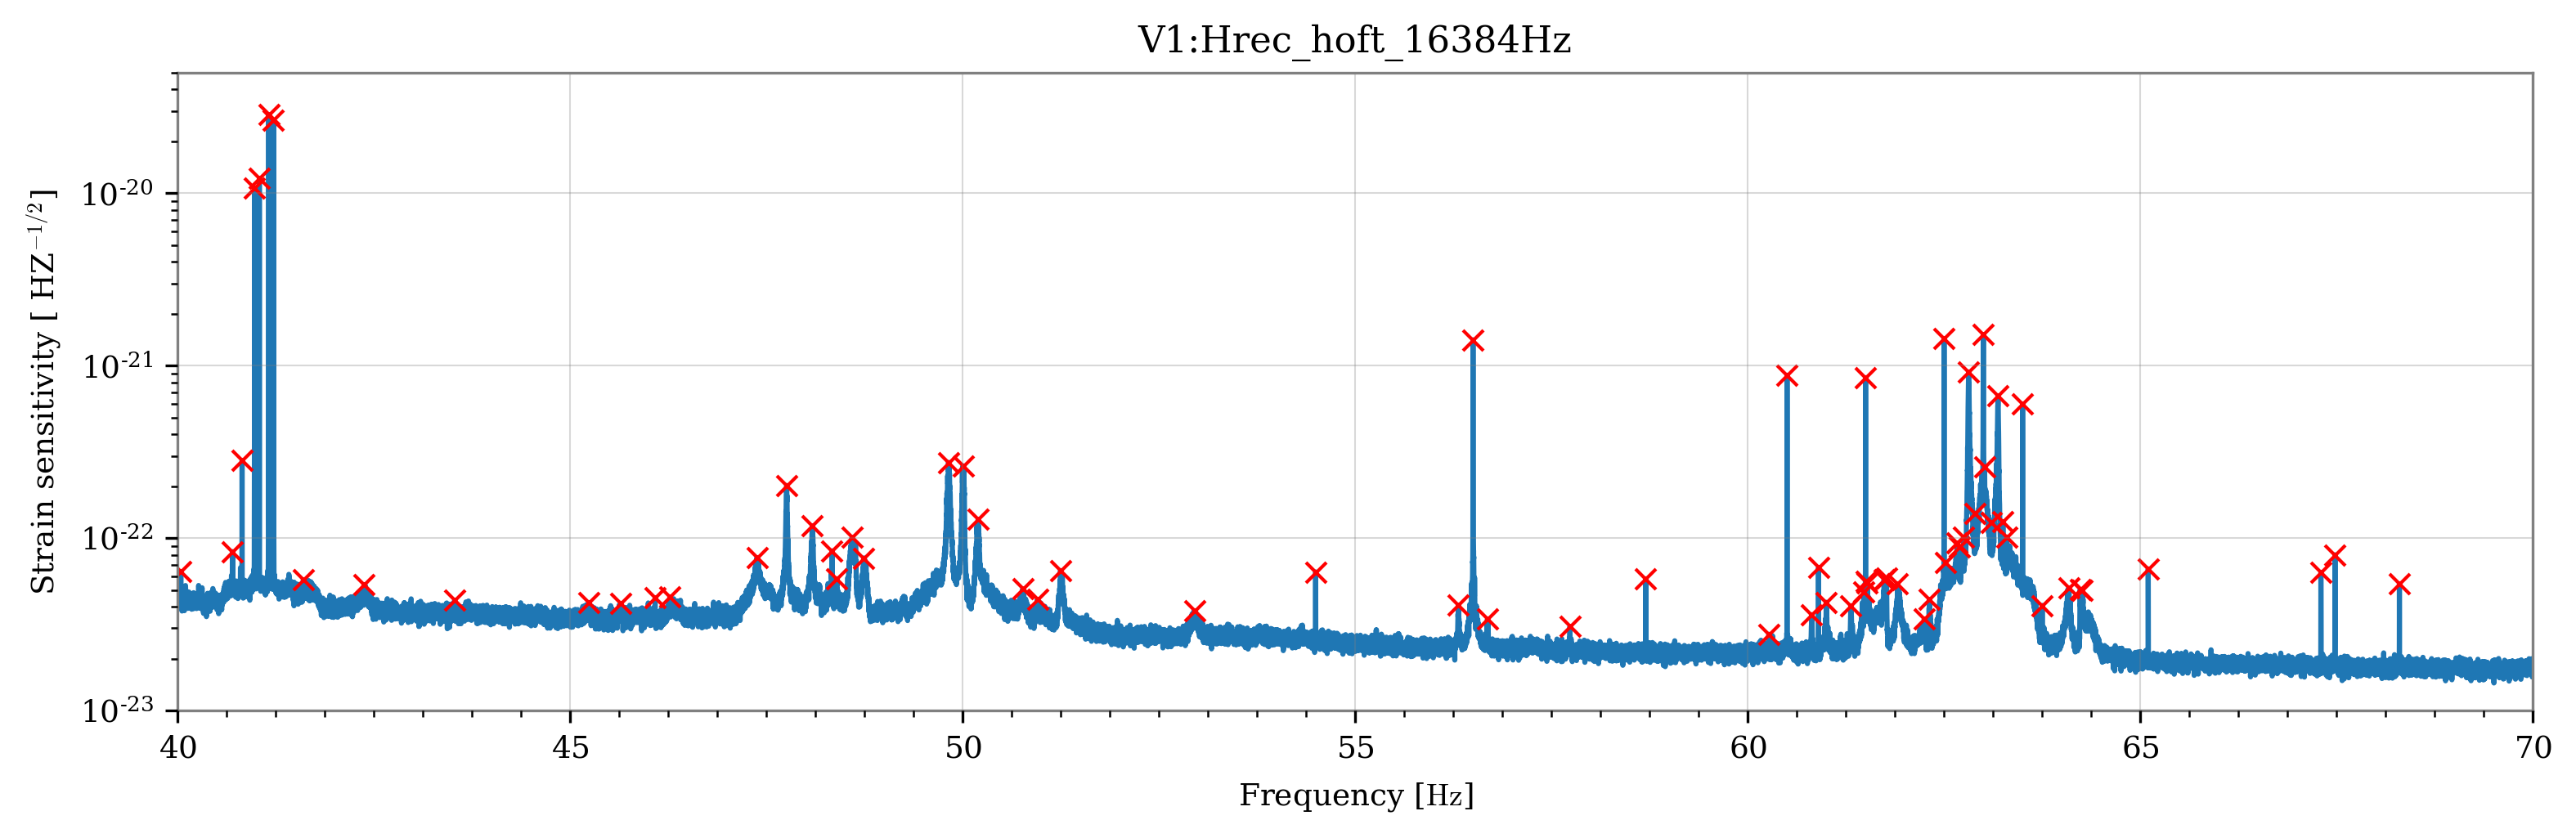
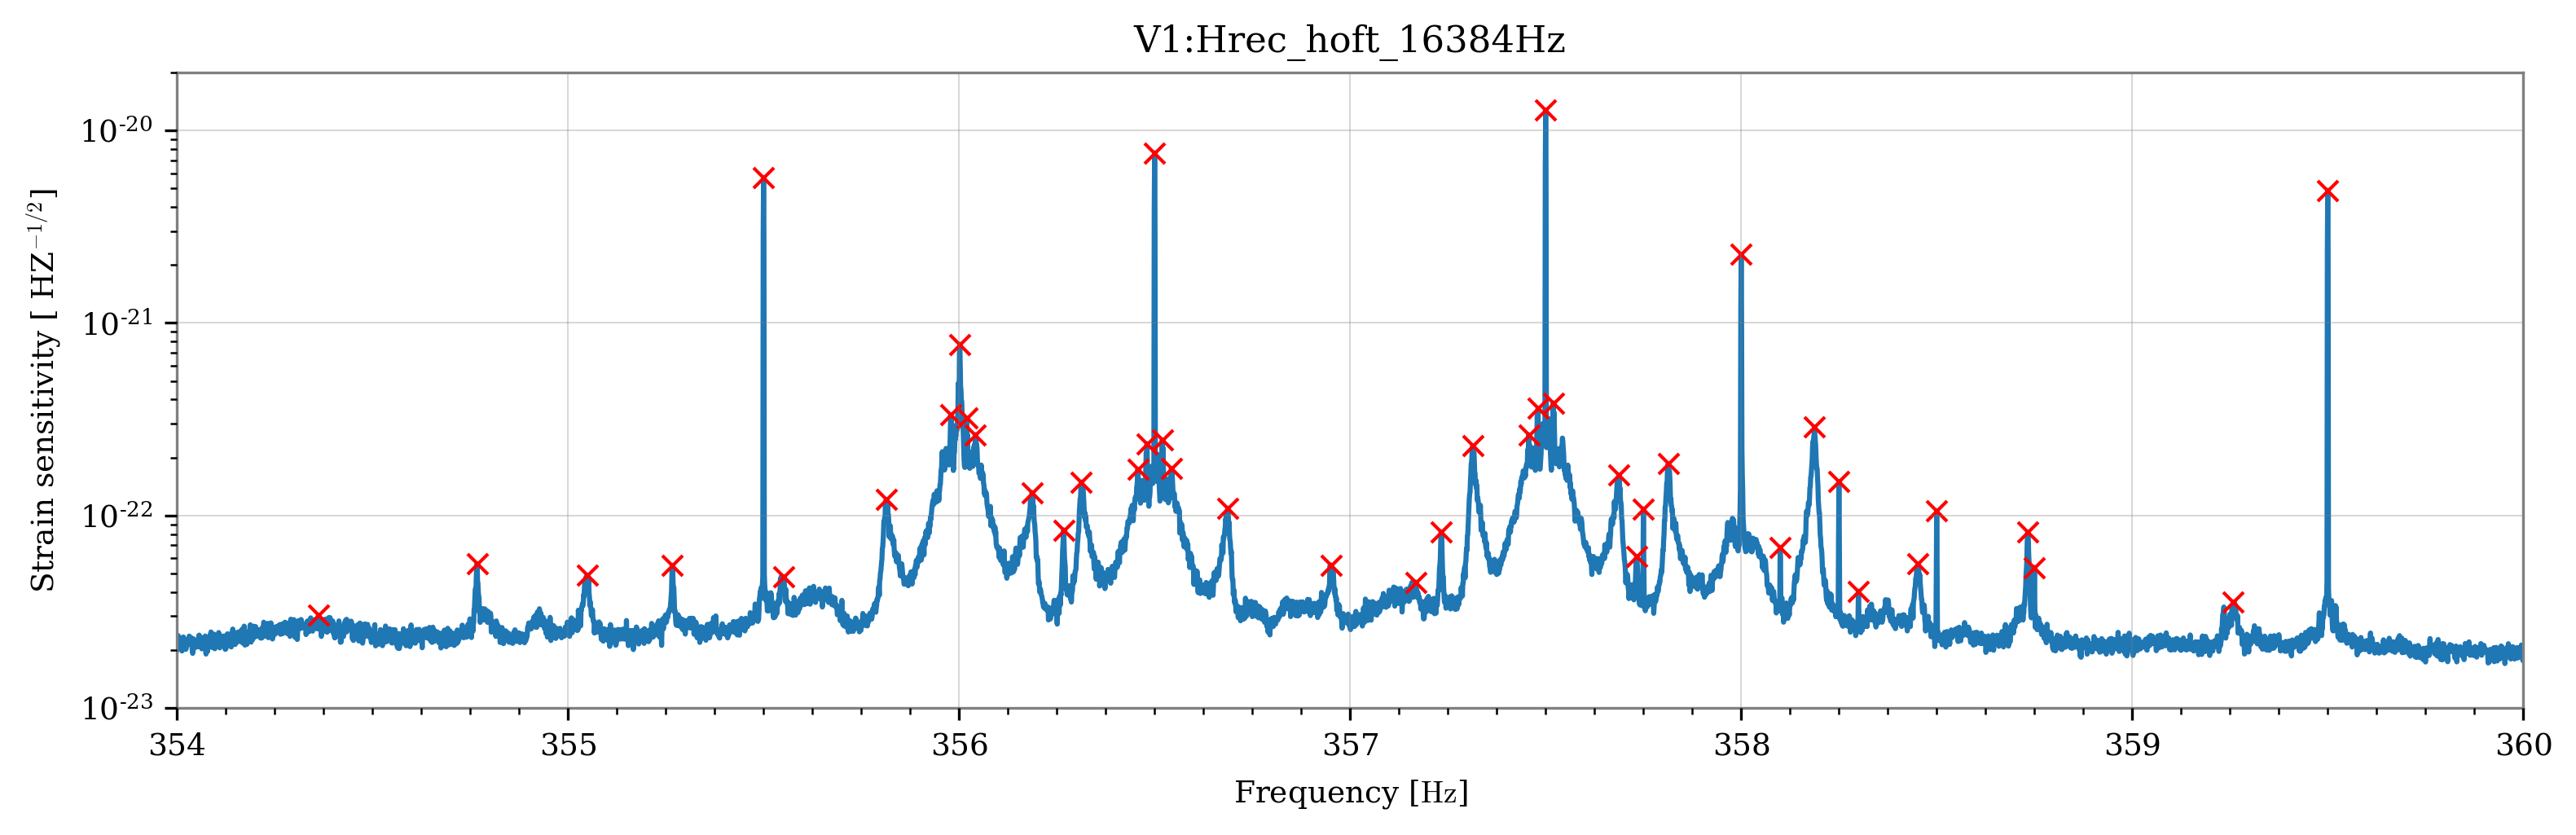
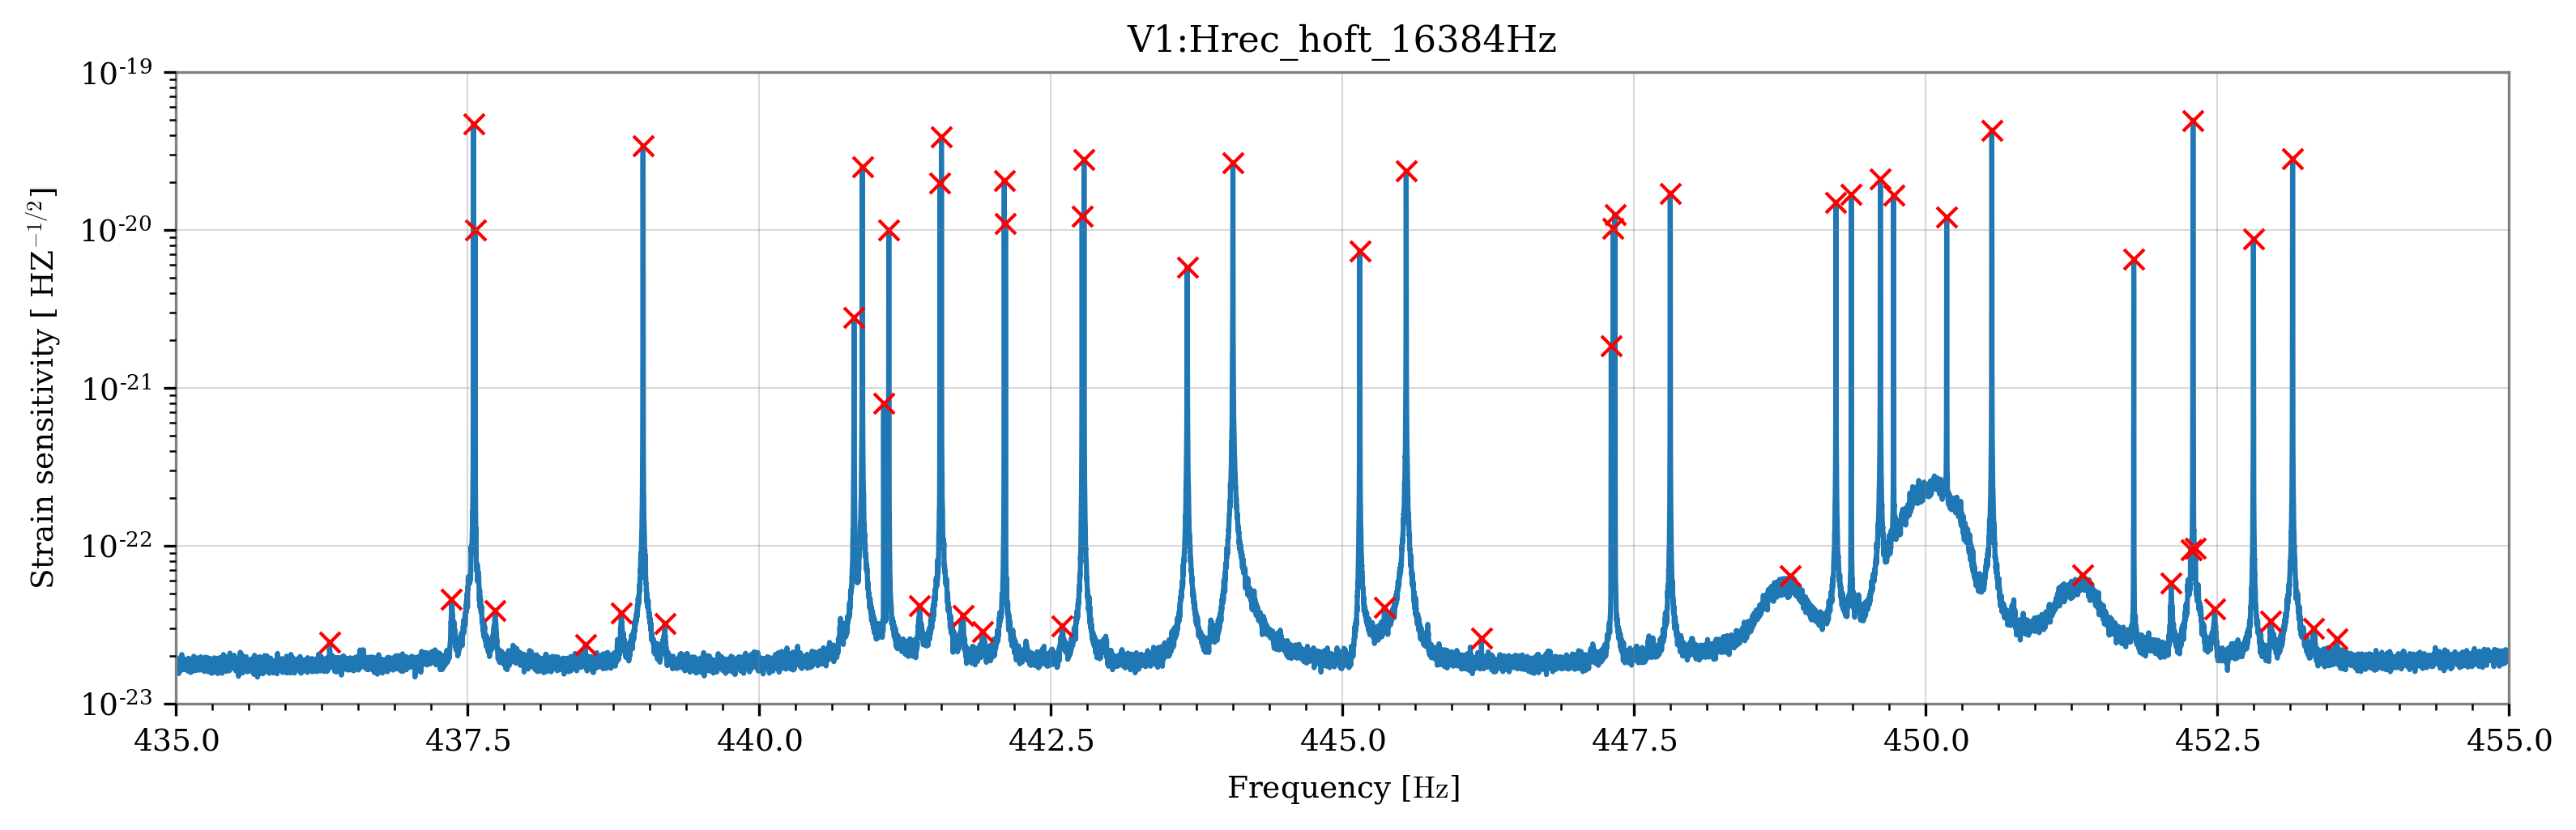
As part of the spectral noise study activity and the compilation of the Lines Database, I estimated a fairly detailed sensitivity curve with the data of the very stable lock of 27h05m24s of December 25. The Amplitude Spectral Density has been estimated with 1024-second long FFTs, 50% overlap, and median averages for being robust against the presence of the infamous 25-minute glitches. Then, I searched for lines with a very basic peak find algorithm based on the prominence of each peak. This quantity represents a measure of how much a peak stands out from the surrounding baseline of the signal and is defined as the vertical distance between the peak and its lowest contour line [Ref. scipy function]. This criterion is obviously quite crude but may be sufficient for a basic comparison.
Indeed, the peaks found can be compared for verification with those of other much more refined algorithms, such as NoEMi or STAMP-PEM. At this link, selecting the ER15-5 database, you can find the peaks of NoEMi for the same period of the mini-Engineering Run.
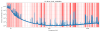
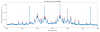
I attach to this entry just a couple of images of some regions of the spectrum, as well as the pdf with the details of the various parts of the sensitivity curve, and a CSV file (change its format from txt) with the list of peaks found and their prominence (log10).

