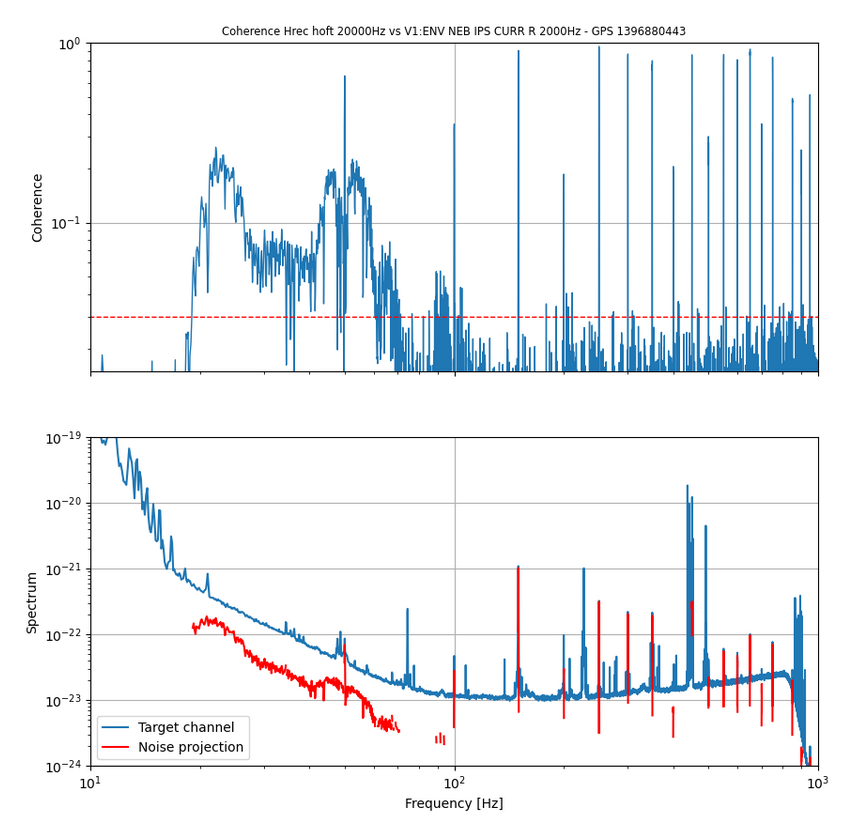
It seems that the coherence estimation by BruCo got fooled by one of the 25-minute glitches, happening at the end of the analyzed interval, UTC 14:20:25 2024/4/11 + 900 s. The glitch is recorded by omicron at 14:33:39.68. So, the spectral estimation is biased: don't trust this result.
The coherence mis-estimation is documented in this git issue.
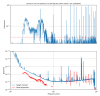
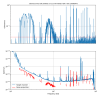
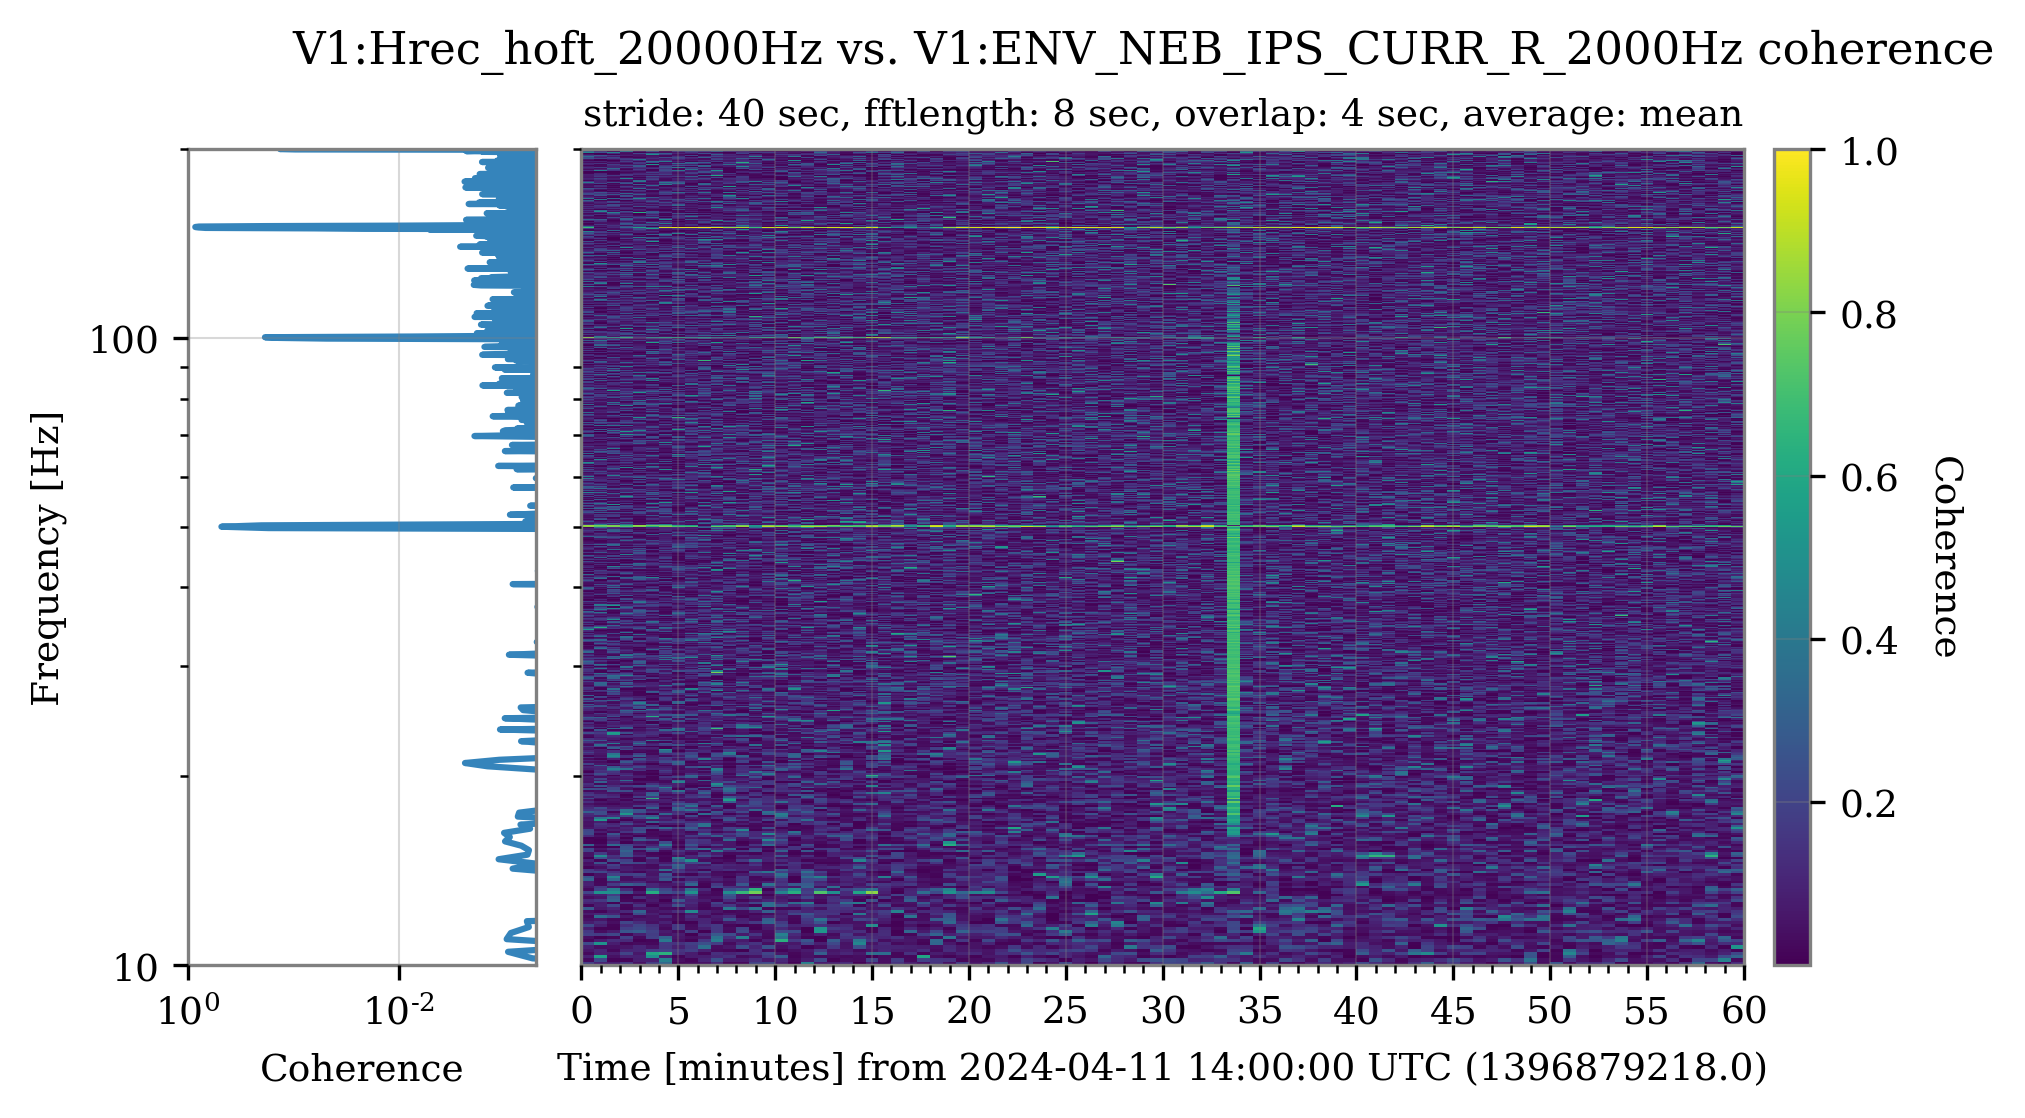
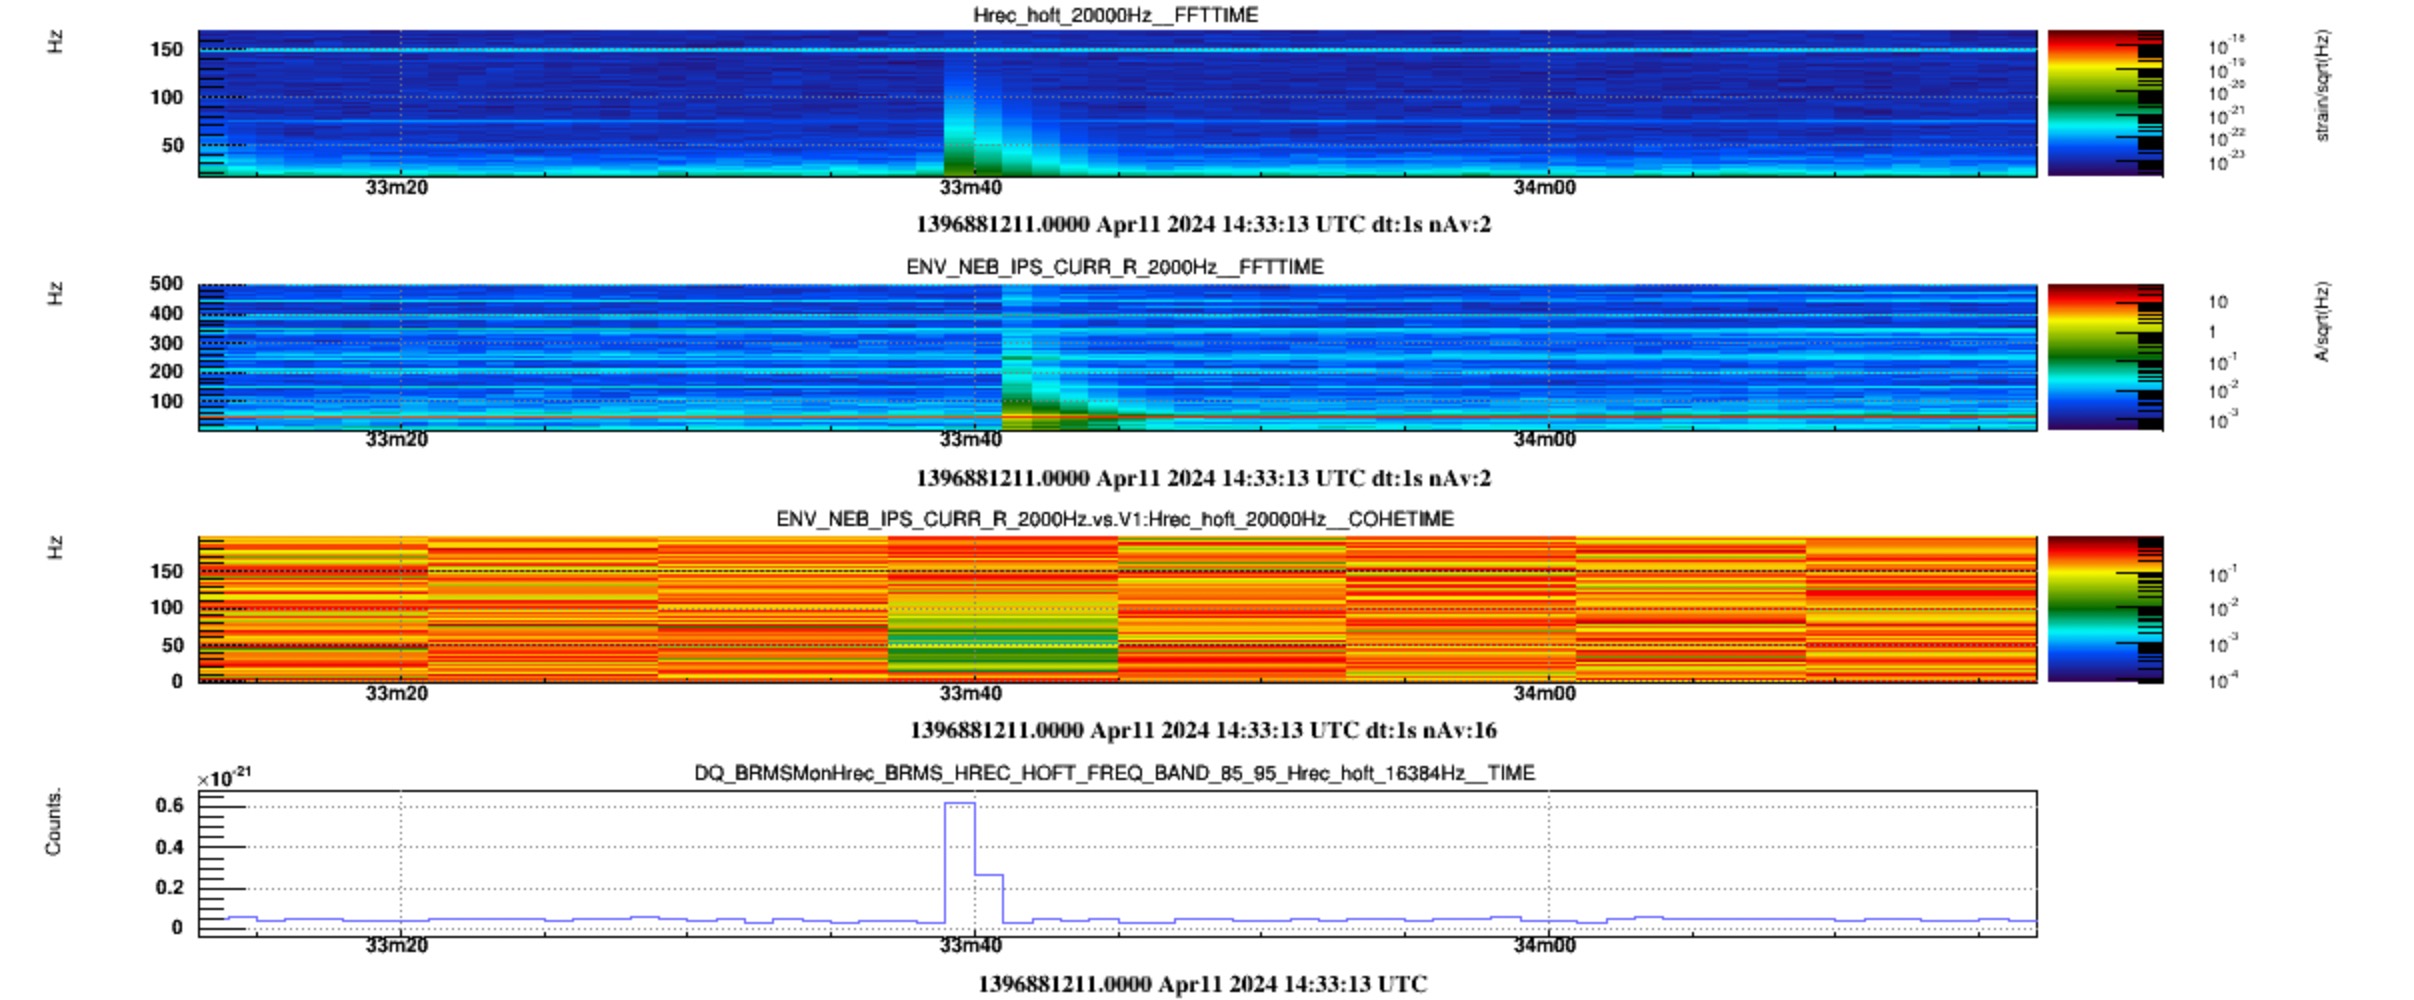
Figure 1: coherence spectrogram of 1 hour of data around the interval of yesterday BruCo run. The effect of the glitch is visible at 14:33 UTC as an excess of coherence. The left-hand side panel shows the estimated coherence in the 1-hour interval using the median method, which is more robust to glitches. Except for the 50 Hz line and its harmonics, no suspect coherence value is visible. Since v3r2, BruCo has available the --medianpsdestimation option to estimate the spectrum using the median instead of the average (Welch method).
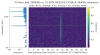
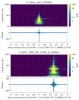
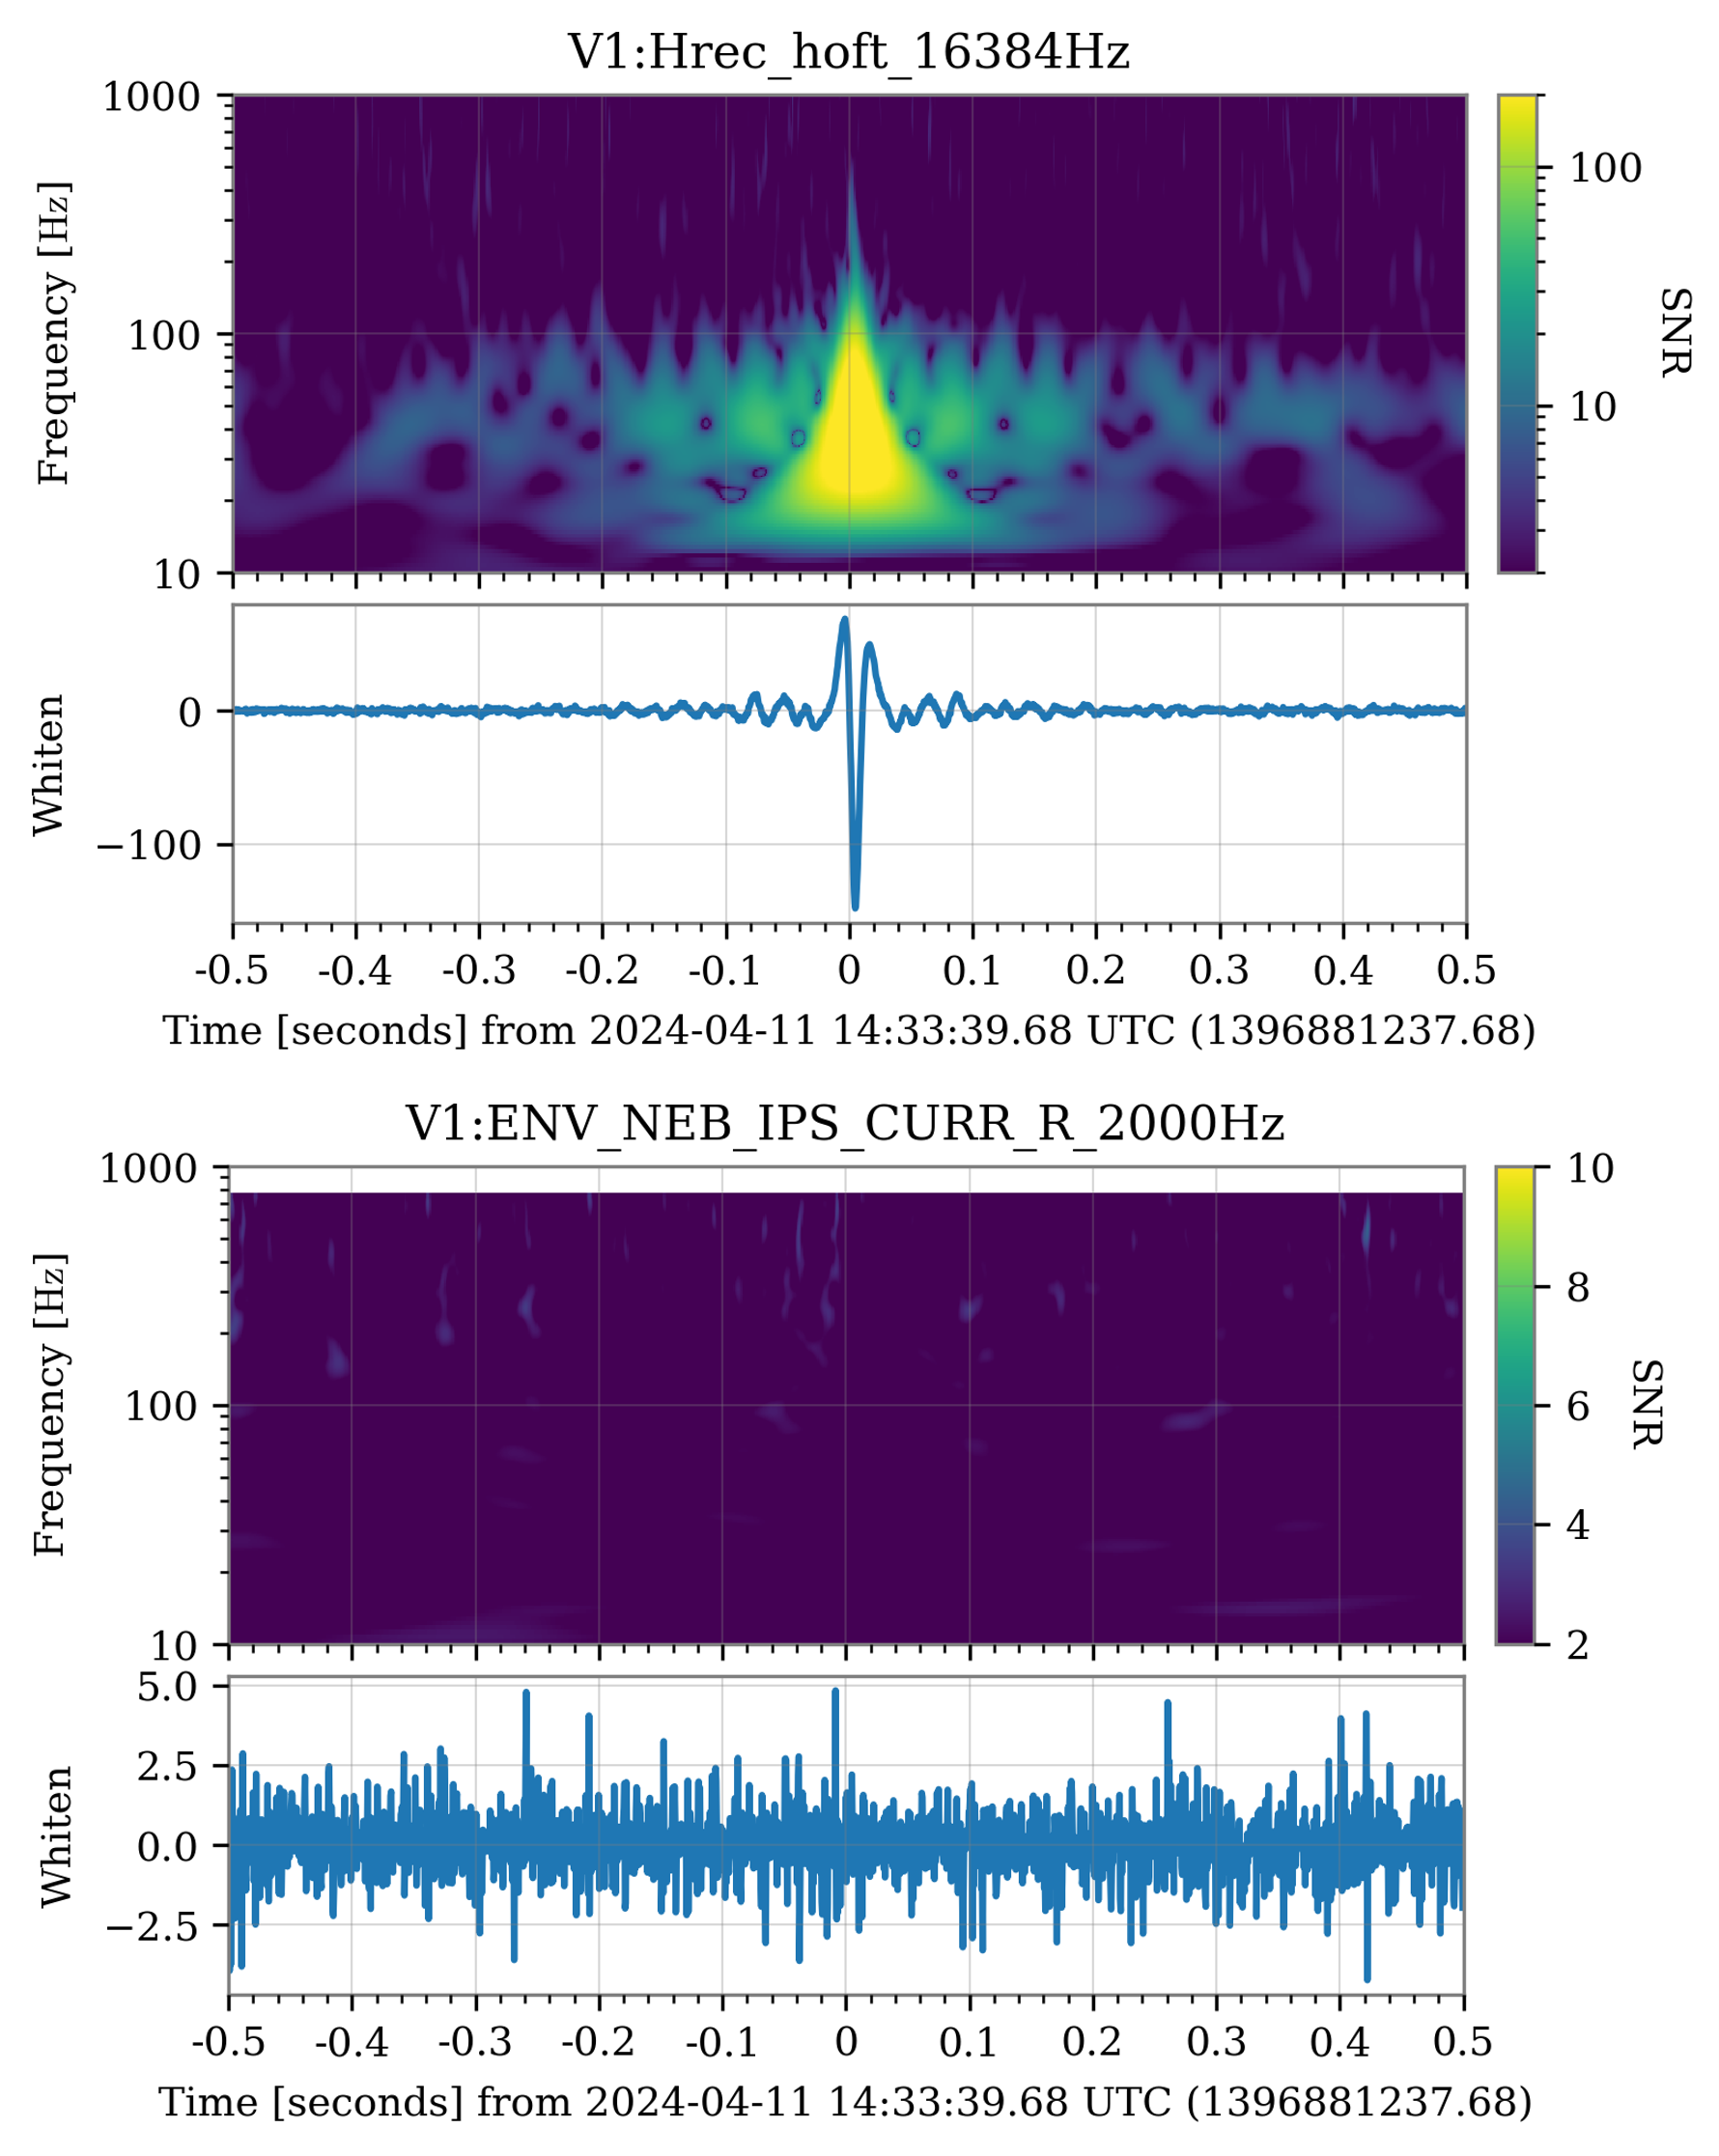
Figure 2: Q-scan and whiten time series of Hrec and V1:ENV_NEB_IPS_CURR_R_2000Hz in an interval of 1 second around the time of the glitch. The current channel shows absolutely no excess noise.
But then why the coherence between the two?
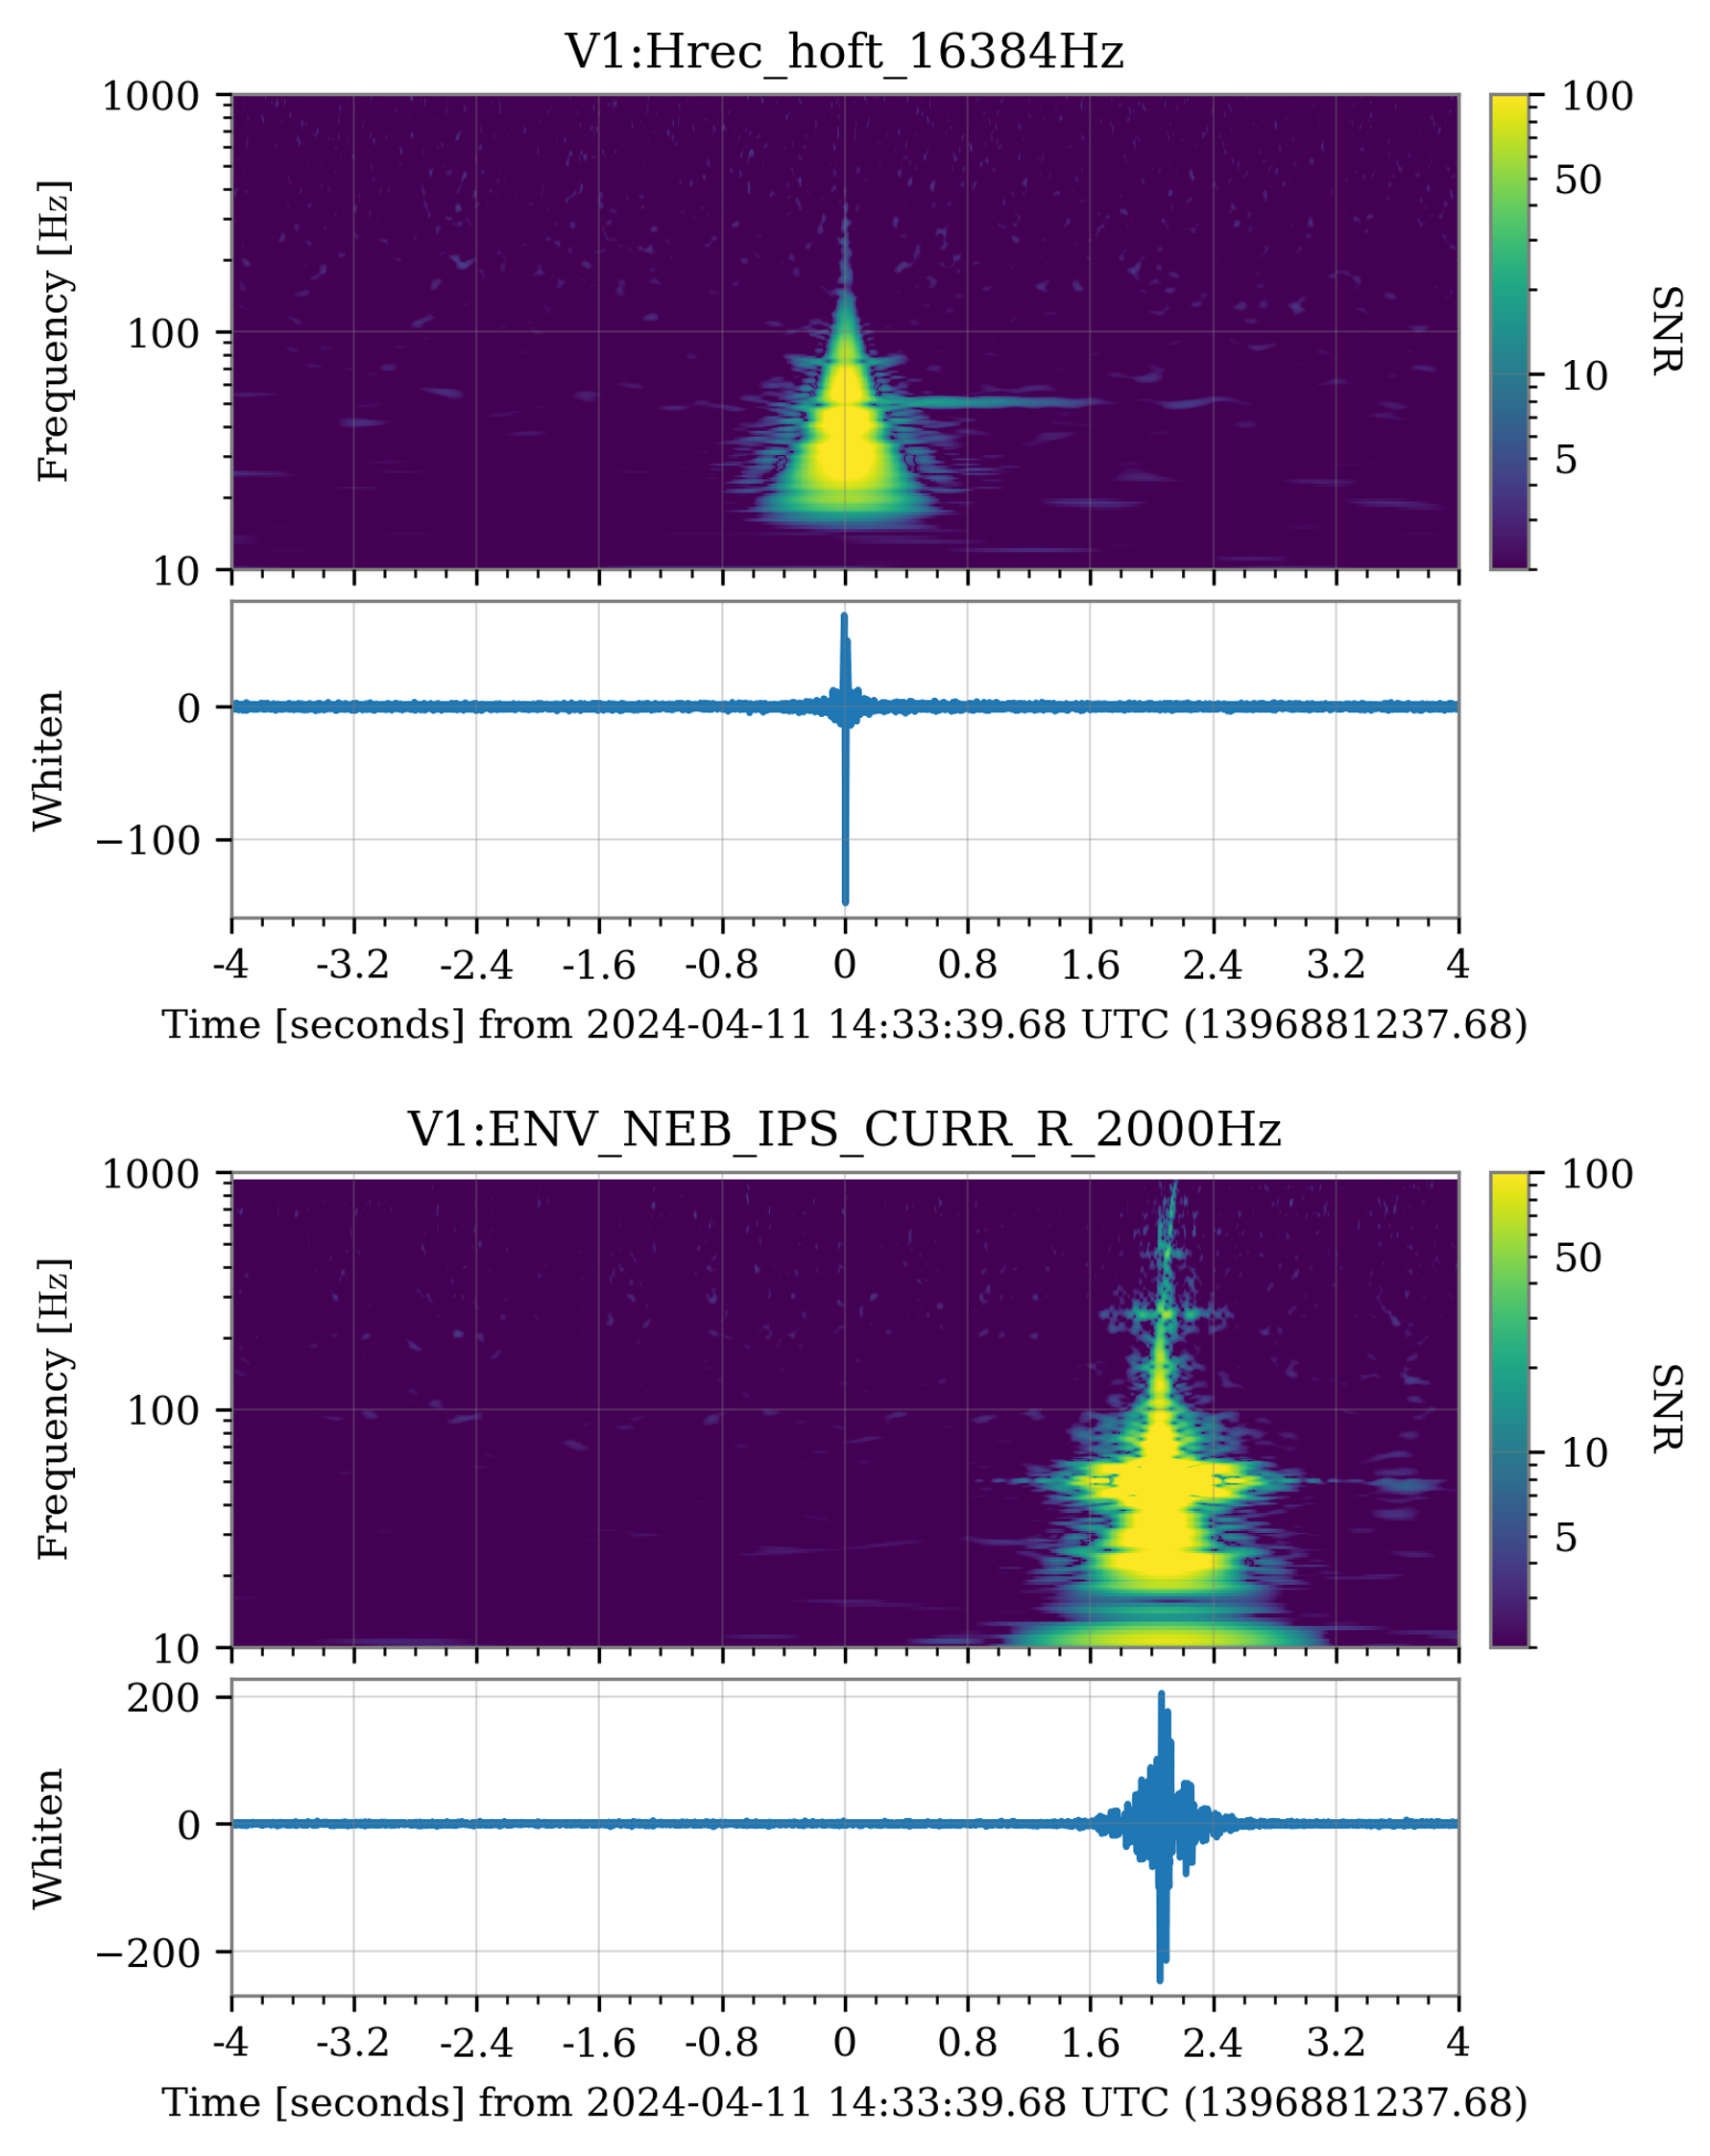
Figure 3: there is in fact a glitch in V1:ENV_NEB_IPS_CURR_R_2000Hz 2 seconds after that in Hrec, and of a vaguely similar shape, as visible from the spectrograms. The similarity in the spectrum has triggered a larger coherence value in the time bin of figure 1 embracing both glitches.
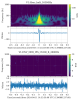
To confirm that this occurred just by chance, I plotted the spectrograms for other 25-minute glitches for both Hrec and V1:ENV_NEB_IPS_CURR_R_2000Hz. For all, no glitches in the latter channel have been observed.
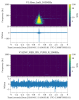
Figure 4: Q-scans of Hrec and V1:ENV_NEB_IPS_CURR_R_2000Hz for another glitch belonging to the 25-minute family.

