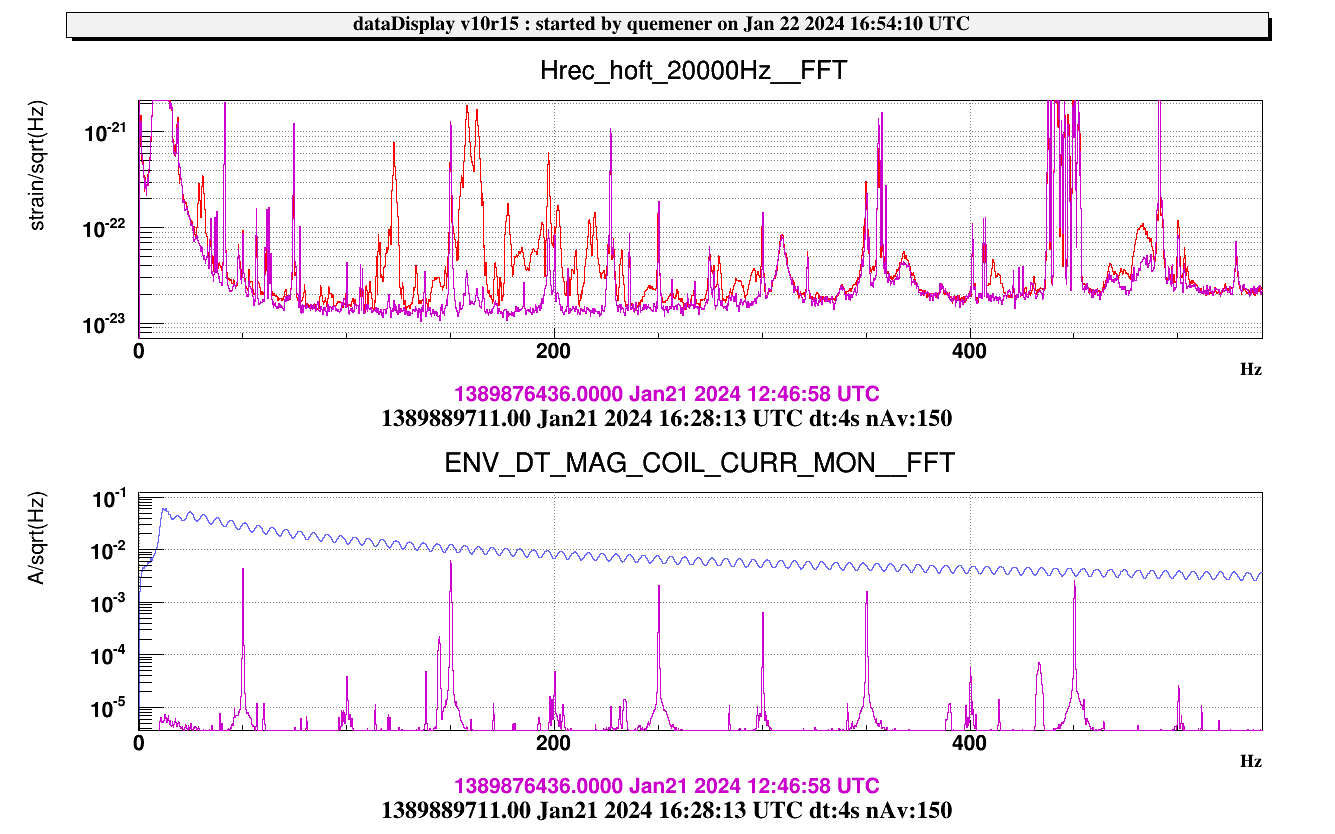
Below is a list of some peak frequencies (Hz) which were excited during the close field magnetic injection on SDB1. The peaks marked with a cross X are also present w/o excitation. A plot showing Hrec during injection (red curve) along with a reference curve w/o injection (violet curve) is attached.
28.7
30.5
122.7
133.2
155.2
157.7 X
162.7 X
165.2 X
171.3 X
177.4
194.1
196.9 X
201.6 X
210.0
216.8
219.1
232.2
279.0 X
410.8
482.2 X? Bump