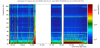
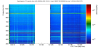
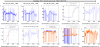
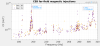
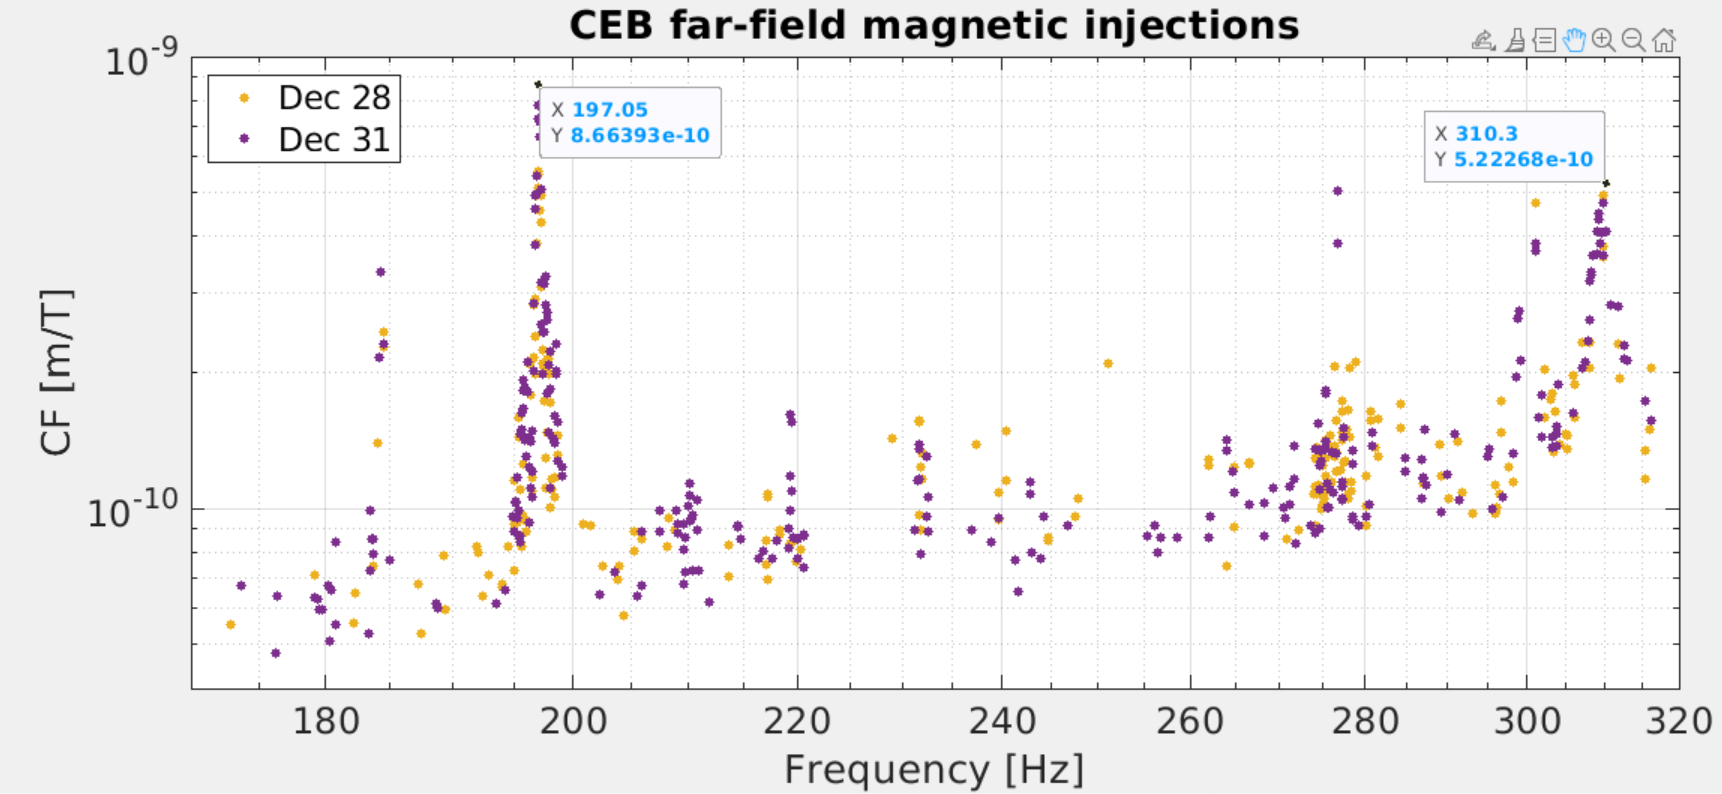
There are many bumps at a few hundred Hz that are higher than an few weeks ago. In particular a bump at ~310Hz and ~196Hz. These might be related to the setting of the Etalon control loops.
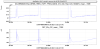
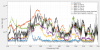
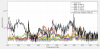
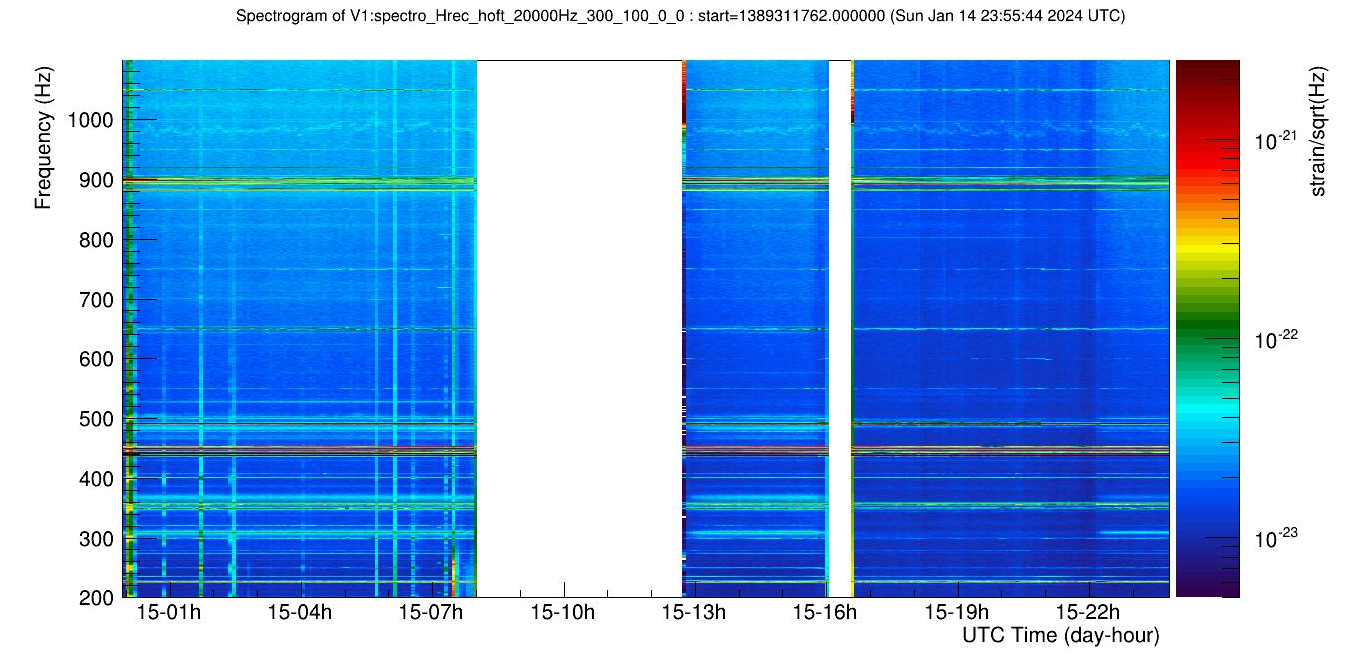
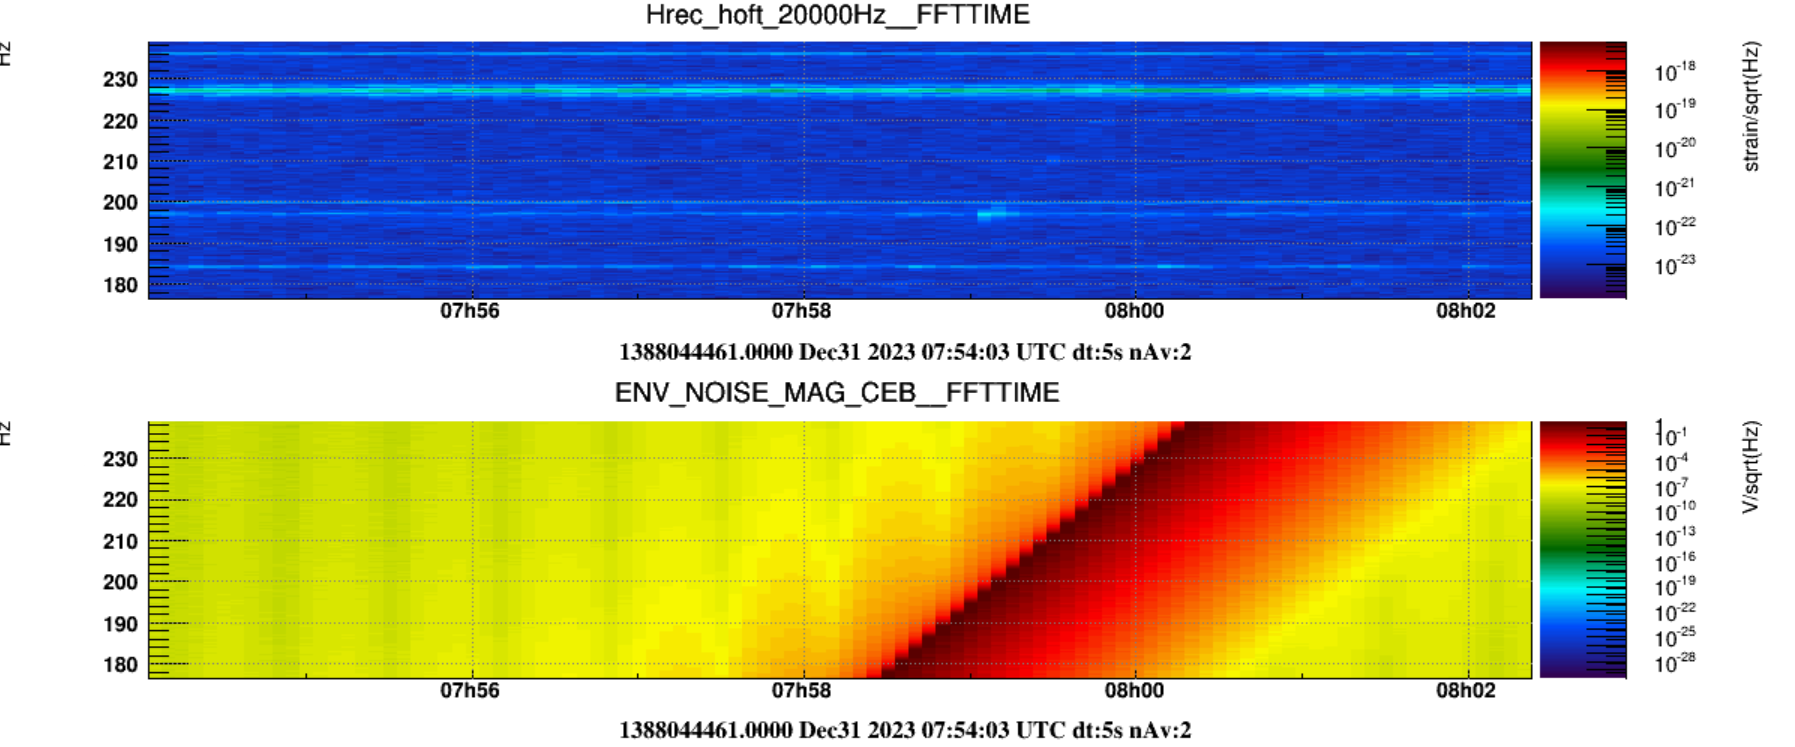
Figure 1 and 2 show between 16:00 UTC and 22:00UTC last night a LN2 lock (SR aligned), that transition to LN3 at ~22:00 UTC. The lines appear during the transition to LN3, most likely because of the change in SR alignement.
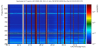
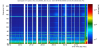
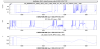
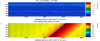
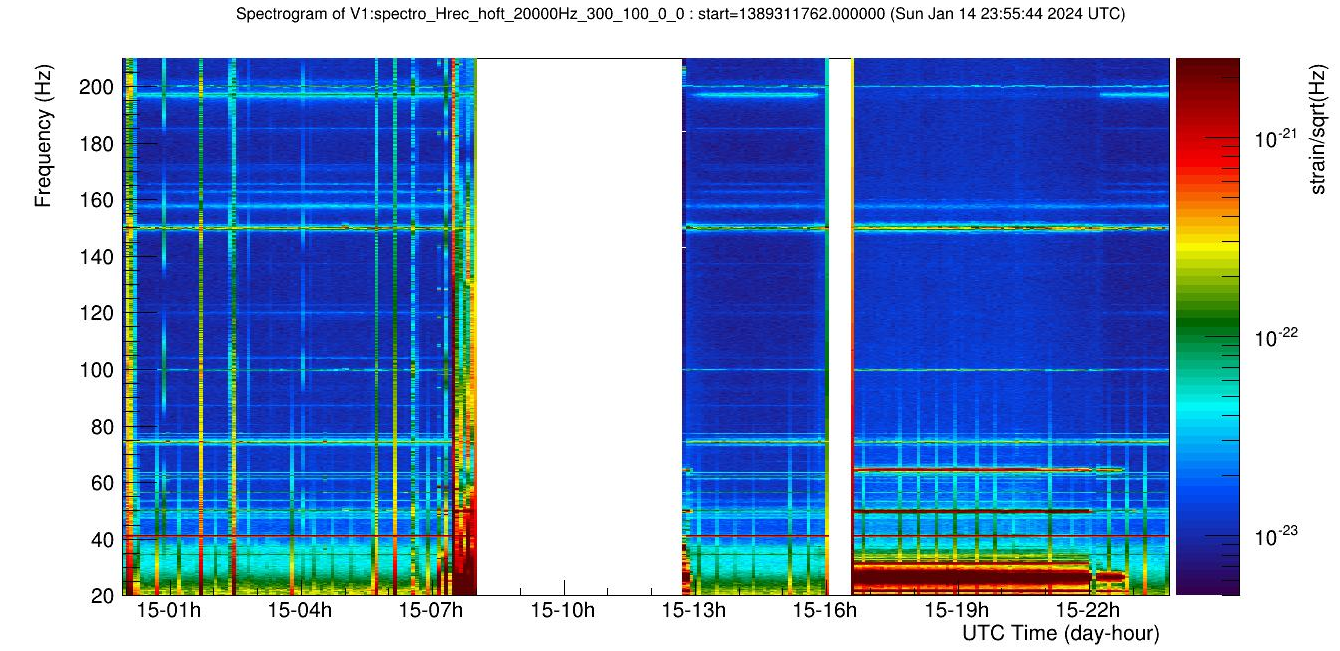
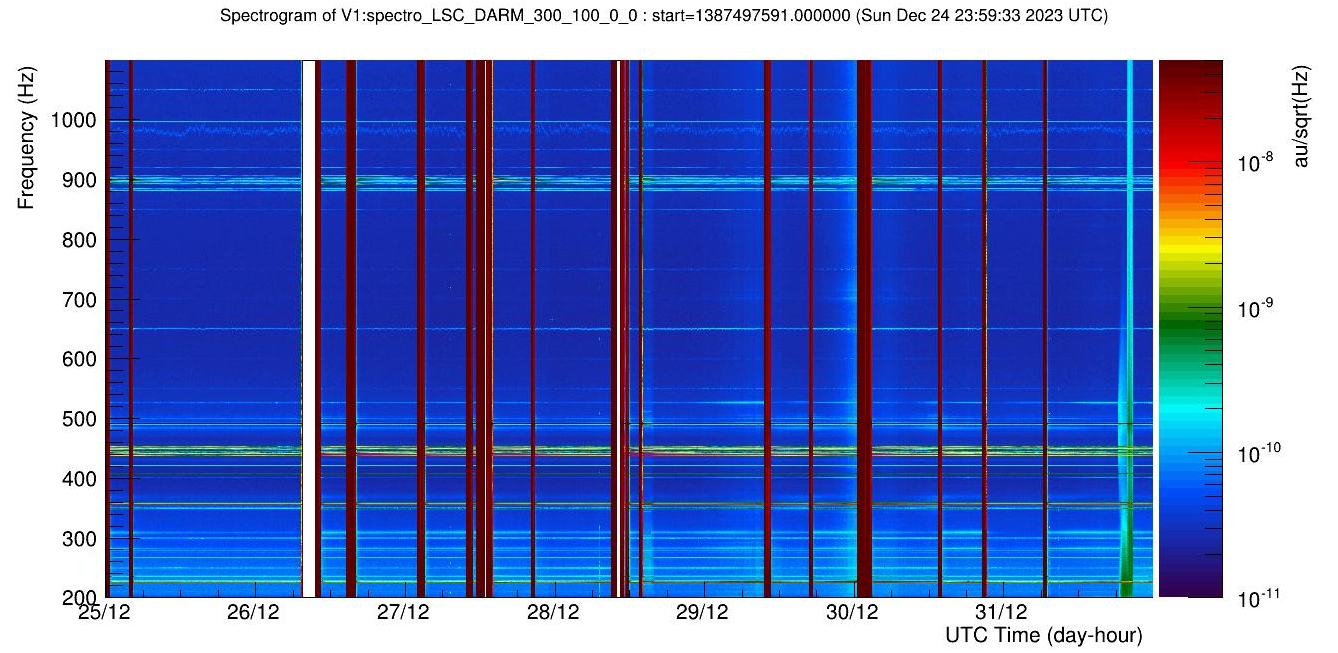
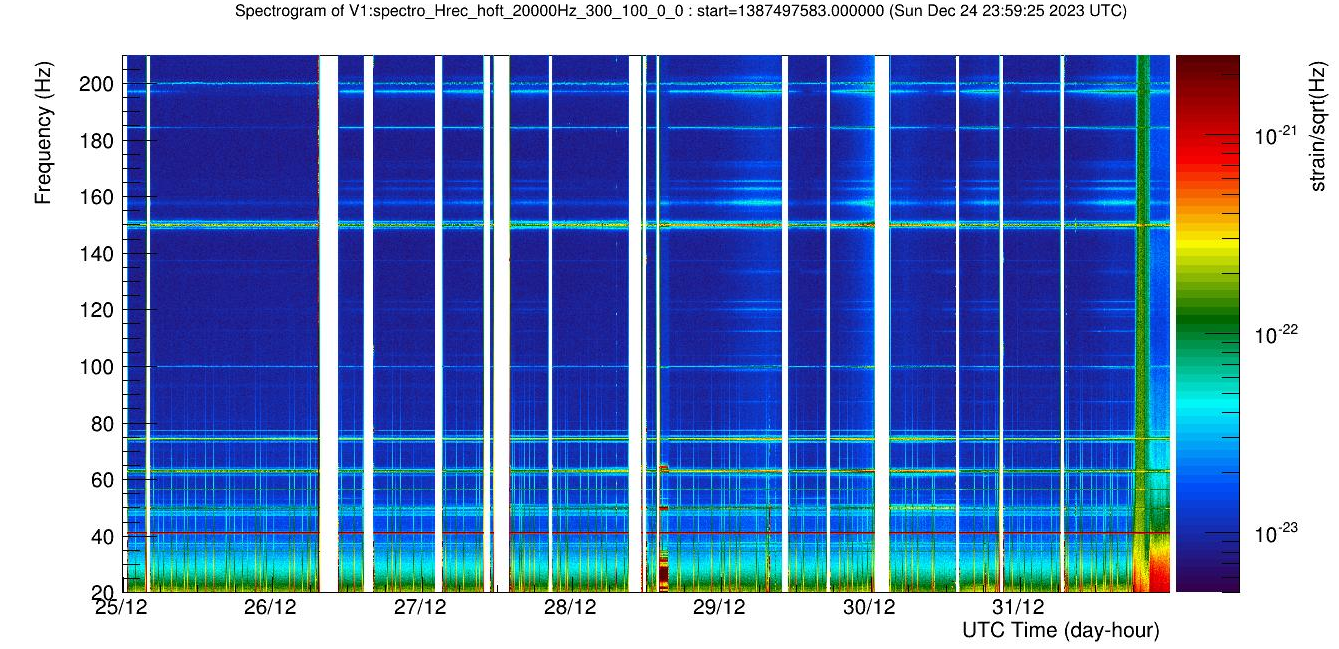
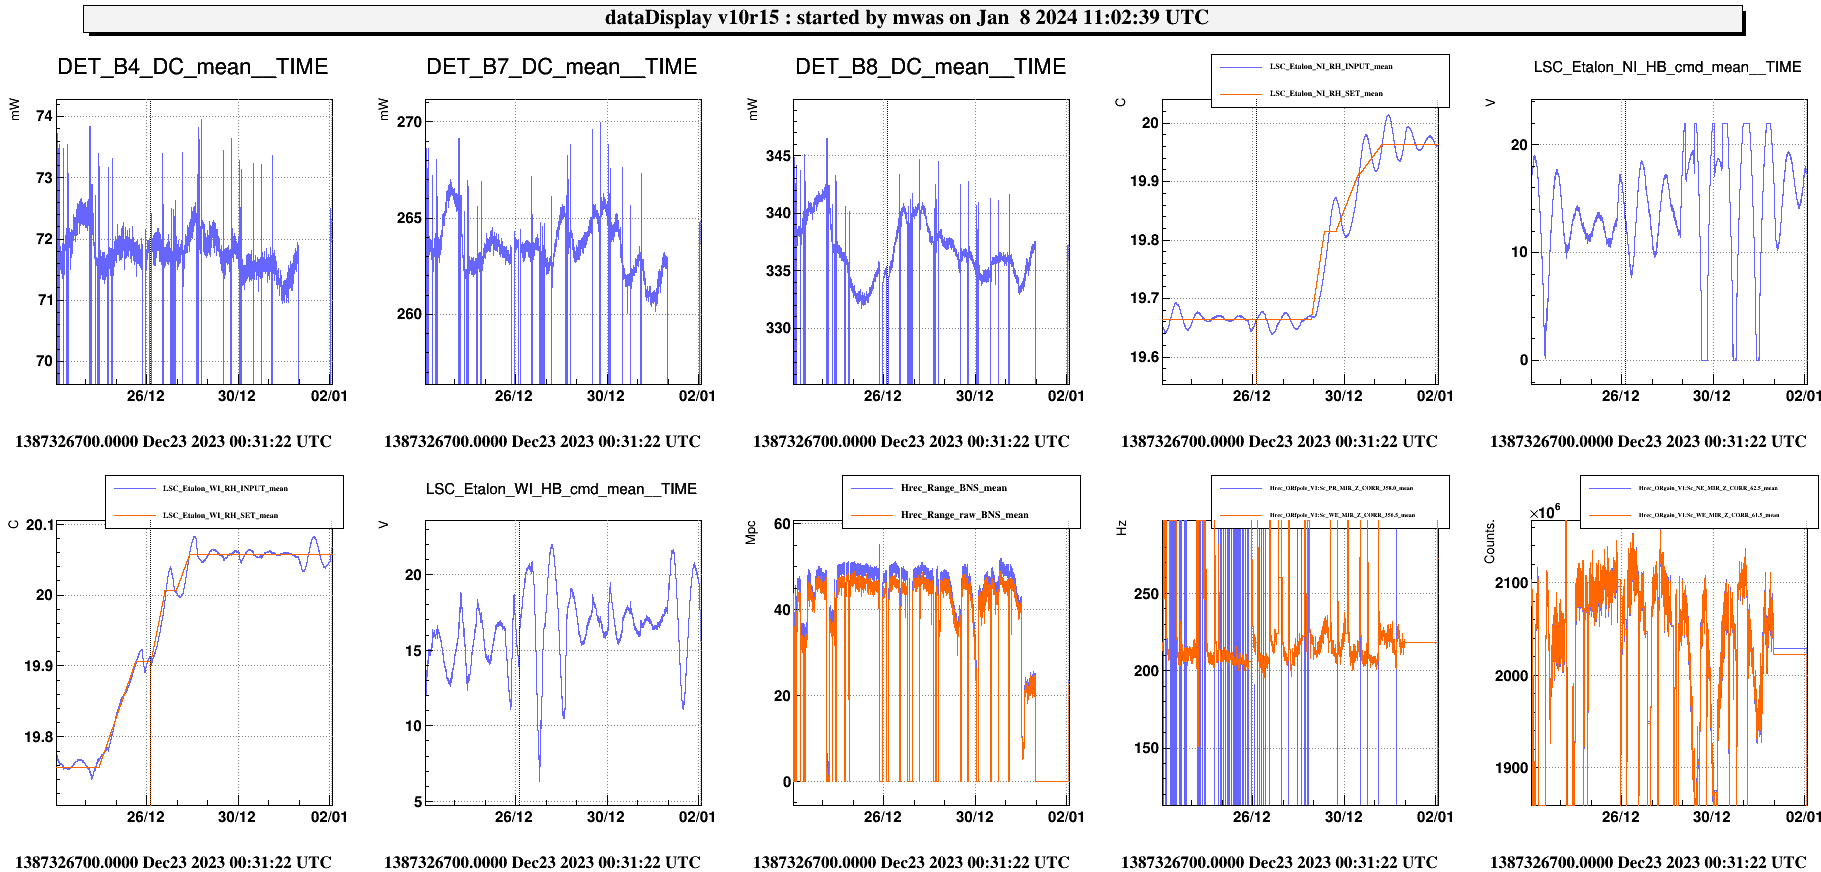
Figure 3 and 4 show that during the Christmas engineering run the line amplitude has been changing from lock to lock. Most noticable around Dec 31. This could be related to change in the Etalon set point (see figure 5).
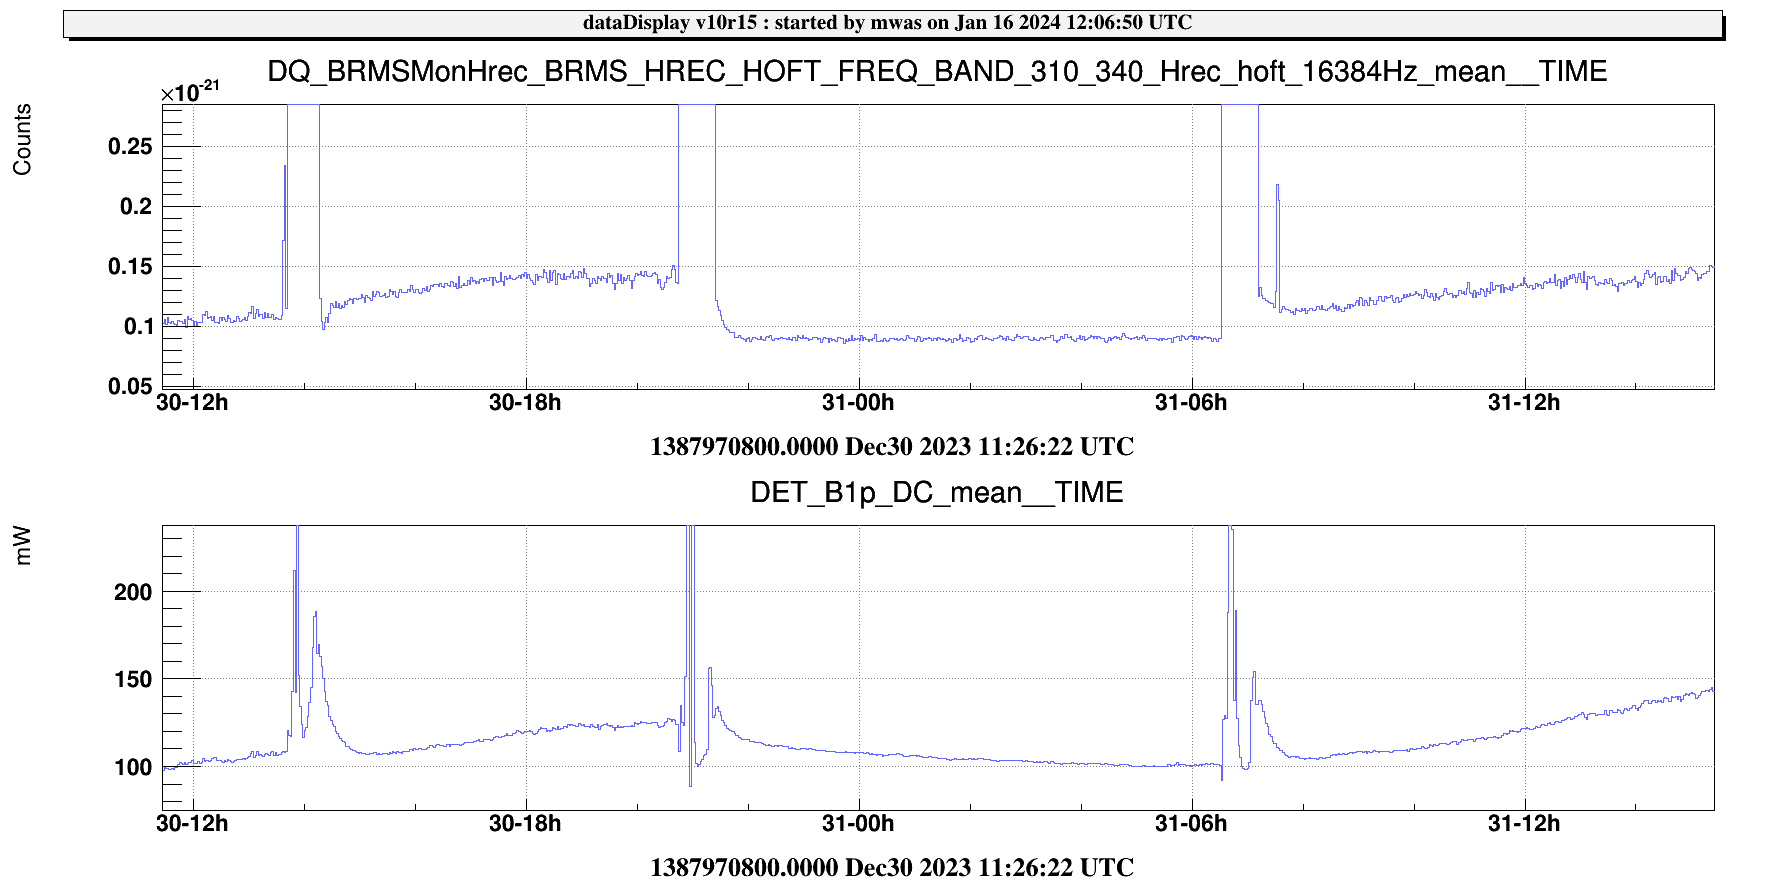
Figure 6 back on Dec 30-31 there was some relation between the height of the 310Hz and the power on B1p (the power on B1p was changing due to the steps on the NI Etalon)
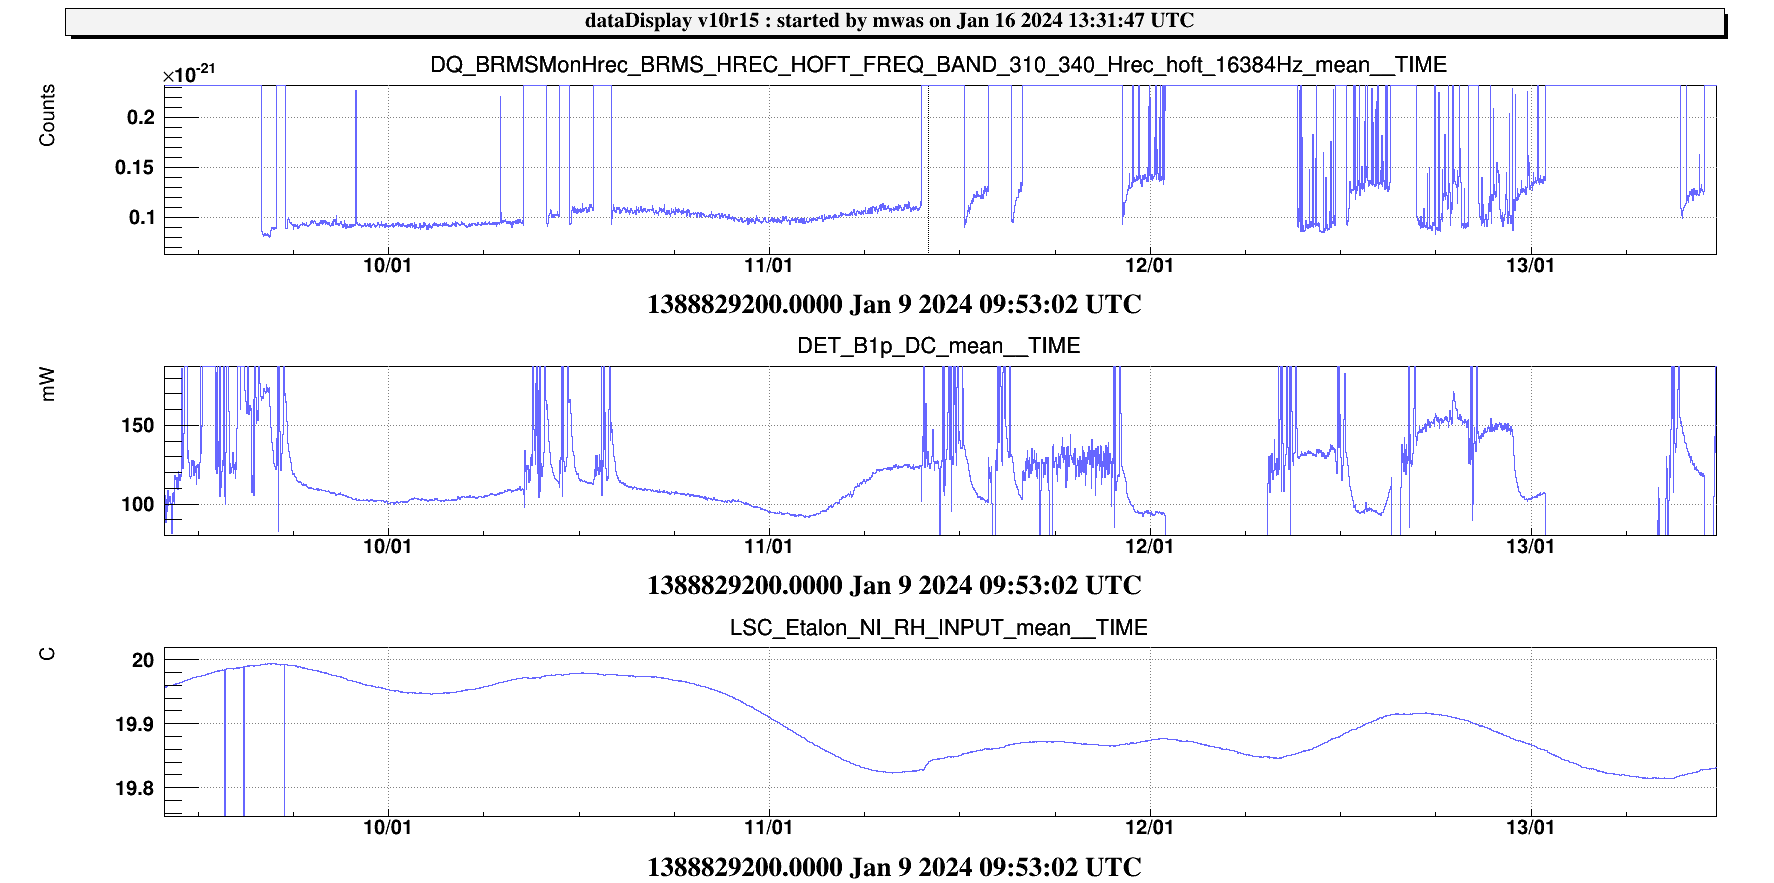
Figure 7 there was a step on the NI Etalon done during the night of Jan 10-11. The 310Hz seems to be high since that change.