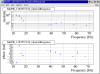
Optical response of PR measured during calibration shift of 19 December
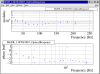
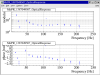
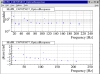
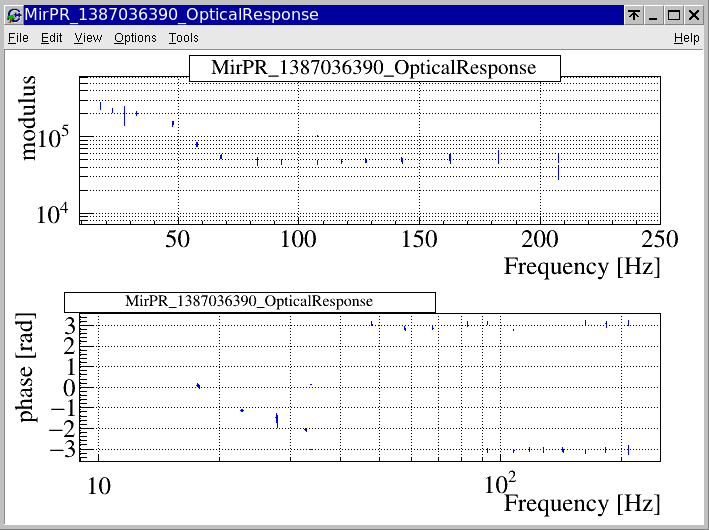
The first four plots show the "daily-like" measurements at 15h45 (aligned SR), 17h59 (still aligned SR), 19h31 (first misalignment of SR), and 21h16 (second misalignment of SR). The measurements are all a bit different and we do not have enough of them to extract a systematic effect of SR alignment.
The list of injected frequencies is: 17.70 , 22.70, 27.70, 32.70 , 47.70 , 57.70 , 67.70, 82.70 , 92.70 , 107.70 , 117.70 , 127.70 , 142.70 , 162.70 , 182.70 , 207.70 , 257.70 Hz.
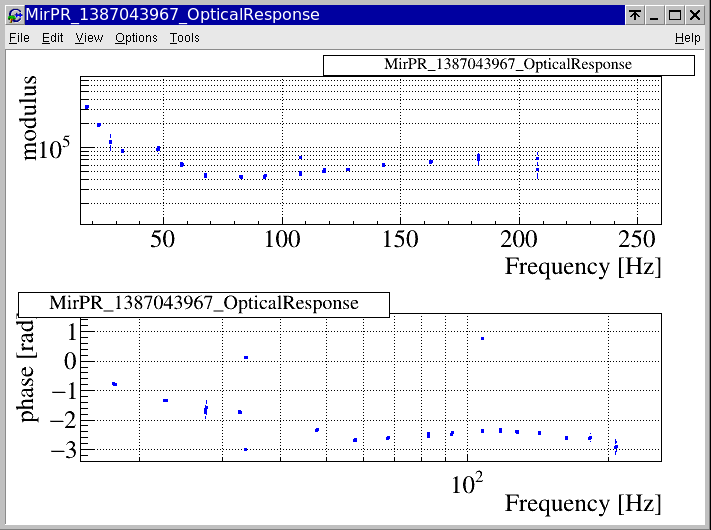
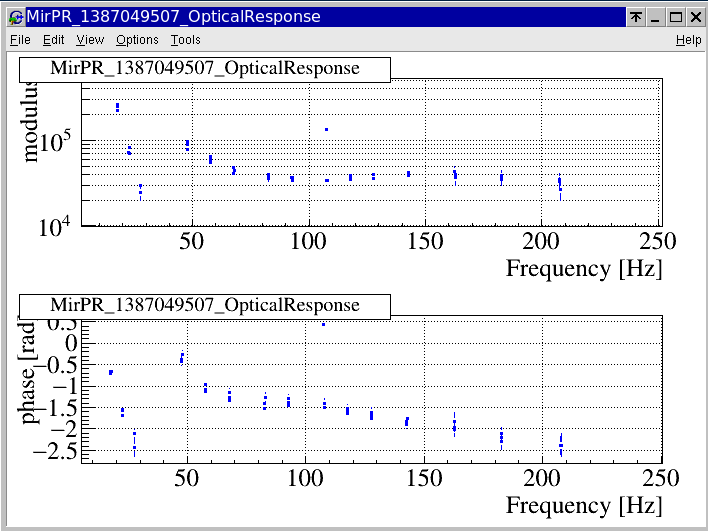
In the first two plots (SR aligned) they are all visible in the measurement, except for the last one. In the figures 3 and 4 (SR misaligned), there is one point not visible around 30 Hz ( once at 32.7 Hz, once at 27.70 Hz), which may indicate a "notch" (partially confirmed in later measurements).
Difference are more visible on the phase: it seems rather flat above 40 Hz when SR is aligned, and not flat above 40 Hz when SR is misaligned. And there is also a jump of about pi around 30-40 Hz in the case of SR misaligned, that is not seen when SR is aligned (which also goes in the direction of having a "notch" around 30-40 Hz).
The general shape of the response below 40 Hz is difficult to define from these measurements with only a few lines injected.
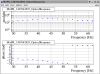
In addition to these "standard" injections, some more lines were injected. Here are two more useful measurements:
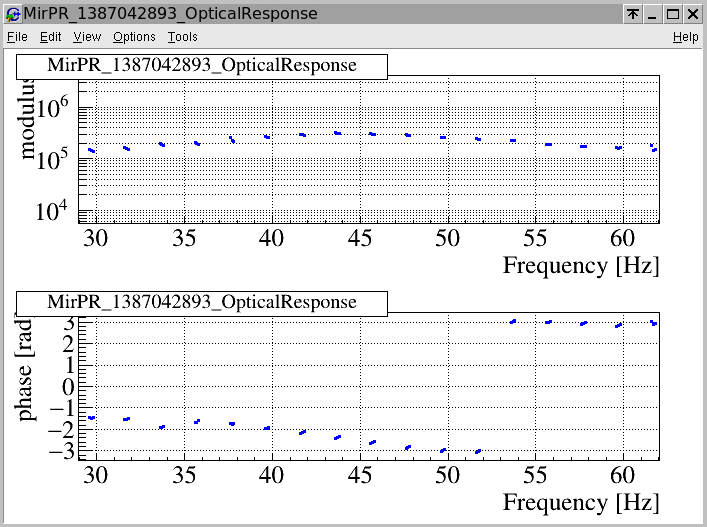
- figure 5: at 17h41 (SR aligned): 17 lines between 29 an 62 Hz.
- 29.70, 31.70, 33.70, 35.70, 37.70, 39.70 , 41.70 , 43.70 , 45.70 , 47.70 , 49.70 , 51.70 , 53.70 , 55.70 , 57.70 , 59.70 , 61.70 Hz
- All the injected lines are visible in the measurements.
- figure 6: at 21h38 (second SR misalignment): 18 lines between 9 and 73 Hz.
- 9.70 , 12.70 , 14.70 , 16.70, 17.70 , 20.70 , 22.70 , 24.70, 27.70 , 29.70 , 32.70 , 37.70 , 39.70 , 43.70 , 47.70 , 57.70 , 67.70 , 72.70
- Not all the lines are visible: lines between 20 and 33 Hz are not seen. It seems that there is some hole (notch?) here in the response, which is difficult to see in the standard calibration with much less lines, except for the one point missing around 30 Hz.
For further studies of the PR optical response, in particular the low frequency part, we should inject the 18 lines between 9 and 73 Hz more regularly.
