Reports 1-1 of 1 Clear search Modify search
AdV-DAQ (Calibration)
verkindt, rolland, magazzu (operator) - 23:24 Tuesday 19 December 2023 (62791) Print this report
CAL shift dedicated to PR and SR optical response

After adding a line at 45 Hz in the set of standard lines used for CAL injections for CheckHrec or Optical Response measurements, we have started the following sequence in LN2:
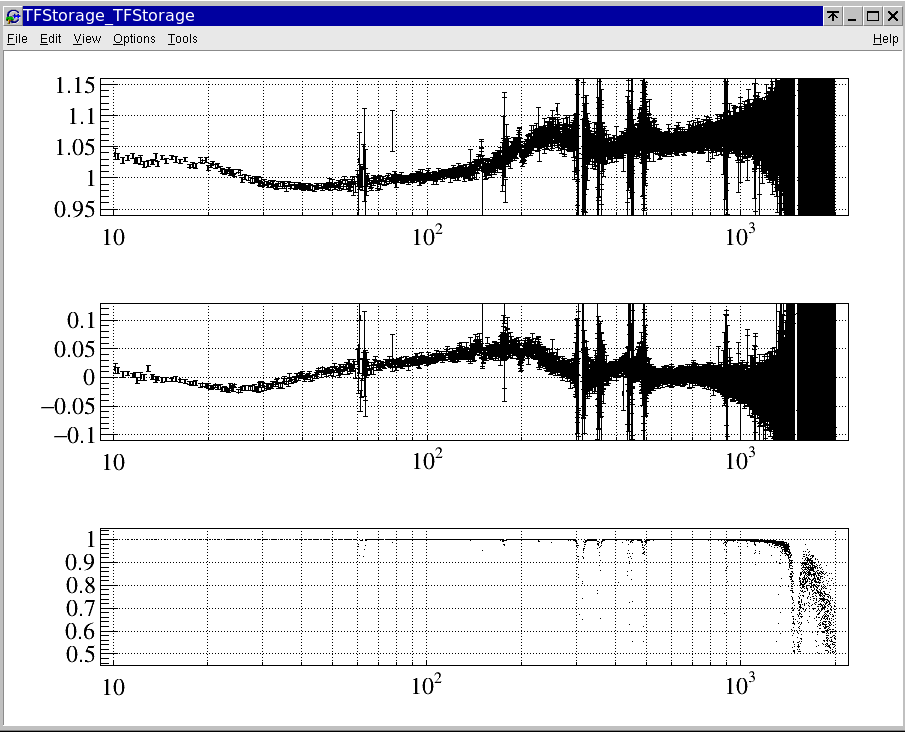
15h40 UTC: CALIBRATED_DF_DAILY standard (checkhrec+NE,WE,BS optical responses+PR, SR optical responses+sensitivity measurement)
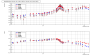
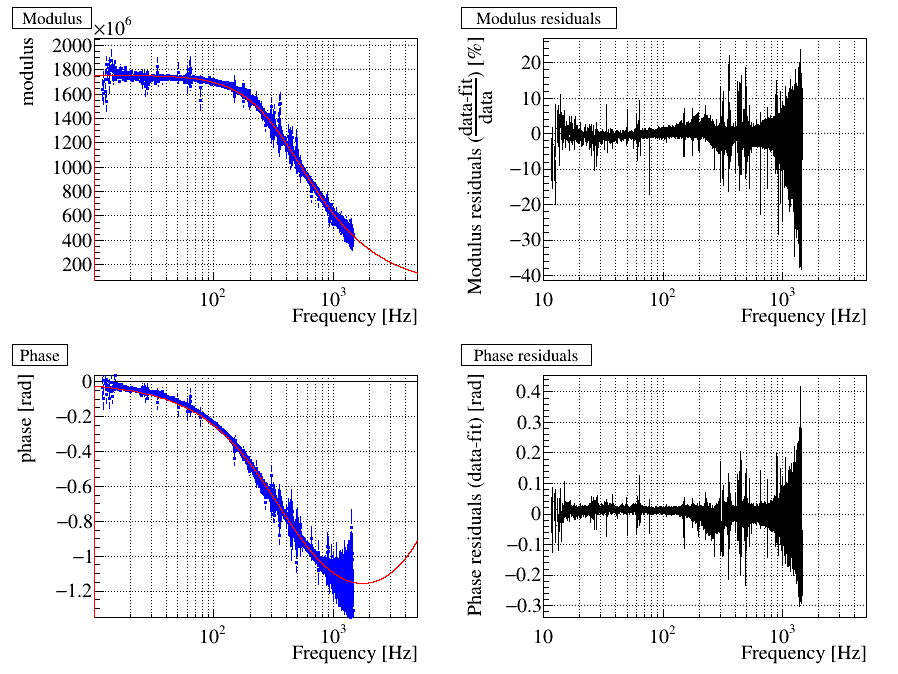
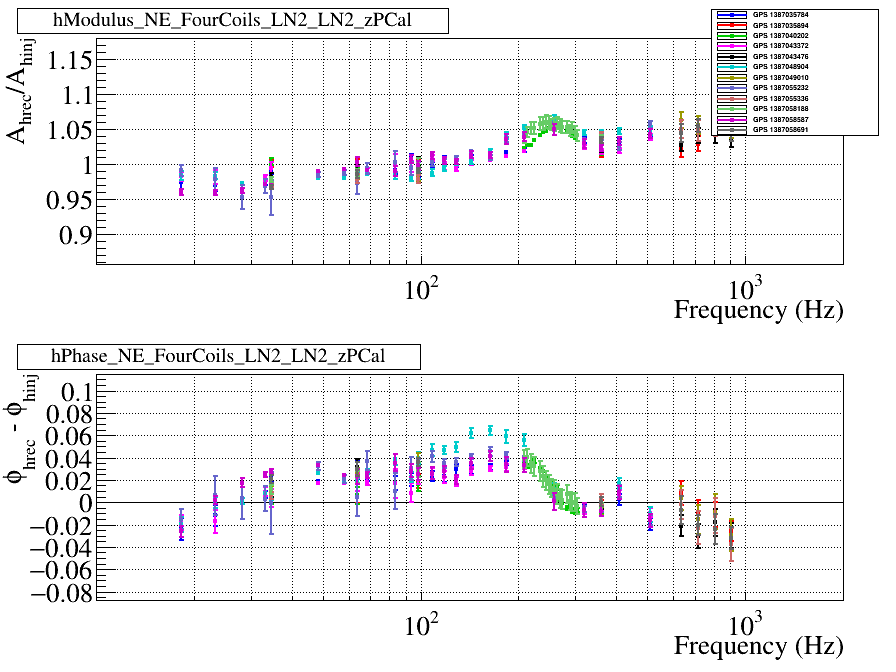
16h15 UTC: only CheckHrec between 200 and 300 Hz --> Failed
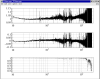
16h55 UTC: only CheckHrec with a dedicated set of injected lines between 200 and 300 Hz (snr=20 for EM actuators, snr=10 for PCal)
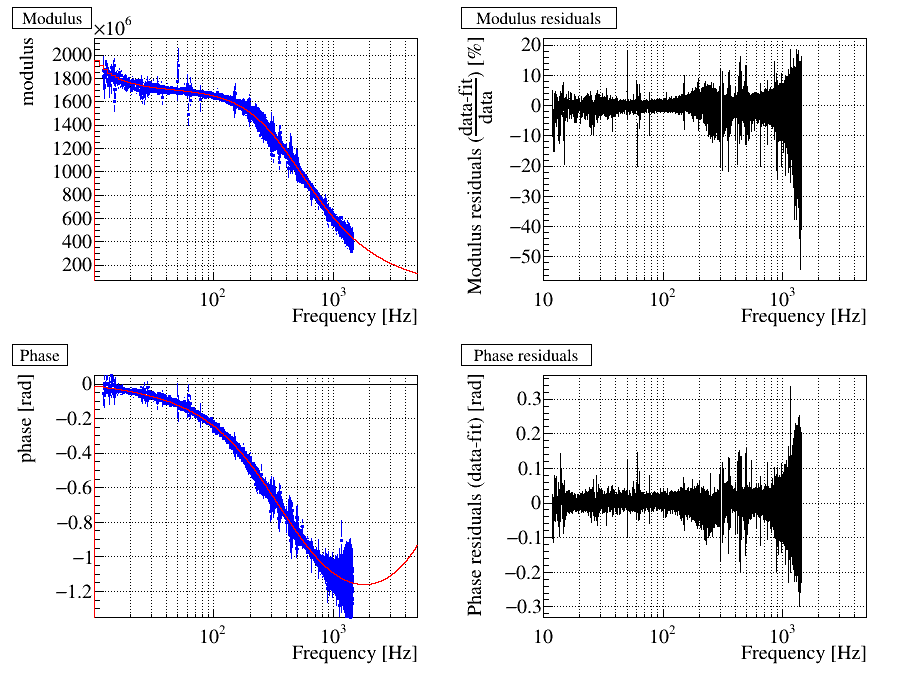
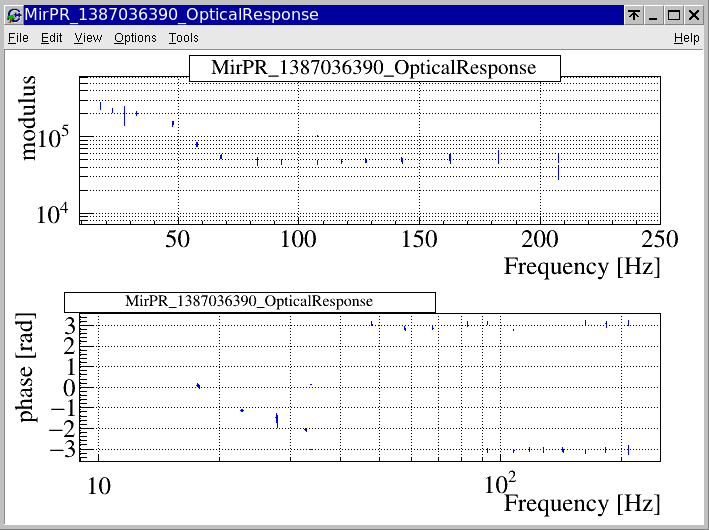
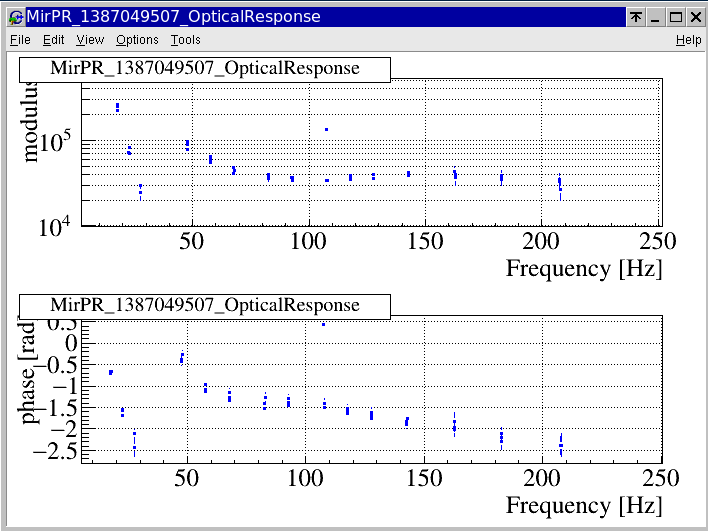
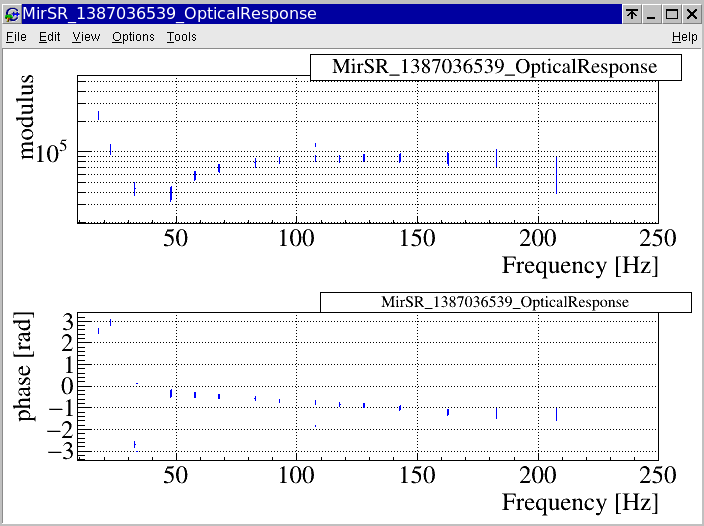
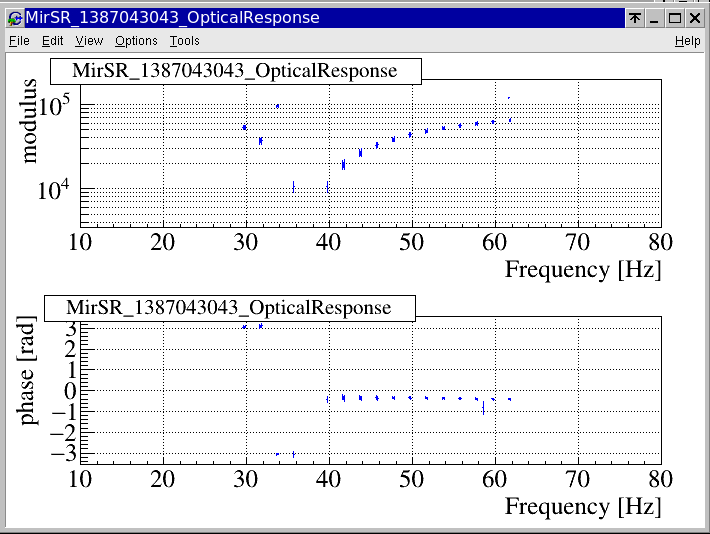
17h05 UTC: only PR and SR optical response measurement with two sets of injected lines: 6-75 Hz and 75-320 Hz (snrmir=1e+5, snrdarm=100)
17h18 UTC: only PR and SR... (snrmir=2e+5, snrdarm=200)
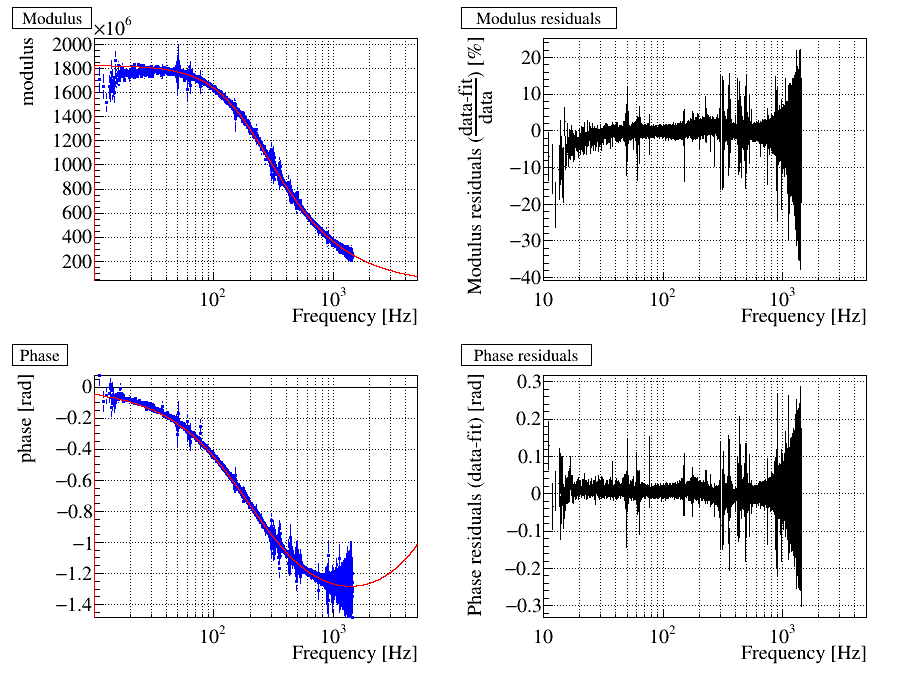
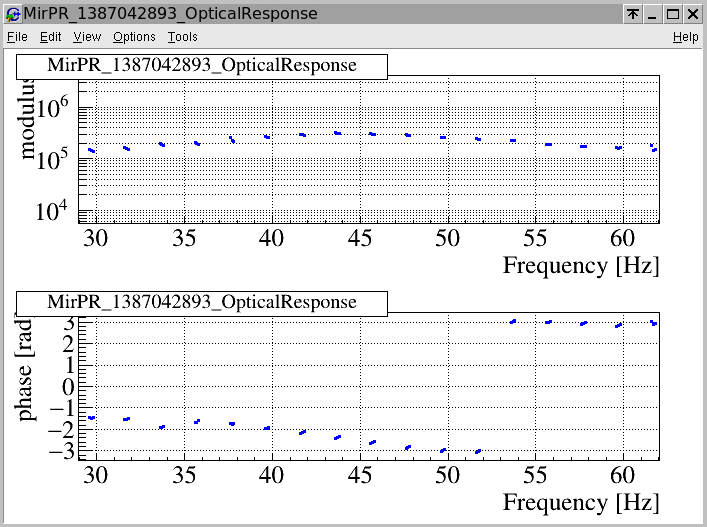
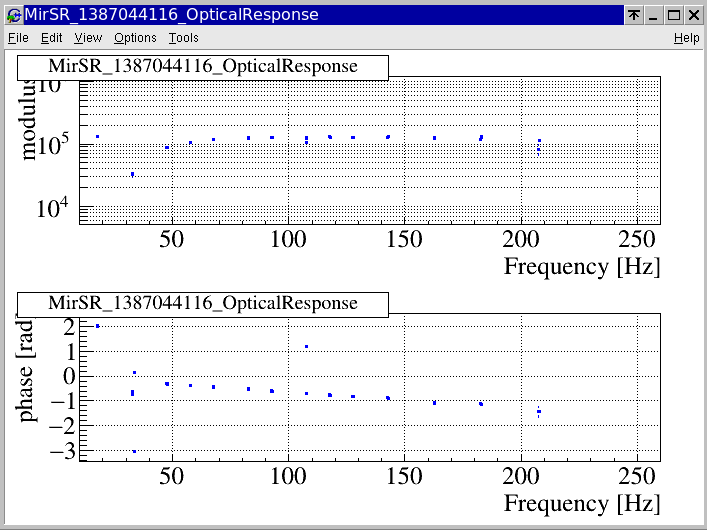
17h31 UTC: only PR and SR optical response measurement with a specific set of lines between 25 and 60 Hz (snrmir=2e+5, snrdarm=200)
17h40 UTC: only PR and SR optical response measuremnet with a specific set of lines between 25 and 60 Hz (snrmir=8e+5, snrdarm=200)
17h47 UTC: CALIBRATED_DF_DAILY standard, once again

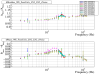
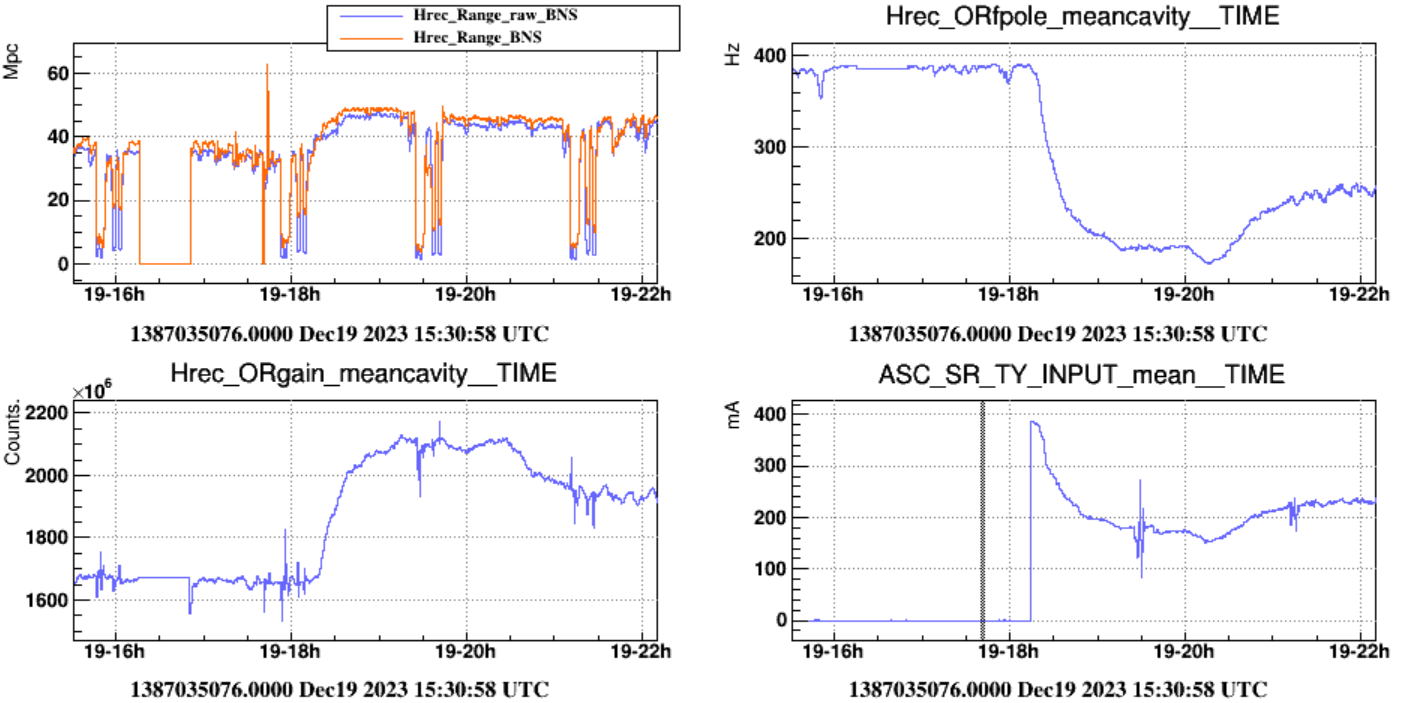
Then, the operator moved in LN3 and started the misalignment of SR down to step 170 for SR_TY_INPUT. After about one hour, the pole frequency estimated by Hrec stabilized around 188 Hz.
19h19 UTC: CALIBRATED_DF_DAILY standard  (with snrmir=1e+5 and snrdarm=100 for the PR and SR optical response measurement)

Then, the operator moved the misalignment to the value 240 for SR_TY_INPUT. The pole frequency raised up to 230 Hz. In this configuration, we did the following injections:
21h05 UTC: CALIBRATED_DF_DAILY standard
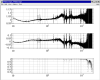
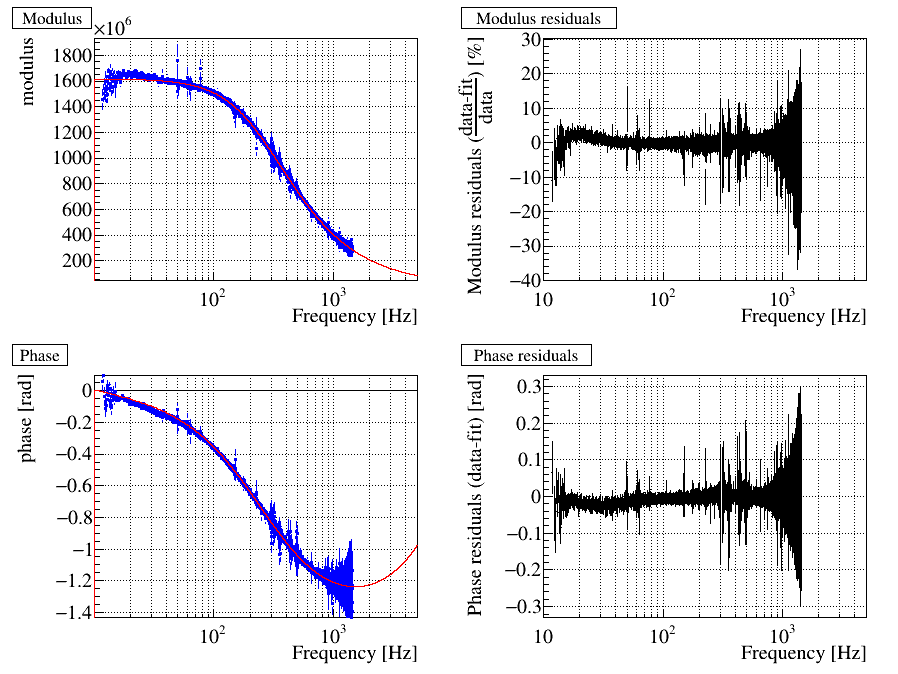
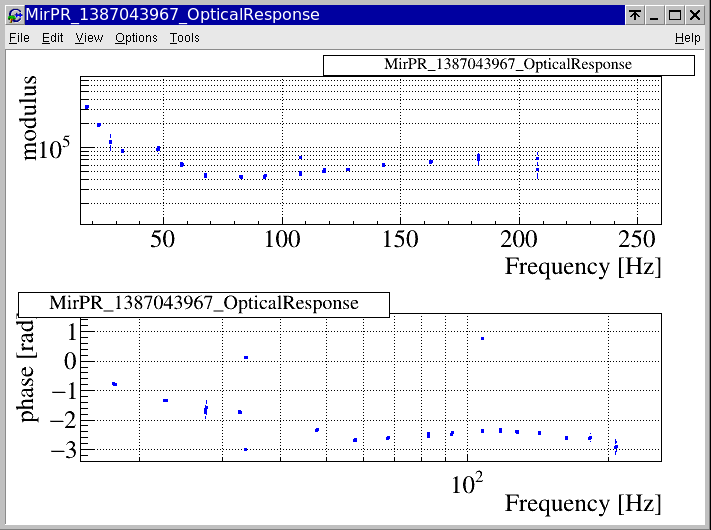
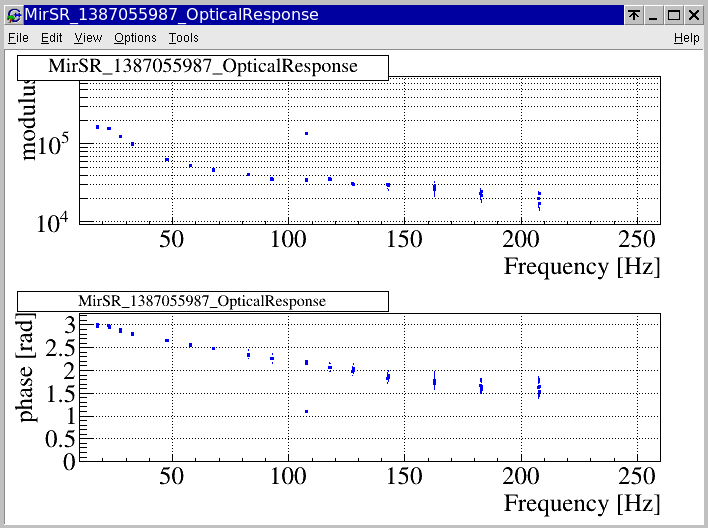
21h38 UTC: only PR and SR optical response measurement with two sets of injected lines: 6-75 Hz and 75-320 Hz (snrmir=2e+5, snrdarm=200)
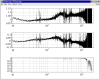
21h54 UTC: CheckHrec with a set of injected lines between 200 and 300 Hz
22h00 UTC: CheckHrec with the standard set of injected lines.

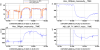
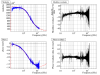
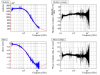
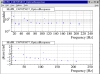
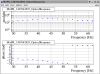
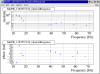
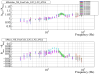
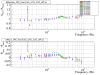
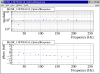
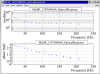
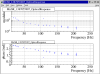
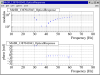
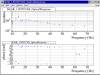
Plot1 shows the BNS range, the pole frequency estimated by Hrec, the optical gain estimated by Hrec and the SR_TY_INPUT values, all along the CAL shift.

Images attached to this report
Comments to this report:
rolland, verkindt - 16:17 Wednesday 20 December 2023 (62801) Print this report

NE, WE optical responses measured during calibration shift of 19 December

Different injections for optical responses were launched in different ITF conditions, two with SR aligned, and two with different SR misalignments. The measurements has been fitted by an optical spring at low frequency and a simple pole. There was no need for a more complex model (as for detuned SR).  The low frequency part (<30 Hz) is not always very well fitted, but the high frequency properly matches a simple pole.

  • Around 15h45: SR aligned, measurements for NE (fig 1) and WE (fig 2)  -> poles fitted around 380 Hz (+/-10)
  • Around 17h55: SR aligned, measurements for NE (fig 3) and WE (fig 4)  -> poles fitted around 380 Hz (+/-10)
  • Around 19h25: SR misaligned 1, measurements for NE (fig 5) and WE (fig 6)  -> poles fitted around 200 Hz (+/-10)
  • Around 21h10: SR misaligned 2, measurements for NE (fig 7) and WE (fig 8)  -> poles fitted around 255 Hz (+/-10)


The following table reports the fitted parameters (optical gain, pole frequency and residual delay), as well as the optical gain and pole computed by Hrec around the same time.

    Fit Fit Fit Hrec Hrec
    gain (1e9) pole (Hz) delay (µs) gain (1e9) pole (Hz)
15h45 NE 1.73 390.9 -11 1.68 380.9
  WE 1.76 372.5 -18 1.70 374.2
17h55 NE 1.71 391.3 -12 1.66 389.3
  WE 1.70 379.6 -18 1.67 385.2
19h25 NE 1.85 197.5 -12 2.11 191.1
  WE 1.83 201.7 -17 2.08 190.0
21h10 NE 1.65 253.1 -12 1.96 242.5
  WE 1.62 255.9 -17 1.96 246.0

The pole frequencies are in agreement between the dedicated fit and the Hrec estimation, within about 10 Hz at maximum. This gives confidence in both methods and estimations.

The gain estimated by Hrec is lower by ~2% than the fit when SR is aligned, but higher by 15% when SR is misaligned. When SR is misaligned, the optical response at low frequency does not match well the fitted model, which may explain some error in the gain estimation?


Images attached to this comment
rolland - 11:35 Thursday 21 December 2023 (62806) Print this report

Optical response of PR measured during calibration shift of 19 December

The first four plots show the "daily-like" measurements at 15h45 (aligned SR), 17h59 (still aligned SR), 19h31 (first misalignment of SR), and 21h16 (second misalignment of SR). The measurements are all a bit different and we do not have enough of them to extract a systematic effect of SR alignment.

The list of injected frequencies is: 17.70 ,   22.70,   27.70,    32.70 ,   47.70 ,   57.70 ,   67.70,   82.70 ,   92.70 ,  107.70 ,  117.70 ,  127.70 ,  142.70 ,  162.70  ,  182.70 ,  207.70 ,  257.70 Hz. 

In the first two plots (SR aligned) they are all visible in the measurement, except for the last one. In the figures 3 and 4 (SR misaligned), there is one point not visible around 30 Hz ( once at 32.7 Hz, once at 27.70 Hz), which may indicate a "notch" (partially confirmed in later measurements).

Difference are more visible on the phase: it seems rather flat above 40 Hz when SR is aligned, and not flat above 40 Hz when SR is misaligned. And  there is also a jump of about pi around 30-40 Hz in the case of SR misaligned, that is not seen when SR is aligned (which also goes in the direction of having a "notch" around 30-40 Hz).

The general shape of the response below 40 Hz is difficult to define from these measurements with only a few lines injected.

In addition to these "standard" injections, some more lines were injected. Here are two more useful measurements:

  • figure 5: at 17h41 (SR aligned): 17 lines between 29 an 62 Hz.
    • 29.70,  31.70, 33.70, 35.70,  37.70,  39.70 , 41.70  ,   43.70  ,   45.70 ,   47.70  ,   49.70 ,   51.70 ,   53.70 ,   55.70 ,   57.70 ,   59.70 ,   61.70   Hz
    • All the injected lines are visible in the measurements.
  • figure 6: at 21h38 (second SR misalignment): 18 lines between 9 and 73 Hz.
    •  9.70 ,   12.70 ,   14.70 ,   16.70,   17.70 ,   20.70  ,   22.70 ,   24.70,   27.70 ,   29.70 ,   32.70  ,   37.70 ,   39.70 ,   43.70 ,   47.70 ,   57.70 ,   67.70 ,   72.70
    • Not all the lines are visible: lines between 20 and 33 Hz are not seen.  It seems that there is some hole (notch?) here in the response, which is difficult to see in the standard calibration with much less lines, except for the one point missing around 30 Hz.

For further studies of the PR optical response, in particular the low frequency part, we should inject the 18 lines between 9 and 73 Hz more regularly.

Images attached to this comment
rolland - 12:22 Friday 22 December 2023 (62821) Print this report

Estimation of h(t) bias on data from December 19th, with SR aligned and misaligned.

In addition to the standard lines injected to estimate the bias of h(t), we have injected some more lines around the "peak" around 250 Hz. The figures 1, 2, 3 and 4 show the bias measured at different times for the different actuators: NE Pcal, WE Pcal, NE electromagnetic actuator and WE EM actuator.   Averaging all the measurements by actuator  gives the figure 5.  Note that the variations at a given frequency are at the level of 1%.

Broad-band noise injections on NE and WE EM actuators, done to measure the optical responses, were also analyzed for the bias, as shown in figures 6, 7, 8 and 9:

  • figures 6 and 7 for NE and WE around 15h47 UTC, with SR aligned
  • figures 8 and 9 for NE and WE around 21h11 UTC, second SR misalignment.

The general shapes do not show up any structure with high bias in small windows which would be missed by the set of lines. However, the shapes seems to vary more than when injecting lines. Further analysis will be needed to investigate this, and compare such measurements to line injections (dedicated or continuous lines) more in details.

Images attached to this comment
rolland - 12:47 Friday 22 December 2023 (62823) Print this report

Optical response of SR measured during calibration shift of 19 December

The first four plots show the "daily-like" measurements around 15h45 (aligned SR), 17h59 (still aligned SR), 19h31 (first misalignment of SR), and 21h16 (second misalignment of SR). There is a notch around 30-40 Hz in the case of aligned SR (given the shape of the TF and the fact that some points around this frequency are not seen),  which is no more present in the two misalignements of SR (the shape is flatter, and all the injected frequencies are recovered).

The list of injected frequencies is: 17.70 ,   22.70,   27.70,    32.70 ,   47.70 ,   57.70 ,   67.70,   82.70 ,   92.70 ,  107.70 ,  117.70 ,  127.70 ,  142.70 ,  162.70  ,  182.70 ,  207.70 ,  257.70 Hz. 

In addition to these "standard" injections, some more lines were injected. Here are two more useful measurements:

  • figure 5: around 17h41 (SR aligned): 17 lines between 29 an 62 Hz.
    • 29.70,  31.70, 33.70, 35.70,  37.70,  39.70 , 41.70  ,   43.70  ,   45.70 ,   47.70  ,   49.70 ,   51.70 ,   53.70 ,   55.70 ,   57.70 ,   59.70 ,   61.70   Hz
    • The line at 37.7 Hz is not visible, being close to the notch, with a phase jump of pi clearly seen.  The modulus at 33.7 Hz is strange, to be remeasured.
  • figure 6: around 21h38 (second SR misalignment): 18 lines between 9 and 73 Hz.
    •  9.70 ,   12.70 ,   14.70 ,   16.70,   17.70 ,   20.70  ,   22.70 ,   24.70,   27.70 ,   29.70 ,   32.70  ,   37.70 ,   39.70 ,   43.70 ,   47.70 ,   57.70 ,   67.70 ,   72.70
    • All the lines are visible, and there is no notch.


Images attached to this comment
mwas, verkindt - 15:30 Friday 22 December 2023 (62827) Print this report

Didier has spotted a ressemblence between the DARM loop impact on B1 noise, and issues with a bump at ~250Hz in the h(t) calibration bias.

Figure 1 show an example of the measured issue. It has a bump at 250Hz, and a more narrow one just below 200Hz, and a less clear one around 500Hz.

Figure 2 shows the 1/(1 - DARM_OLTF) in blue, and the impact of mistuning the DCP by 30Hz when doing the estimation of the DARM_OLTF (red line). Both resemble w /users/mwas/detchar/B1compare_20231221/DARM_OLTF.m

Figure 3 shows the ratio of the red and blue curve, so it shows what happens if one removes the effect of the DARM loop using a model that has not the correct DCP frequency by a few tens of Hz. It looks very similar to what is shown on figure 1.

So the fluctuating bump at ~250Hz in the Hrec accuracy is likely due to a fluctuating error in the DCP estimation in Hrec.

Images attached to this comment
Search Help
×

Warning

Error

The present report has been modified outside this window. Please check for its integrity in the main page.

Refreshing this page will move this report into drafts.

×