We can try to make noise projection of the 6MHz RAM on the sensitivity curve based on these injections.
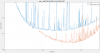
Figure 1 compares the time with the loudest injection (blue) and a calm time after it (purple). B2 PD2 Audio is able to see the injection with a noise elevation by a factor 15 at 200Hz and a factor 30 at 1kHz. In the past the level of noise on B2 was depending on the 6MHz modulation depth, so it should be a good measure of the 6MHz RAM inside the interferometer. Between 60Hz and 200Hz there even coherence between the elevated B2 Audio and h(t).
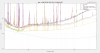
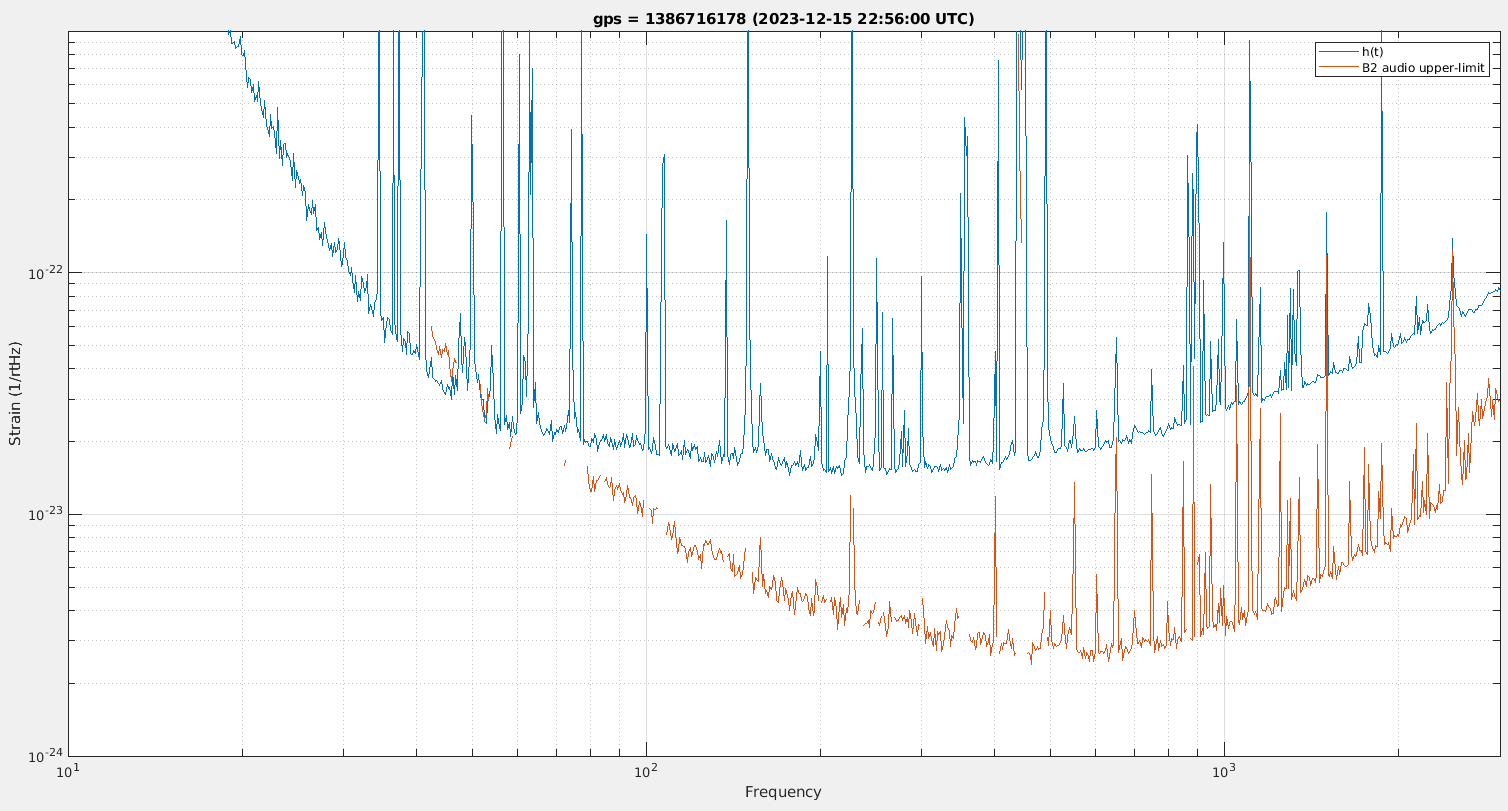
Figure 2 based on B2 one can make a simplistic noise projection on h(t), using a spectral ratio of h(t) and B2 at the injection time as a transfer function, for frequencies where there was an increase in h(t) noise during the noise injection. This is in many ways an upper limit on the noise coupling. At 1kHz this upper limit is almos a factor 10 below h(t), while at 100Hz it is about a factor 2.
/users/mwas/ISC/RAMnoiseProjection_20131215/simpleNoiseProjection.m
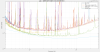
Figure 3 shows that during the noise injection the coupling at ~100Hz can be well explained by frequency noise. Assuming that the SSFS error signal is affected by the 6MHz RAM injection in the same way as the SSFS_Err_Q_unnorm signal. At 1kHz the coupling path seems to be something different than frequency noise, but it is not that interesting to now the physics of it, as the upper limit of the projection in figure 2 is anyway a factor 10 below the sensitivity curve.
SSFS Err Q unnorm increase at ~200Hz only by a factor 4 during the noise injection (compared to a factor 15 for B2 Audio), so at normal times something else than 6MHz RAM is limiting SSFS Err Q (and presumable the SSFS error signal itself). So the 6MHz RAM at normal times should not be a problem limiting the sensitivity, as it should be below the SSFS noise projection.
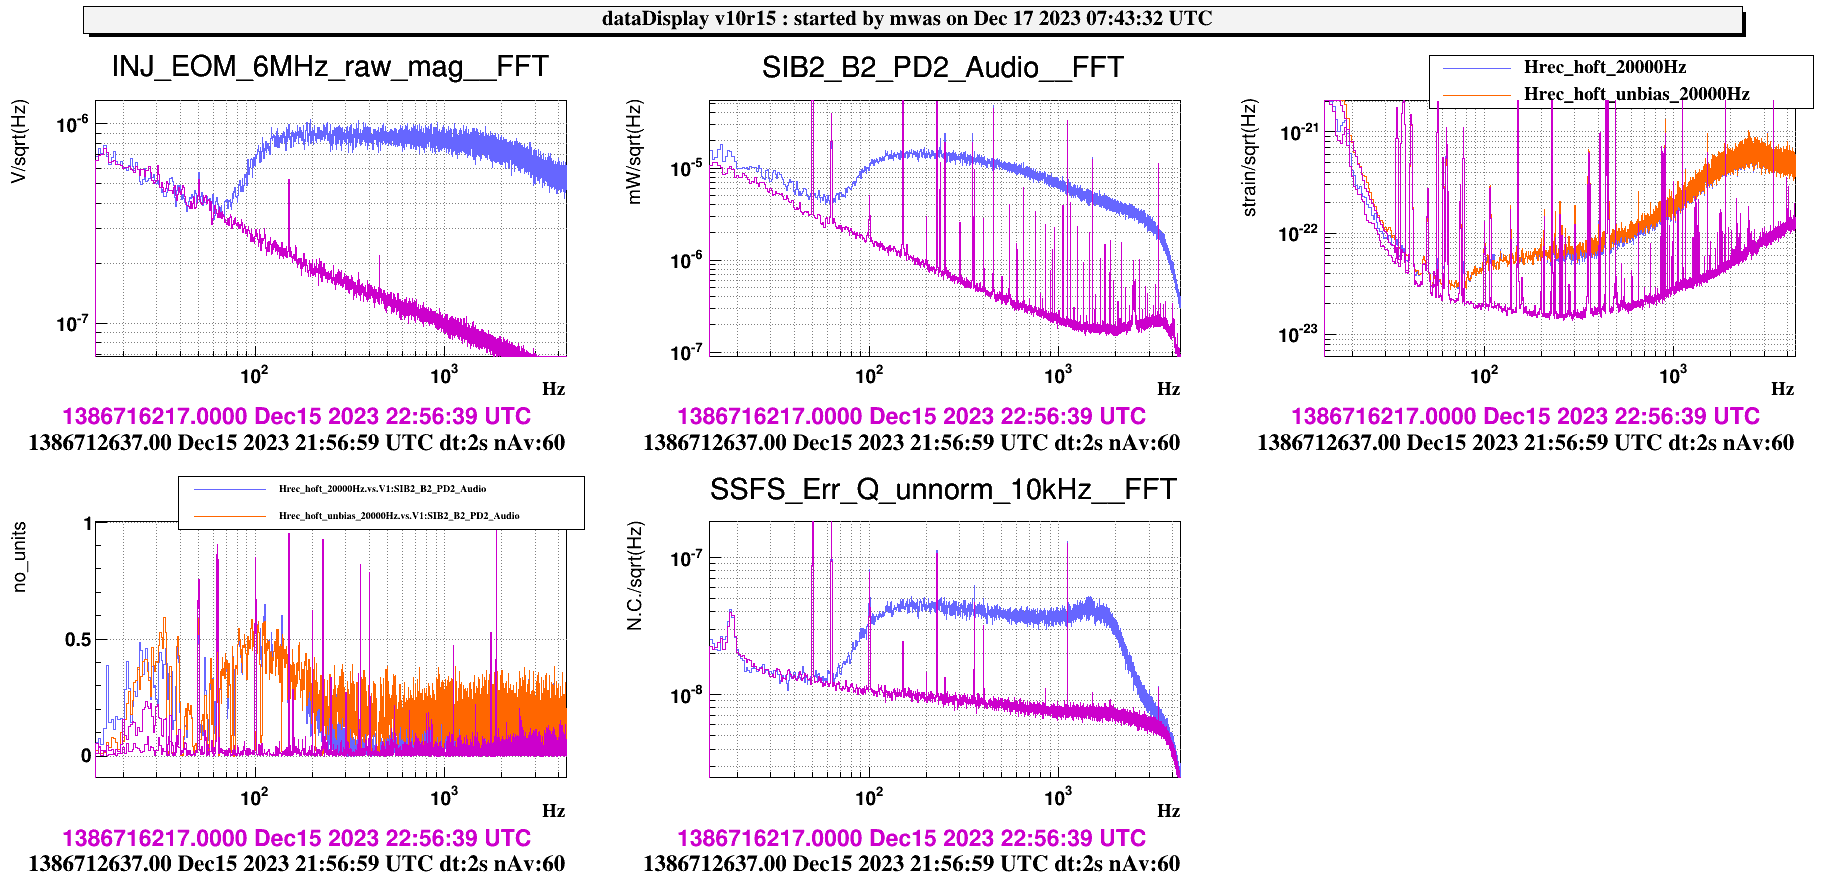
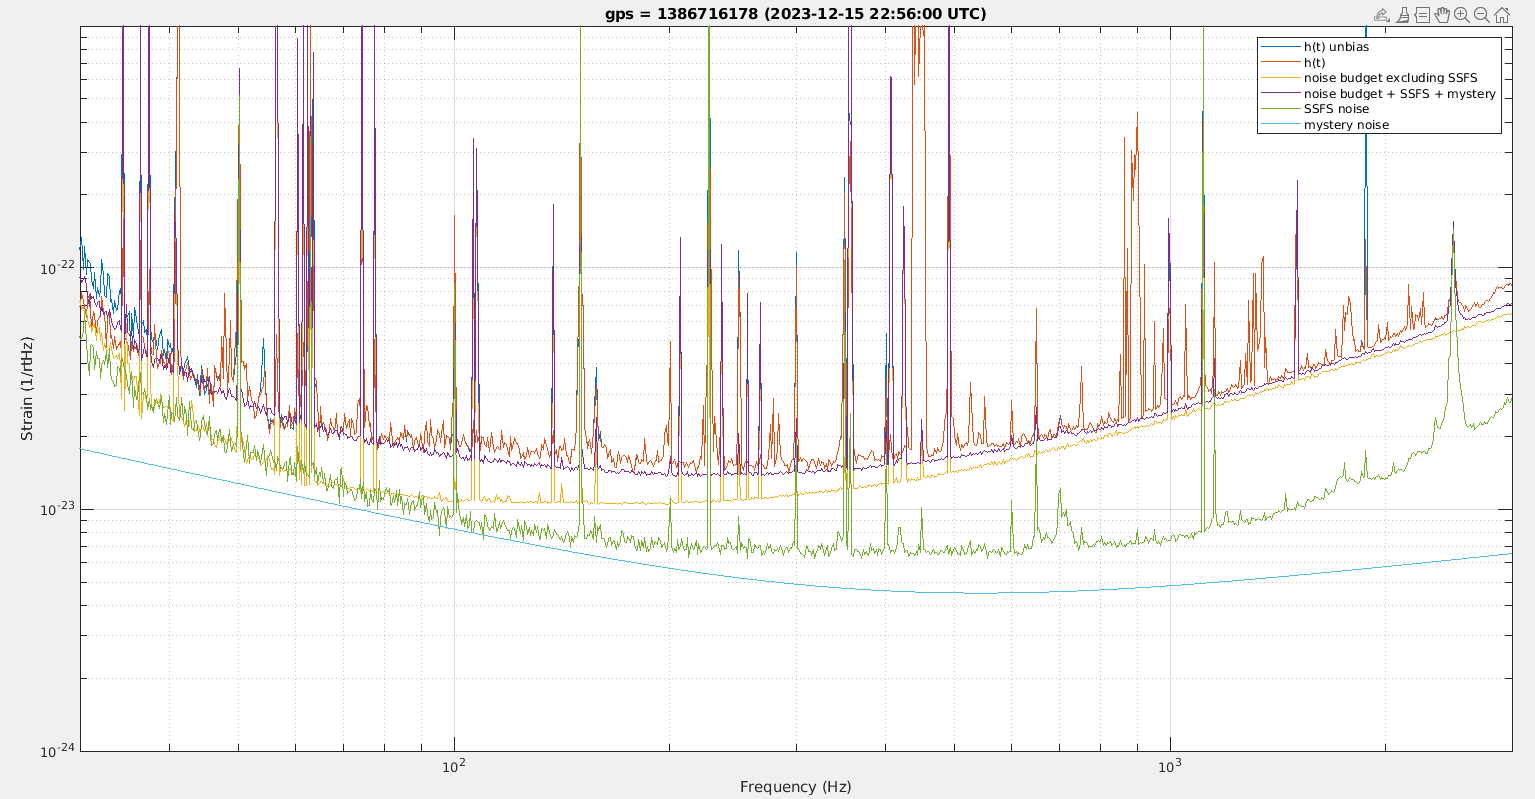
Figure 4 shows the SSFS noise projection during the quite time used in this analysis. And the coupling at that time had a non-zero average value (neither BS nor SR were misaligned to minimize the frequency noise coupling)
