Reports 1-1 of 1 Clear search Modify search
AdV-INJ (Electro optical modulation system (EOM))
nocera - 23:24 Monday 11 December 2023 (62704) Print this report
RAMS Servo --preliminary tests

A. Masserot, F. Nocera, P. Spinicelli

Today we set off on the long journey that will bring one day to the commissioning and use of the RAMS Servo.
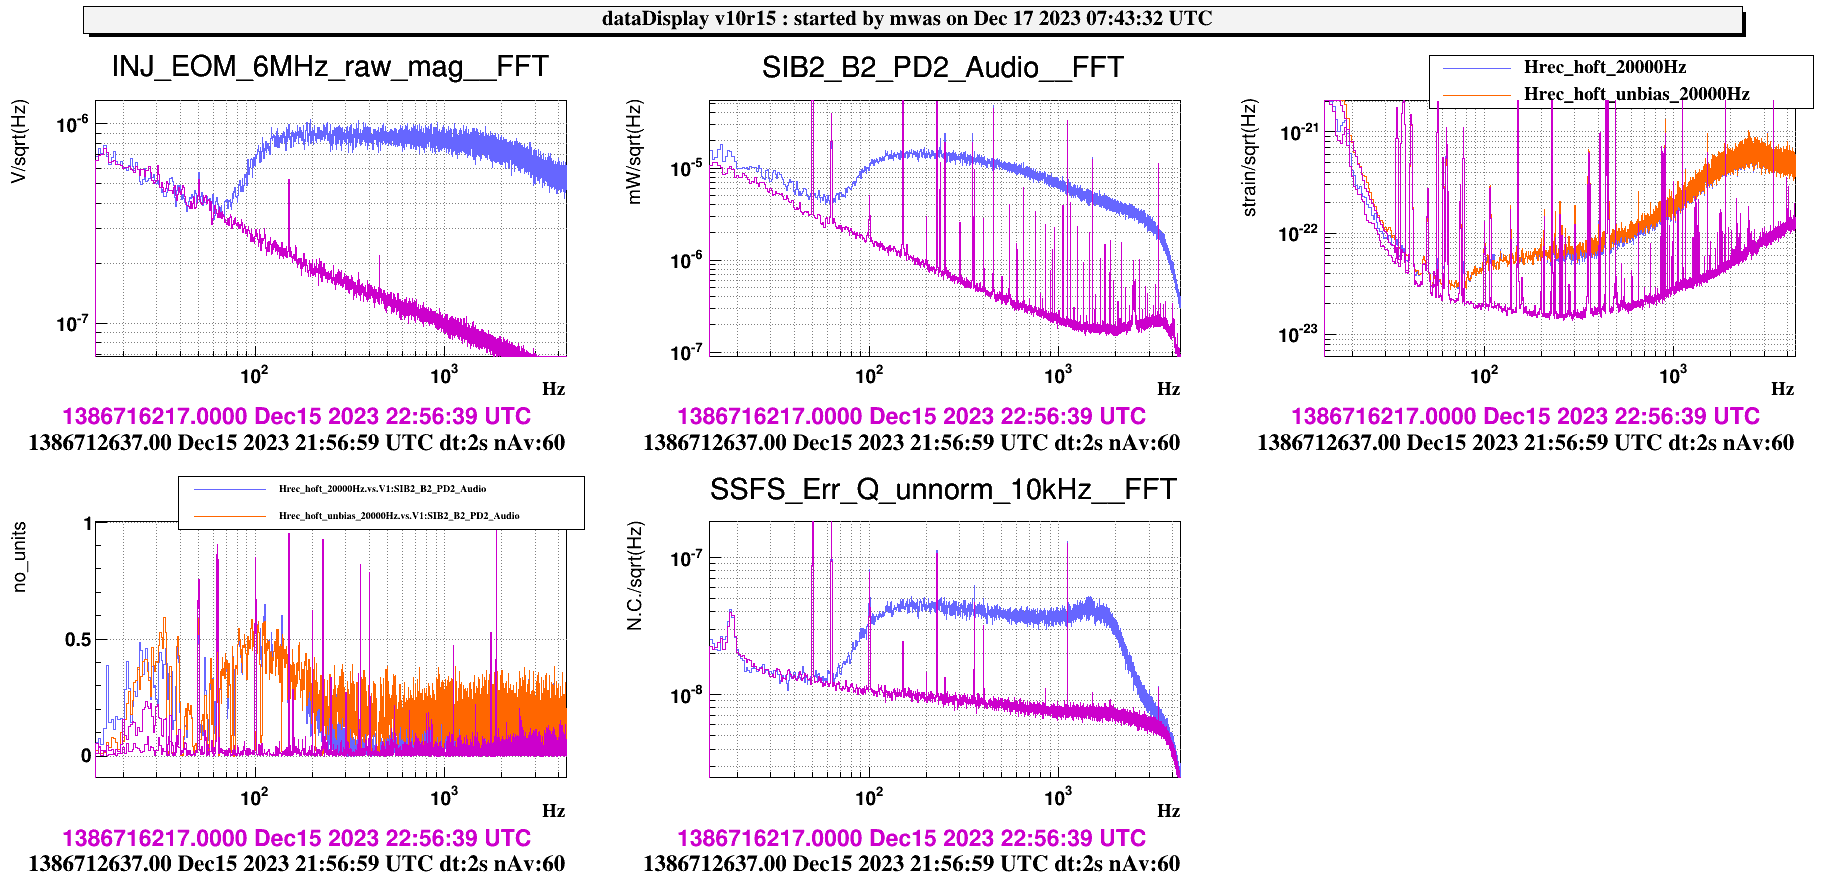
Today's goal was simple enough: verify whether or not it was possible to lock the ITF adding on the signal path the first stage of the (current version of) the RAMS Servo.
Details about the hardware and its characterization are in VIR-1061B-23.
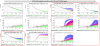
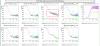
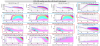
After some initial legwork to have a reference to compare results with and to acquire familiarization with the setup to use (DAC reconfiguration etc., thanks to Alain), some adjustments, and a few mistakes, we finally found a configuration that allowed us to complete the first step, which was the measurement of the phase delay in the new configuration (Mixer Unit in, no BP filter).
Once that was done, we could compensate for it and try to lock the ITF, shortly berfore 20 local time.
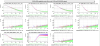
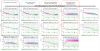
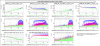
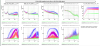
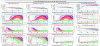
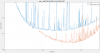
The lock acquisition went smoohly and around 21.20 we reached Low Noise 3 with a good Sensitivity (around 36 Mpc).


At this point we wanted to attempt a first Line injection, but reloading the LNFS_Demod we caused un unlock do to the change in phase of the LNFS (the phaase delayed measured was not saved there)
After this, we started to relock.

Again, then lock acquisition went smooth for the second time.
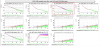
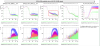
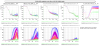
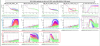
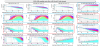
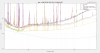
Once in LN3, we started with the line injections. We chose two frequencies where the sensitivity seems quite clean: 121.1Hz and 721.0Hz.
Injection:
21.18.10 UTC @121.1Hz Amp 2e-3V
21.24.05 UTC @121.1Hz Amp 4e-3V
21.27.50 UTC @121.1Hz Amp 1e-2V

The injected line is clearly visible in Hrec.

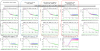
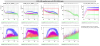
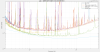
then, we moved to the 721:

21.32.50 UTC @721.0Hz Amp 1e-3V and 121.1Hz OFF
21.35.40 UTC @721.0Hz Amp 0 ==> clean data
21.37.40 UTC @721.0Hz Amp 5e-3V
21.39.50 UTC @721.0Hz Amp 1e-2V
21.43.30 UTC @721.0Hz OFF

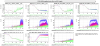
We then wanted to redo the injections with the SR_TY misaligned (i.e. best sensitivity at low frequency) but we unlocked when moving the SR for a human error.

In conclusion, the very first test can be considered successful. Weneed to repeat it misaligning the SR and possibly injecting white noise.
We leave the Mixer unit on the modulation signal path

To be noted: in order to keep a comparable modulation index for the 6MHz, we had to increase the setting on the LNFS up to 13dBm. This setting has been stored in the INJ_MAIN.INI file.

Comments to this report:
masserot - 11:36 Wednesday 13 December 2023 (62723) Print this report

Thank to the available early morning time slot, some amplitude noise injections were made on the EOM_6MHz lines with the ITF locked at LOW_NOISE_3

This plot show the trend and below the detail of these injections:

  • from 2023-12-13-06h37m09-UTC  to 2023-12-13-06h41m37-UTC : injection of the line at 721Hz  with differents amplitudes
  • from 2023-12-13-06h44m04-UTC to 2023-12-13-06h47m10-UTC: White noise 1e-6 - highpass @ 40Hz
  • from 2023-12-13-06h49m38-UTC to 2023-12-13-06h51m20-UTC: White noise 4e-5 - highpass @ 40Hz
  • from 2023-12-13-06h51m20-UTC to 2023-12-13-06h55m01-UTC: White noise 1e-4 - highpass @ 40Hz
  • from 2023-12-13-06h55m01-UTC to 2023-12-13-07h00m43 :White noise 4e-4 - highpass @ 40Hz
  • at 2023-12-13-07h00m43 disable EOM_6MHz amplitude noise injection

The last plots show

Images attached to this comment
Paoletti - 14:36 Wednesday 13 December 2023 (62729) Print this report
Images attached to this comment
mwas - 15:02 Wednesday 13 December 2023 (62728) Print this report

From past test of changing the modulation depth of the sidebands we know that B2 and B4 are dominated by the 6MHz sideband RAM.

Figure 1 shows that both B2 and B4 have their spectrum increased when there is a large amount of noise (blue curve) added into the 6MHz mixer. I don't understand why the amount of noise decreases when a small amount of noise is added into the RAM (red curve).

Figure 2 shows that B2 is couplied linearly with the 6MHz RAM, as when there is a large noise injection, B2 increase and is very coherent with the noise injection.

This could be a poor man's alternative to the proper RAMS servo. By feeding back B2 audio signal into the LNFS RAM DAC input. The filter would need to be a zero at ~500Hz (to compensate for the pole in the IMC transmission), and maybe some attempt at compensating the delay. For sure it would work only up to only a few hundred Hz at most, due to the delay.

Figure 3 shows the time when a loud line at 721Hz was added into the RAM. It does have sidebands, and these sidebans are exactly the same as the ones around the SSFS line at 3345Hz. These sidebands are due to fluctuations of the frequency noise coupling to DARM. So the RAM injection pollutes the SSFS error signal which is based on the 6MHz sideband, the SSFS loop impresses the 721Hz line onto the laser frequency, which then couples in a fluctuating way to DARM.

Images attached to this comment
masserot - 23:02 Thursday 14 December 2023 (62744) Print this report

An amplitude white noise has been injected on  the 6MHz's EOM driving part located between the LNFS's generation and the EOM's readout.

In the following plots, the color codes are:

  • green :  white noise 1e-6, high-passed @40Hz , starting time  2023-12-13-06h45m-UTC - duration 60s
  • red: white noise 4e-5, high-passed @40Hz , starting time  2023-12-13-06h50m-UTC - duration 60s
  • purple: white noise 1e-4, high-passed @40Hz , starting time  2023-12-13-06h53m-UTC - duration 60s
  • blue: white noise 4e-4, high-passed @40Hz , starting time  2023-12-13-06h57m-UTC - duration 60s


LNFS and EOM signals

The following plots show the normalized amplitude at 1V and the normalized phase at 10MHz of the  LNFS and EOM signals

  • the 6MHz  modulation frequency : when the amplitude noise increase (red rectangle)
    • an amplitude noise appeared on the EOM 6MHz readout part above 30-40Hz
    • idem for the phase noise between the LNFS and EOM
  • the 8MHz modulation frequency : none modification
  • the 56MHz modulation frequency :
    • there is major modification except a small increase of the amplitude noise for the frequency below 30-40Hz (red rectangle)


MICH and SRCL - B4_PD1 at 56MHz

Today for B4_PD1 at 56MHz, the mitigation of demodulation  noises is performed using the  B4_PD1_50MHz's magnitude and phase channels.

This plot ( zoom ) show the B4_PD1 photodiode demodulated 56MHz magnitude and phase channel according the readout stage

  • at the output of the demodulation board (black rectangle):  B4_PD1_56MHz_raw_ool_{mag,phi}
  • after the 56MHz LNFS rotation (blue rectangle): B4_PD1_56MHz_std_ool_{mag,phi}
  • after the phase noise mitigation with the B4_PD1_50MHz phase signal (orange rectangle): B4_PD1_56MHz_pnr_ool_{mag,phi}
  • after the amplitude noise mitigation with the B4_PD1_50MHz amplitude signal (red rectangle):  B4_PD1_56MHz_anr_ool_{mag,phi}
  • One can see that
    • as the demodulation noises mitigation is done using the B4_PD1_50MHz, on the B4_PD1_56MHz_ {I, Q} channels appears the noise injected on the EOM 6MHz line (see the coherency on this plot and its zoom )
    • to be noted
      • the small increase of the 56MHz  amplitude noise in the 10Hz-40Hz frequency region on all the magnitude channels before the  amplitude noise mitigation (red rectangle in the last plots)
      • that there is no coherency between the B4_PD1_50MHz  and the EOM_6MHz injected noise
  • So using the B4_50MHz signals, 56MHz - 6MHz, to perform the demodulation noises mitigation, this introduces the injected EOM_6MHz amplitude noise in the MICH and SRCL control signals


SSFS - B4_PD2 at 6MHz

Today for the SSFS signals only the mitigation of demodulation phase noise is performed using the same error signal as for MICH and SRCL : B4_PD1_50MHz_phi.

While for  B4_PD2 at 6MHz, the demodulation phase noise mitigation is performed using B4_PD2_112MHz

This plot and its zoom show the SSFS_Err_{I,Q} and its out-loop ones B4_PD2_6MHz_{I,Q}_ool  signals. The injected EOM_6MHz amplitude noise seem splitted

  • on the SSFS_Err_Q channel  for the  40Hz-1KHz frequency band
  • and on the SSFS_Err_I channel for the frequencies above 1KHz


PRCL - B2_PD2 at  6MHz

Today for B2_PD2 at 6MHz, the mitigation of demodulation  noises is performed using  the  B2_PD2_50MHz's magnitude and phase channels.

This plot and its zoom show 

  • the signals at the demodulation board output:  B2_PD2_6MHz_raw_{mag,phi}
  • the signals after the LNSF 56MHz rotation and the demodulation noises mitigation: B2_PD2_6MHz_{mag,phi}
  • the signals used to perform the the demodulation noises mitigation : B2_PD2_50MHz_{mag,phi}
  • one can see that
    • the amplitude noise correction allows to clean the B2_PD2_6MHz_raw_mag channel  for the frequencies below 1KHz,.
    • There is none improvments for the B2_PD2_6MHz_raw_phi channel 

This plot and its zoom show the coherency between the B2_PD2_6MHz_{I,Q} channels and the EOM_6MHz injected amplitude noise

  • there is no coherency between the B2_PD2_50MHz(B2_PD2_6MHz_phase_noise_corr)  and the EOM_6MHz injected noise
Images attached to this comment
masserot, tournefier, mwas - 12:41 Friday 15 December 2023 (62749) Print this report

On Michal's suggestions,  the coherency  between the EOM_6MHz RAM injected noise and the B4 and B2 Audio channels has been looked

B4_PD2_Audio and 12MHz, 50MHz and 112MHz  magnitudes channels

This plot and its zoom show the B4_PD2 Audio channels and the 12MHz, 50MHz and 112MHz amplitude channels :

  • The noise increases in the 10Hz-40Hz frequency band on the Audio, 50MHz and 112MHz   channels but not on the 6MHz one
  • The blue rectangle refers to the coherency between the injected noise (INJ_LNFS_6MHz_RAMS_dac) and the amplitude channels extracted at 12MHz, 50MHz and 112MHz
    • there is coherency with the injected noise only for the  Audio,12MHz,50MHz (56MHz - 6MHz) channels  and the coherency increases with the injected noise level
    • there is a none coherency between  the injected noise and the 112MHz channel 
  • the purple rectangle refers to the coherency between the 12MHz, 50MHz and 112MHz amplitude channels
    • there is none coherency between the 12MHz and the 112MHz amplitude channels
    • there is coherency between the 112MHz and the 50MHz  amplitude channels only for the frequency below 50Hz
    • there is coherency between the 12MHz and the 50MHz amplitude channels only on the frequency band related to the injected noise on the 6MHz's modulation path
  • the red rectangle refers to the coherency  between the Audio channel and the 12MHz, 50MHz and 112MHz amplitude channels
    • there is coherency between the Audio channel and the 12MHz amplitude channel on the frequency band related to the injected noise on the 6MHz modulation's path
    • there is coherency between the Audio channel and the 112MHz amplitude channel only for the frequency below 50Hz and this coherency increase with the injected noise level
    • as the 50MHz  is the mixing of the 56MHz and the 6MHz, the coherency increases with the injected noise level  in the 10Hz-5KHz frequency band

B2_PD2_Audio and 4MHz, 50MHz and 112MHz  magnitudes channels

This plot and its zoom show the B2_PD2 audio channels and the 4MHz, 50MHz and 112MHz amplitude channels :

  • the color rectangles refers to the same coherency plots as B2_PD2
  • same observations as for B4_PD2 photodiode


B2_Audio, B4_Audio and B5_Audio channels and the INJ_EOM 6MHz and 56MHz ampliude ones

This plot at its zoom show  the B2_Audio, B4_Audio and B5_Audio channels and the INJ_EOM 6MHz and 56MHz ampliude channels

  • blue rectangle: coherency between the injected noise (INJ_LNFS_6MHz_RAMS_dac) and the Audio channels for B2, B4 and B5 beams
    • there is coherency with the injected noise and all the B2, B4 and B2 Audio channels and the coherency increases with the injected noise level
  • purple rectangle: coherency between  the B2, B4 and B5 Audio channels
    • even without injected noise on the EOM 6MHz , there is coherency between these channels
    • With EOM 6MHz injected noise, the coherency increases for the 10Hz-5KHz frequency band
  • red rectangle: coherency between the EOM 56MHz monitoring channel (INJ_EOM_56MHz_mag ) and the Audio channels for B2, B4 and B5 beams
    • there is coherency in the 10Hz-40Hz frequency band and the coherency increases with the injected noise level .


According to these measures , there is a non-linear coupling between the EOM 6MHz driving line and the  EOM 56MHz one

  • we injects  a noise above 40Hz on the EOM 6MHz driving line
  • and we see a noise on all 56MHz signals and on the EOM 56MHz monitoring channels for the frequency below 40Hz
Images attached to this comment
gosselin, masserot - 1:00 Saturday 16 December 2023 (62754) Print this report

Below the detail of the new EOM 6MHz amplitude noise injections performed with the ITF locked at LOW_NOISE_3 ( plot )

High-pass filter  4th order  at 40Hz - white noise injection

  • 2023-12-15-21h02m21-UTC: white noise level at 1e-5 - high-pass @40Hz - 5mn 
  • 2023-12-15-21h07m26-UTC: white noise level at 4e-5 - high-pass @40Hz - 5mn
  • 2023-12-15-21h12m28-UTC:  white noise level at 1e-4 - high-pass @40Hz - 5mn
  • 2023-12-15-21h17m30-UTC: white noise level at 2e-4 - high-pass @40Hz - 3mn
  • 2023-12-15-21h20m31-UTC: white noise level at 4e-4 - high-pass @40Hz - 5mn
  • 2023-12-15-21h25m36-UTC:  Disable noise injections - 5mn

This plot at its zoom show  the B2_Audio, B4_Audio and B5_Audio channels and the INJ_EOM 6MHz and 56MHz ampliude channels for this test

  • blue rectangle: coherency between the injected noise (INJ_LNFS_6MHz_RAMS_dac) and the Audio channels for B2, B4 and B5 beams
  • purple rectangle: coherency between  the B2, B4 and B5 Audio channels : idem
  • red rectangle: coherency between the EOM 56MHz monitoring channel (INJ_EOM_56MHz_mag ) and the Audio channels for B2, B4 and B5 beams
    • there is coherency in the 10Hz-40Hz frequency band but the coherency remains at the same level independently of  the injected noise level : the contrary of the previous measures

High-pass filter  4th order  at 100Hz - white noise injection

  • 2023-12-15-21h30m30-UTC: white noise level at 1e-5 - high-pass @100Hz
  • 2023-12-15-21h35m31-UTC: white noise level at 4e-5 - high-pass @100Hz
  • 2023-12-15-21h40m31-UTC: white noise level at 1e-4 - high-pass @100Hz
  • 2023-12-15-21h45m31-UTC: white noise level at 2e-4 - high-pass @100Hz
  • 2023-12-15-21h50m34-UTC: white noise level at 4e-4 - high-pass @100Hz
  • 2023-12-15-21h55m35-UTC: white noise level at 8e-4 - high-pass @100Hz
  • 2023-12-15-22h00m03-UTC:  Disable noise injections

This plot at its zoom show  the B2_Audio, B4_Audio and B5_Audio channels and the INJ_EOM 6MHz and 56MHz ampliude channels  for this test

  • blue and purple rectangles: same observations 
  • red rectangle: coherency between the EOM 56MHz monitoring channel (INJ_EOM_56MHz_mag ) and the Audio channels for B2, B4 and B5 beams
    • the INJ_EOM_56MHz_mag ASD values changes  independently of  the injected noise level
    • there is coherency in the 10Hz-40Hz frequency band, but the coherency changes  independently of  the injected noise level too as expected by Matthieu

After some investiagtions we found that the EOM_56MHz_mag channel became noisy since the 2023-12-03 (see this plot ) :

  • the origin of this noise increase remains to be investigated
  • A flag has been added on the LNFS's DMS
Images attached to this comment
mwas - 10:33 Sunday 17 December 2023 (62767) Print this report

We can try to make noise projection of the 6MHz RAM on the sensitivity curve based on these injections.

Figure 1 compares the time with the loudest injection (blue) and a calm time after it (purple). B2 PD2 Audio is able to see the injection with a noise elevation by a factor 15 at 200Hz and a factor 30 at 1kHz. In the past the level of noise on B2 was depending on the 6MHz modulation depth, so it should be a good measure of the 6MHz RAM inside the interferometer. Between 60Hz and 200Hz there even coherence between the elevated B2 Audio and h(t).

Figure 2 based on B2 one can make a simplistic noise projection on h(t), using a spectral ratio of h(t) and B2 at the injection time as a transfer function, for frequencies where there was an increase in h(t) noise during the noise injection. This is in many ways an upper limit on the noise coupling. At 1kHz this upper limit is almos a factor 10 below h(t), while at 100Hz it is about a factor 2.

/users/mwas/ISC/RAMnoiseProjection_20131215/simpleNoiseProjection.m

Figure 3 shows that during the noise injection the coupling at ~100Hz can be well explained by frequency noise. Assuming that the SSFS error signal is affected by the 6MHz RAM injection in the same way as the SSFS_Err_Q_unnorm signal. At 1kHz the coupling path seems to be something different than frequency noise, but it is not that interesting to now the physics of it, as the upper limit of the projection in figure 2 is anyway a factor 10 below the sensitivity curve.

SSFS Err Q unnorm increase at ~200Hz only by a factor 4 during the noise injection (compared to a factor 15 for B2 Audio), so at normal times something else than 6MHz RAM is limiting SSFS Err Q (and presumable the SSFS error signal itself). So the 6MHz RAM at normal times should not be a problem limiting the sensitivity, as it should be below the SSFS noise projection.

Figure 4 shows the SSFS noise projection during the quite time used in this analysis. And the coupling at that time had a non-zero average value (neither BS nor SR were misaligned to minimize the frequency noise coupling)


Images attached to this comment
mwas - 17:54 Tuesday 19 December 2023 (62790) Print this report

A question is if the assumption of linearity is valid for these noise projections that are not coherent.

Figure 1 shows two noise injections that have a level different by a factor 2.

Figure 2 shows the corresponding transfer function measured from the spectral ratio. The two agree with each, the louder injection has a measurement over a wider frequency noise. The louder injection has a transfer function that is higher at higher frequency, so the couping might be slightly non linear, which would mean that the derived upper limit is more of an over estimate at high frequency, as the injection itself is part of the RMS that creates the coupling.

Images attached to this comment
Search Help
×

Warning

×