We had a deeper look to the tappings in SDB1 area we did last Saturday, we also attempted a rough projection.
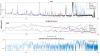
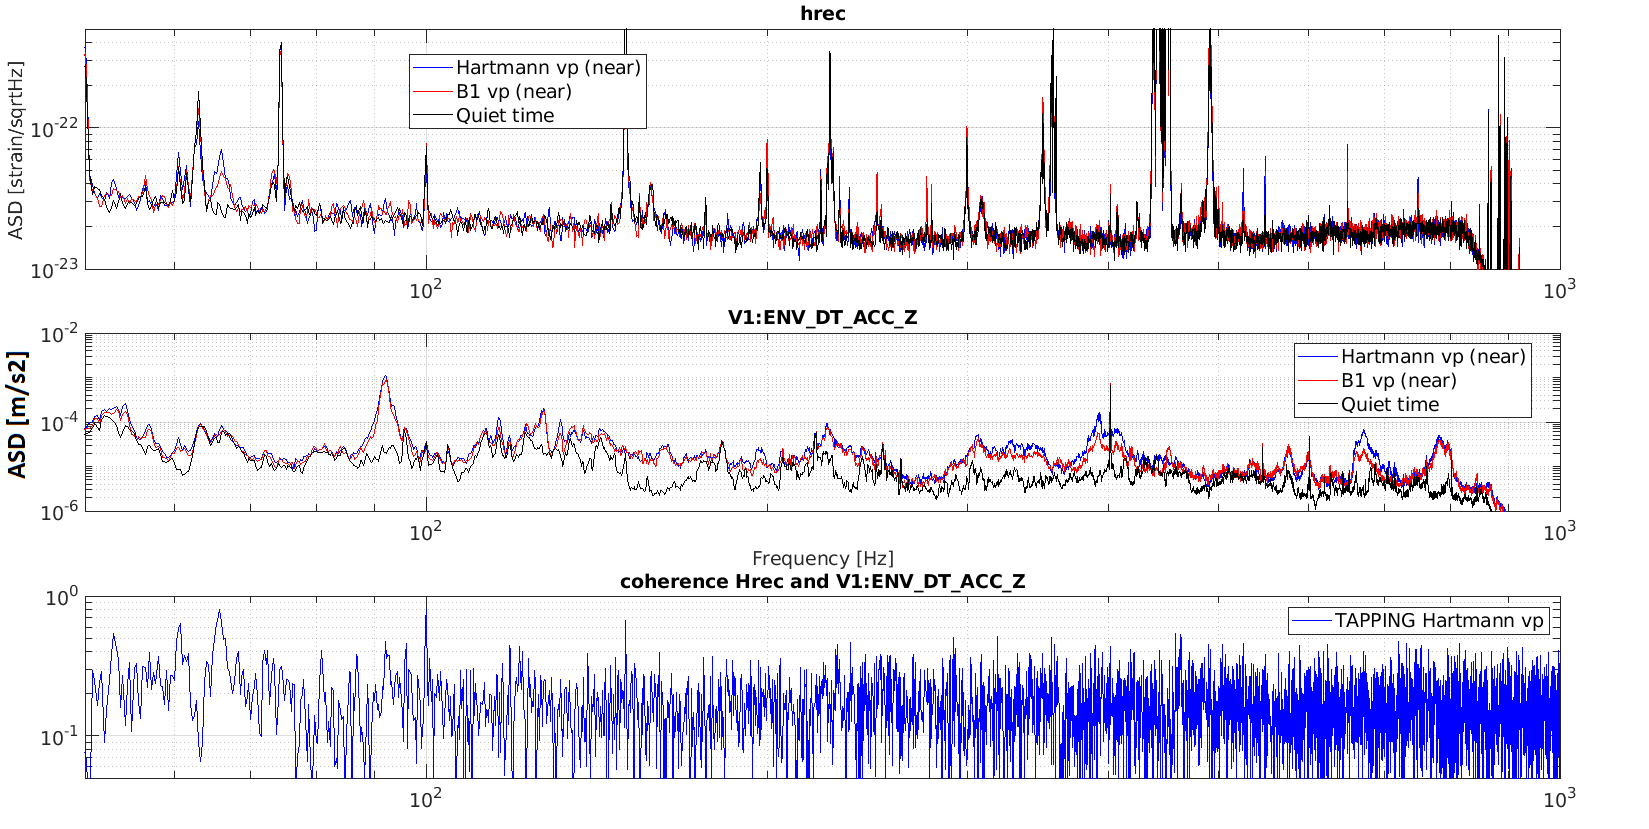
Figure 1 shows tappings in correspondence of the B1 and Hartmann viewports which (as shown in the drawing attached to the mother entry) are located at the rectangular flange of SDB2. We did not put an accelerometer on this flange so what is shown in Figure 1 (middle) is the accelerometer on SDB1 flange on the opposite side of the minilinks, this accelerometer sees very little, meaning that the minilink pipes do not transmit much vibration. The hrec spectrum (the top plot) shows a small excitation at about 66Hz. This is similar for both B1 and the Harthmann beam minilink, which is not surprising since they are quite rigidly connected through the rectangular flange and when tapping one we excite the other in a similar way. The 66 Hz peak resemble a similar peak that we measured during the shaking of the minilink we performed in O3. and that we excited when shaking the B1 pipe or the rectangular flange. Not having accelerometer data of SDB2 we cannot manage a projection. We shall repeat this measurement with an accelerometer on the rectangular flange, and performing also a tapping/shaking of B1 minilink pipe, as a check. However the impression is that a projection wouldn't show any criticality: the excited peak is not very large, also no peak at this frequency is present in the sensitivity.
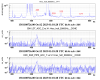
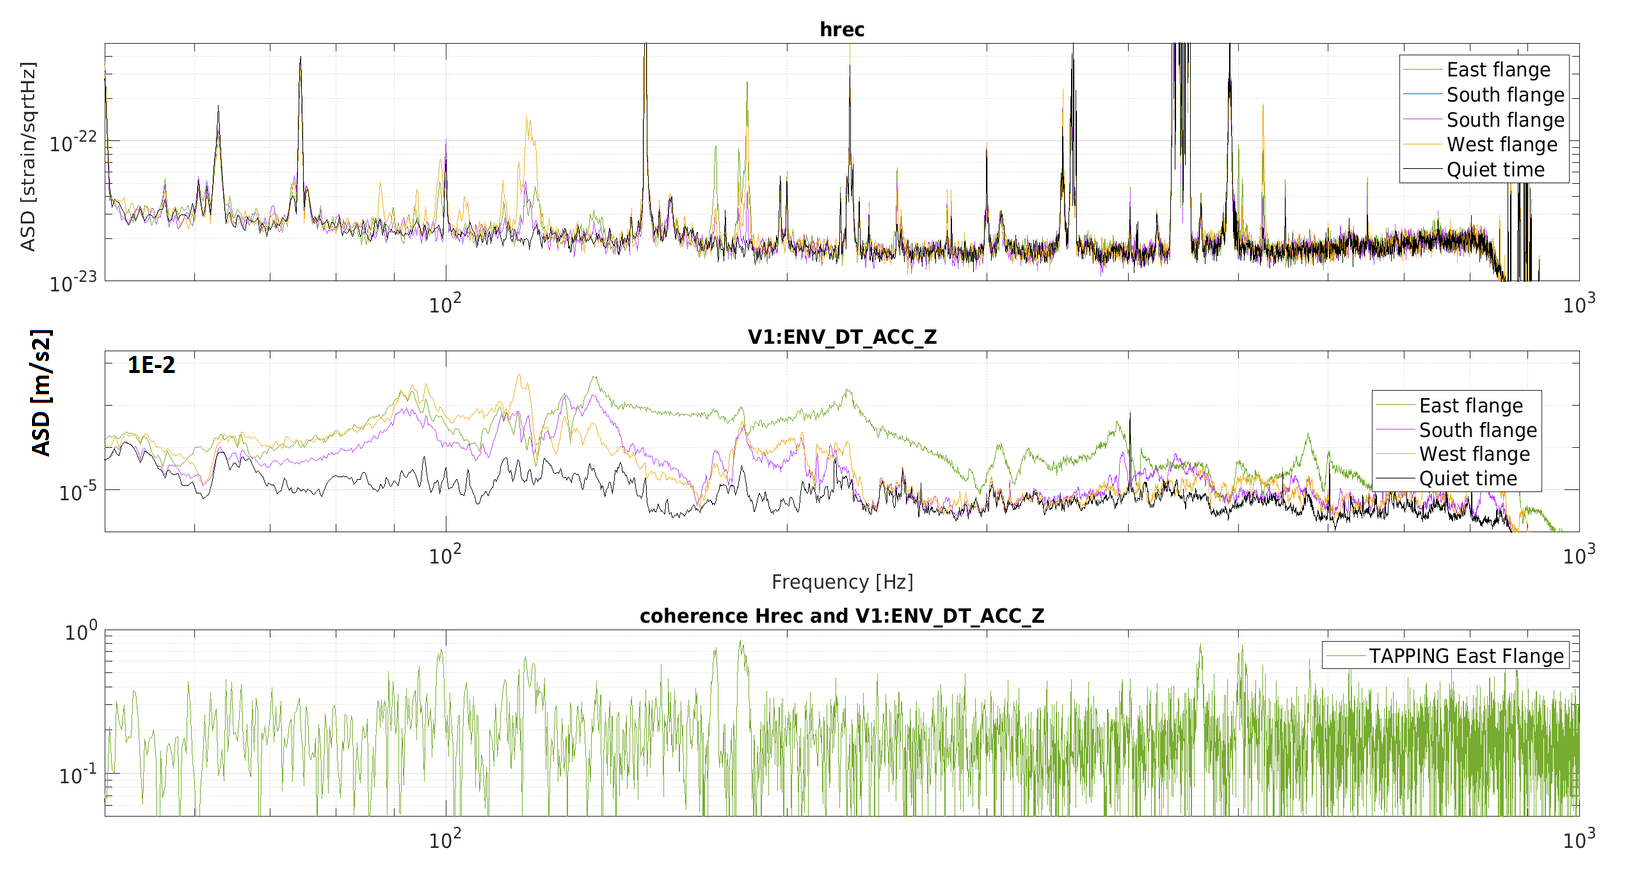
Figure 2 shows tappings performed on three out of the four big flanges of the SDB1 chamber: the WEST, the SOUTH and the EAST flange (the East flange is were the minilinks are attached). The tapping on the South flange did not produce a large effect, while tapping on the West and East flanges excited some peaks in Hrec ( a table with all the peaks excited with and indication of their intensity is reported in Figure 7). A peak at 118.5 Hz and a bunch of other peaks between 87.5 and 112.75 Hz were more effectively excited when tapping from the West flange. The other peaks excited when tapping the SDB1 flanges are discussed below.
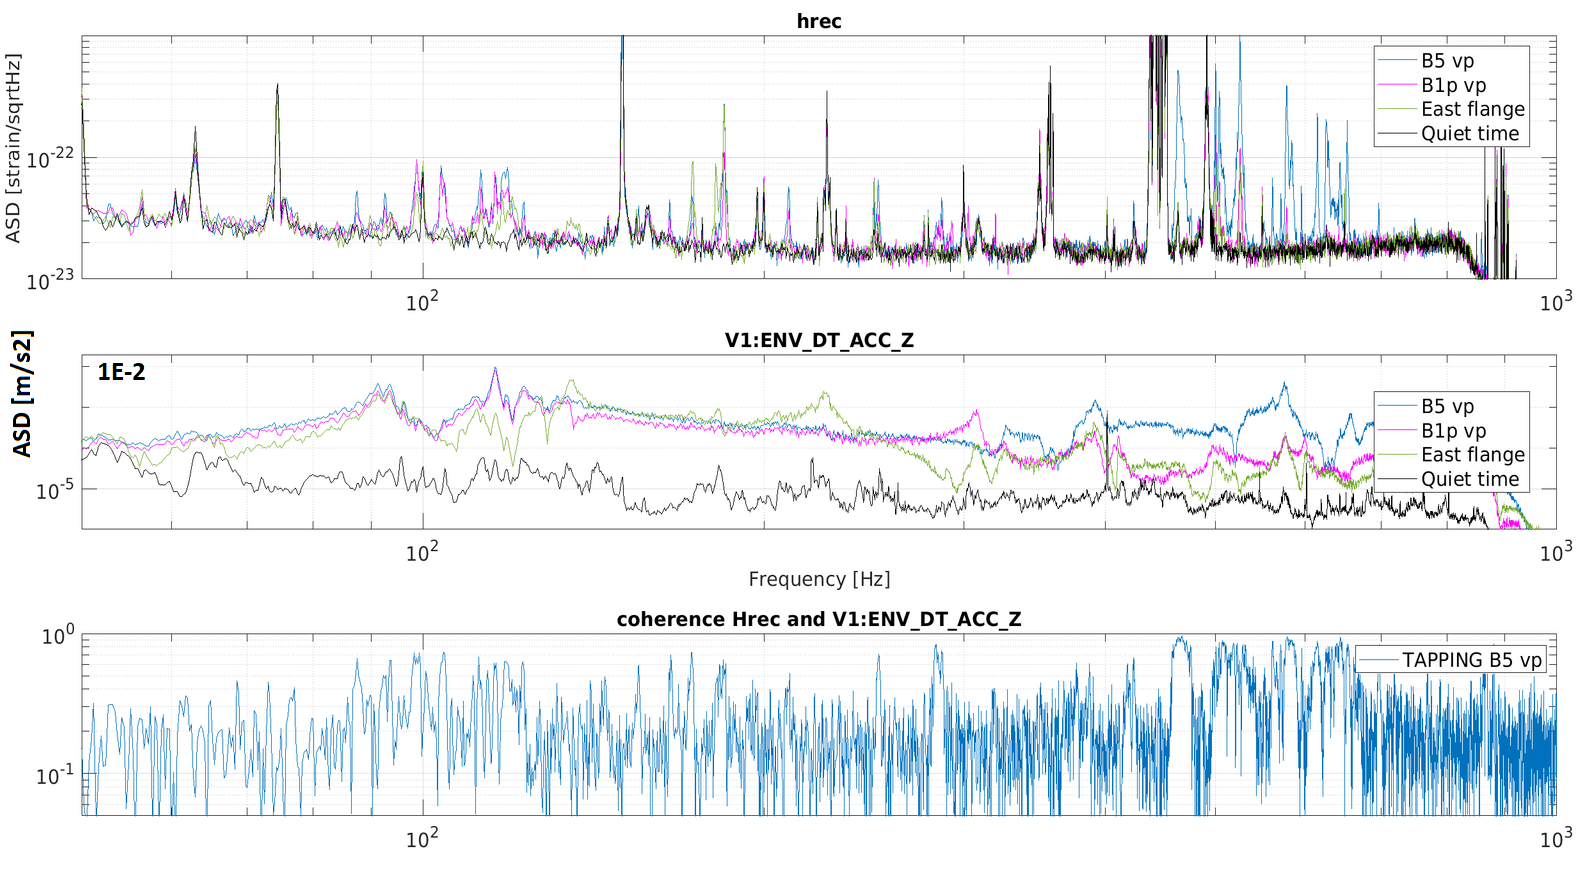
Figure 3 shows and compares the effect in Hrec when tapping the SDB1 East flange and the flanges were the B1p and the B5 viewports are located (see again the drawing). Several peaks are excited between 87.5 and 653 Hz (see Table in Figure 7). Most (all) have a good coherence with the accelerometer on SDB1 East flange. In particular, the 118.5 Hz peak matches what seems a resonat mechanical mode of the flange.
Figure 3 shows that when we tapped the B5 viewport peaks in the region 400-650Hz were largely excited. This could be the indication that some coupling (scattered light?) is occurring in this location. But ooking at the accelerometer we learn that indeed we excited more vibration of the whole flange at this higher frequency. Therefore we cannot exclude that the coupling is instead somewere else on the flange or the SDB1 chamber wall.
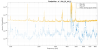
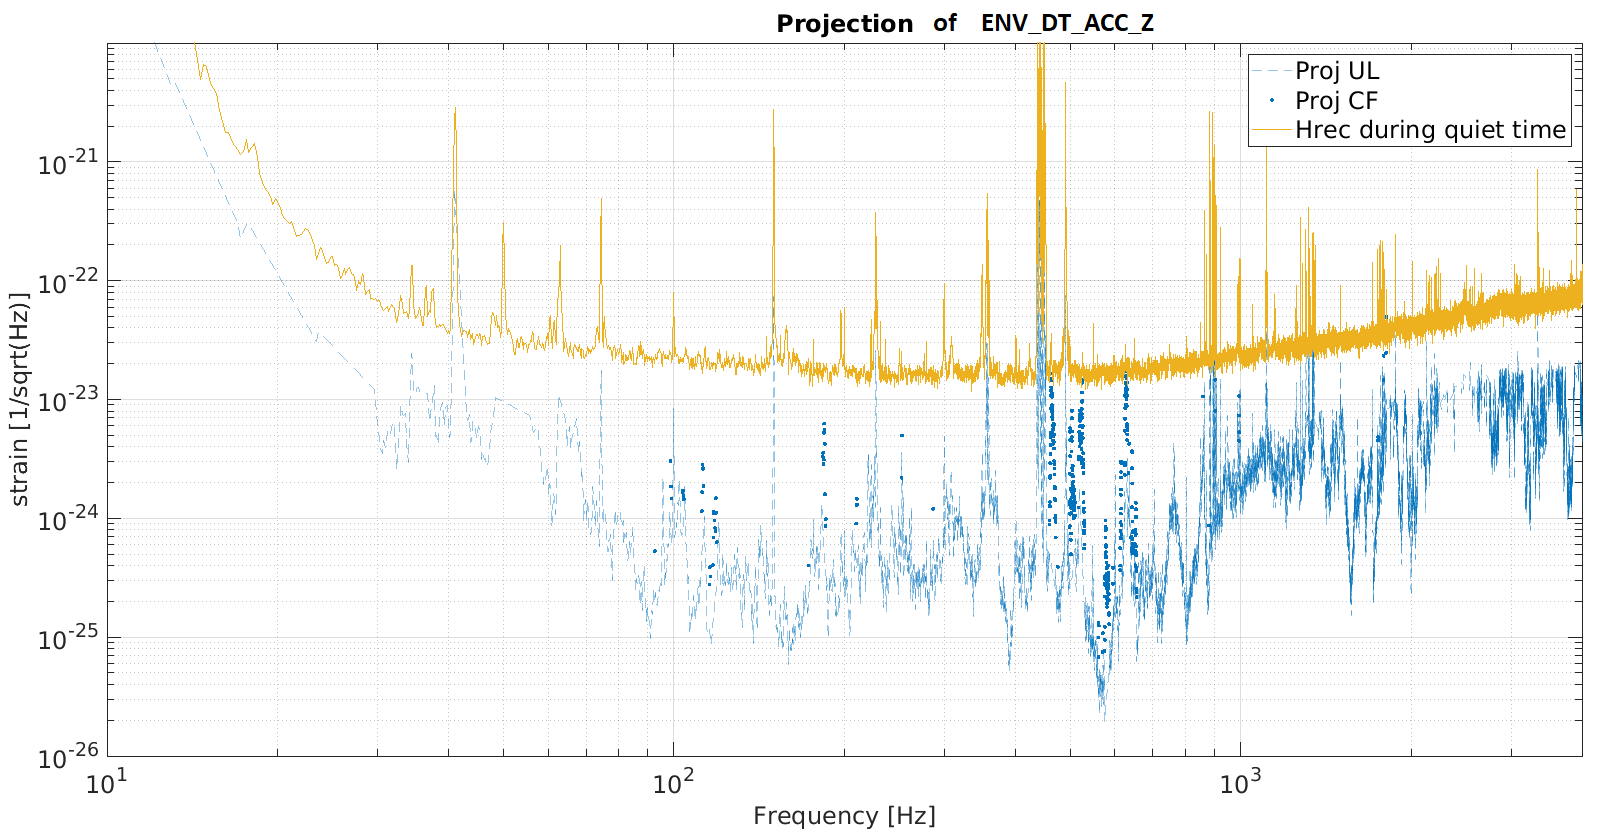
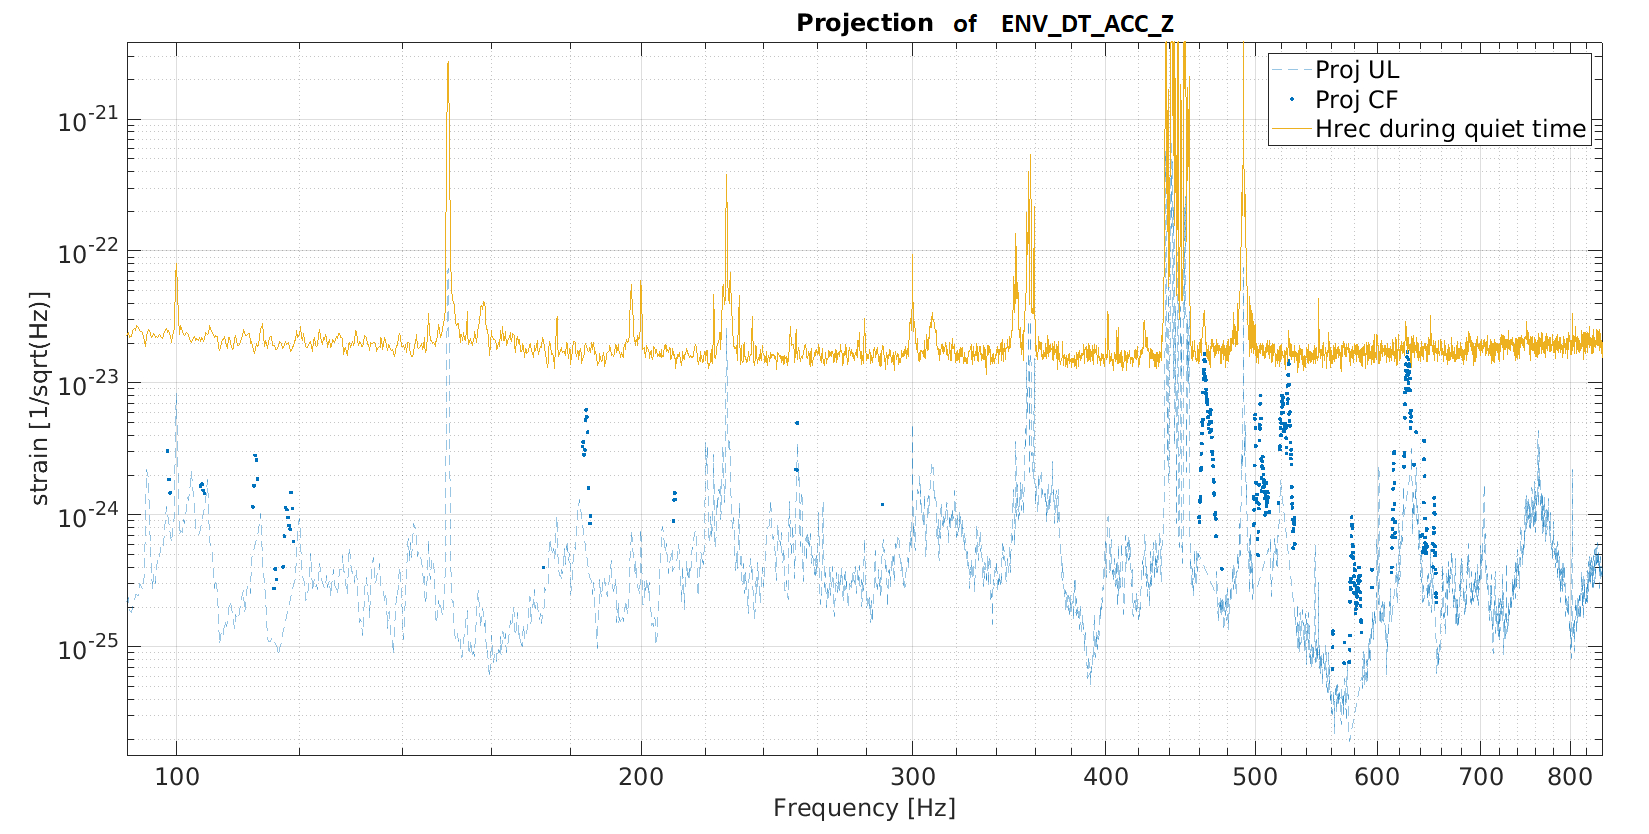
In Figure 4 we attempted a linear projection of the quiet vibration spectrum of the east flange accelerometer onto Hrec (we used the code that Alba Romero developed for the acoustic injection). The projection is rough but looks reasonable: it seems to predict the little peaks in the sensitivity at 463, 503, 525 Hz. Figure 5 shows a zoom of the projected noise in this range. Figure 6 shows that in quiet condition there is indeed some coherence between hrec and the accelerometer at these frequencies.
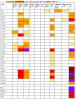
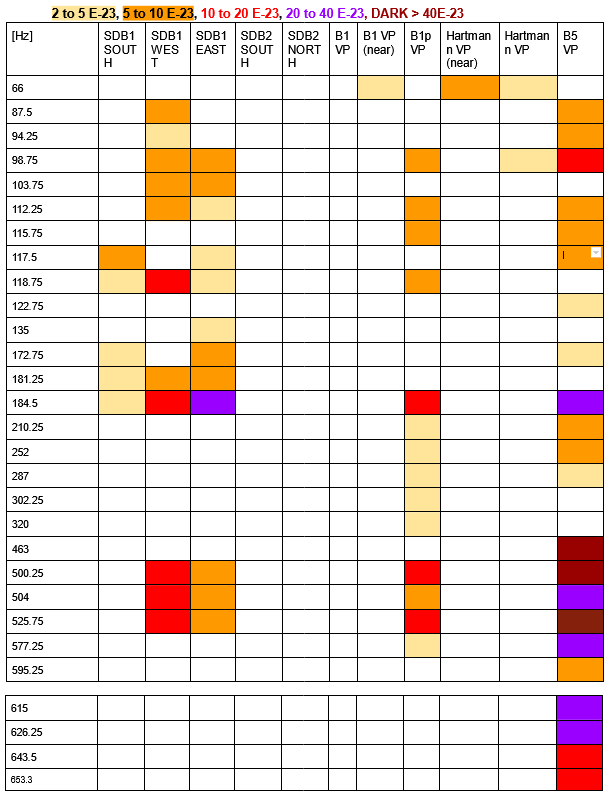
Figure 7 lists the frequency of all peaks we excited in hrec and theier amplitude. Some of these peaks were also excited during acoustic and magnetic injections.


