Reports 1-1 of 1 Clear search Modify search
Environmental Monitoring (Environmental Monitoring)
fiori, paoletti, tringali - 22:29 Saturday 10 December 2022 (58074) Print this report
Correlated low frequency magnetic noise sitewide

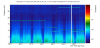
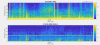
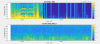
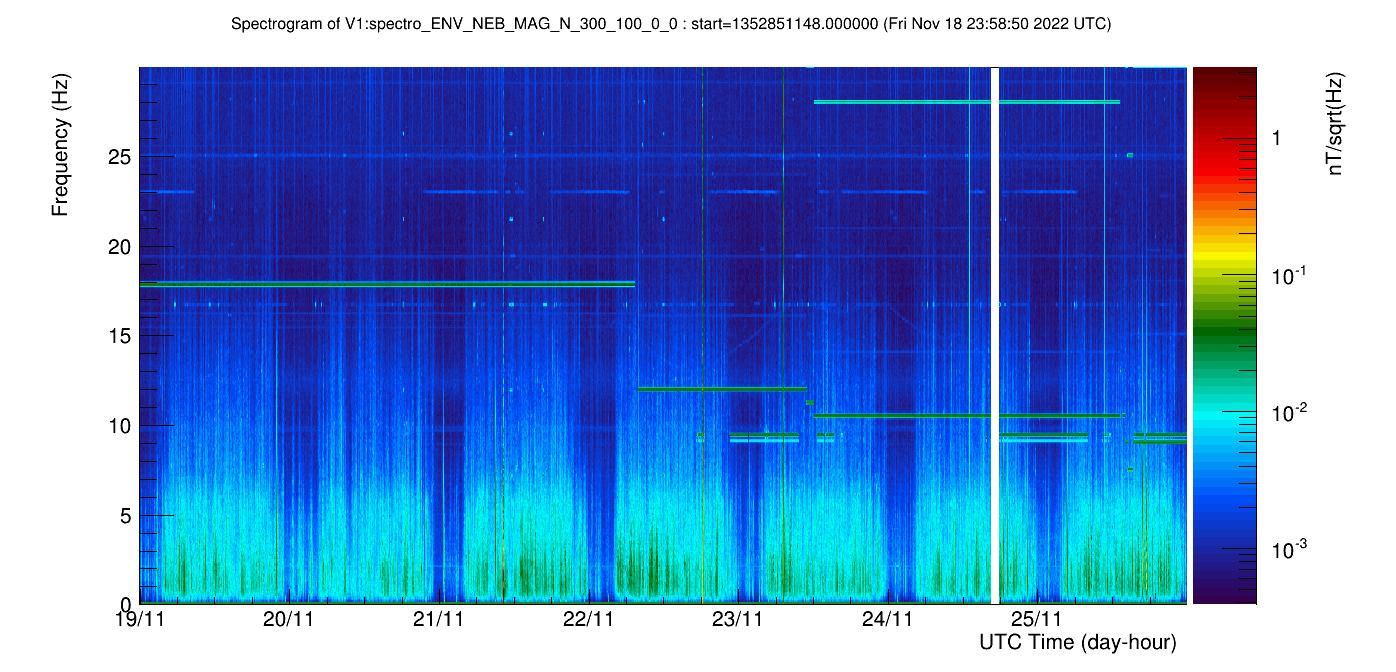
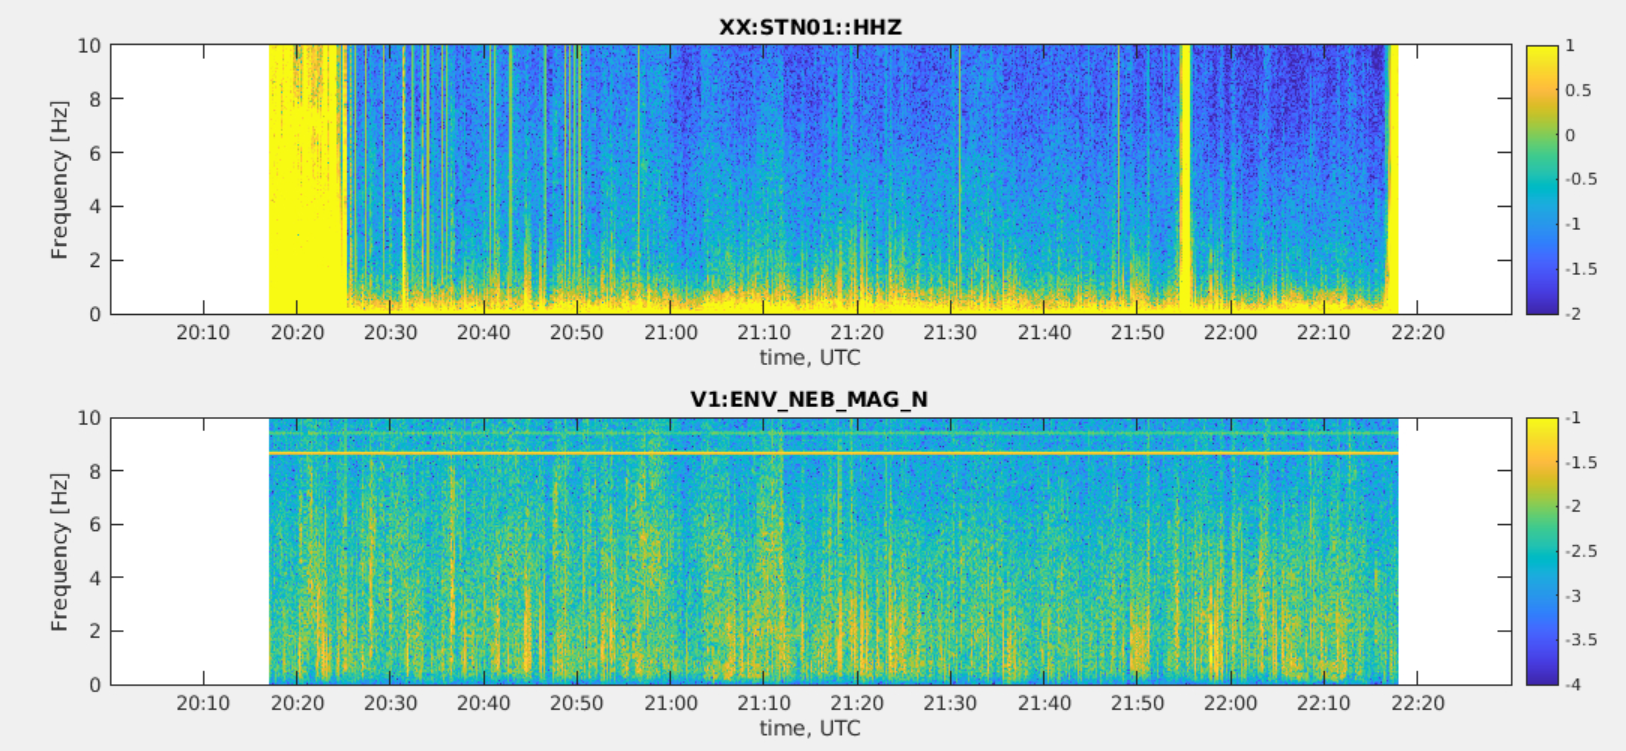
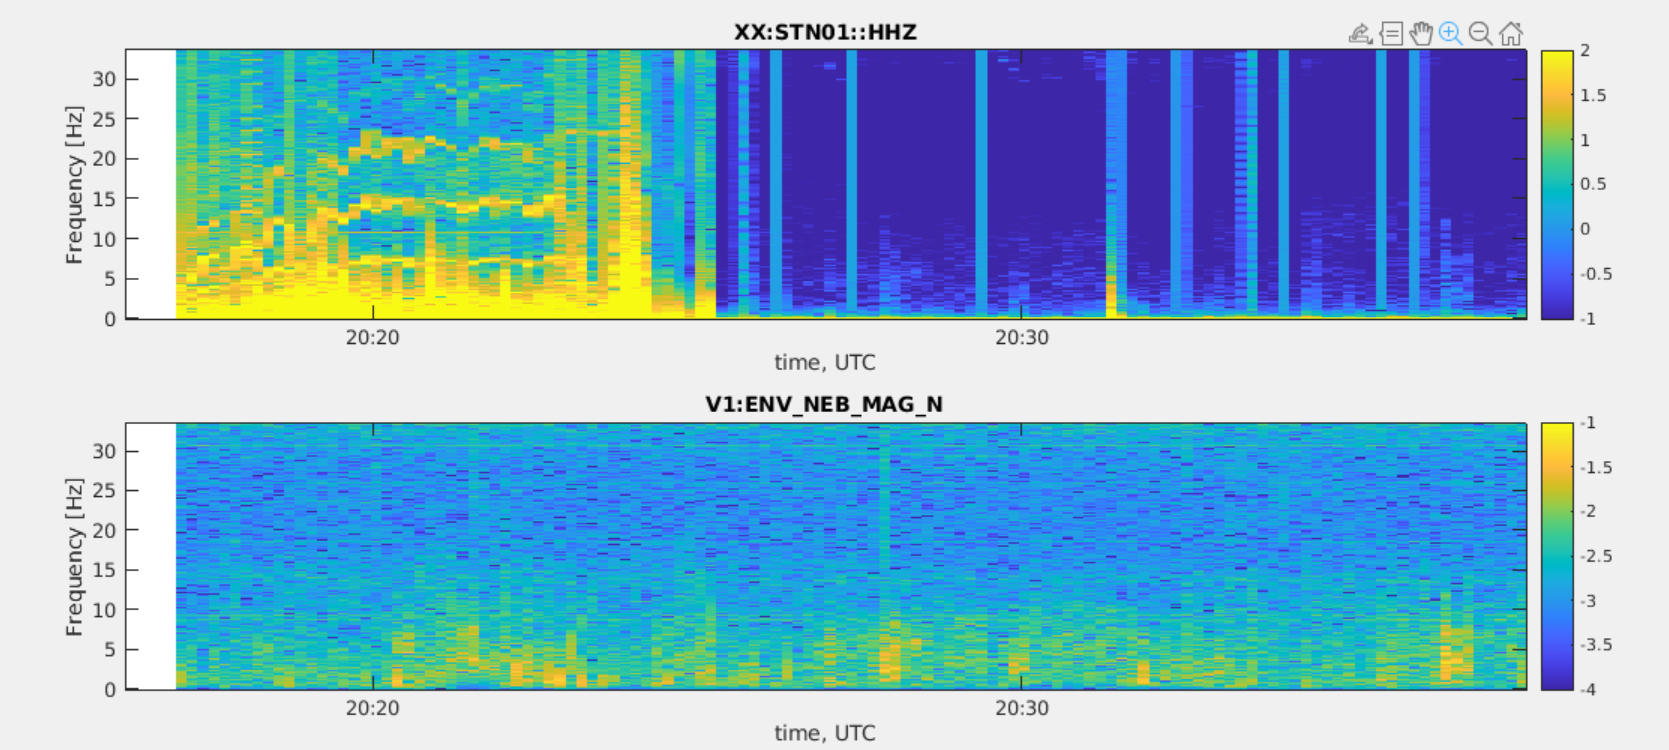
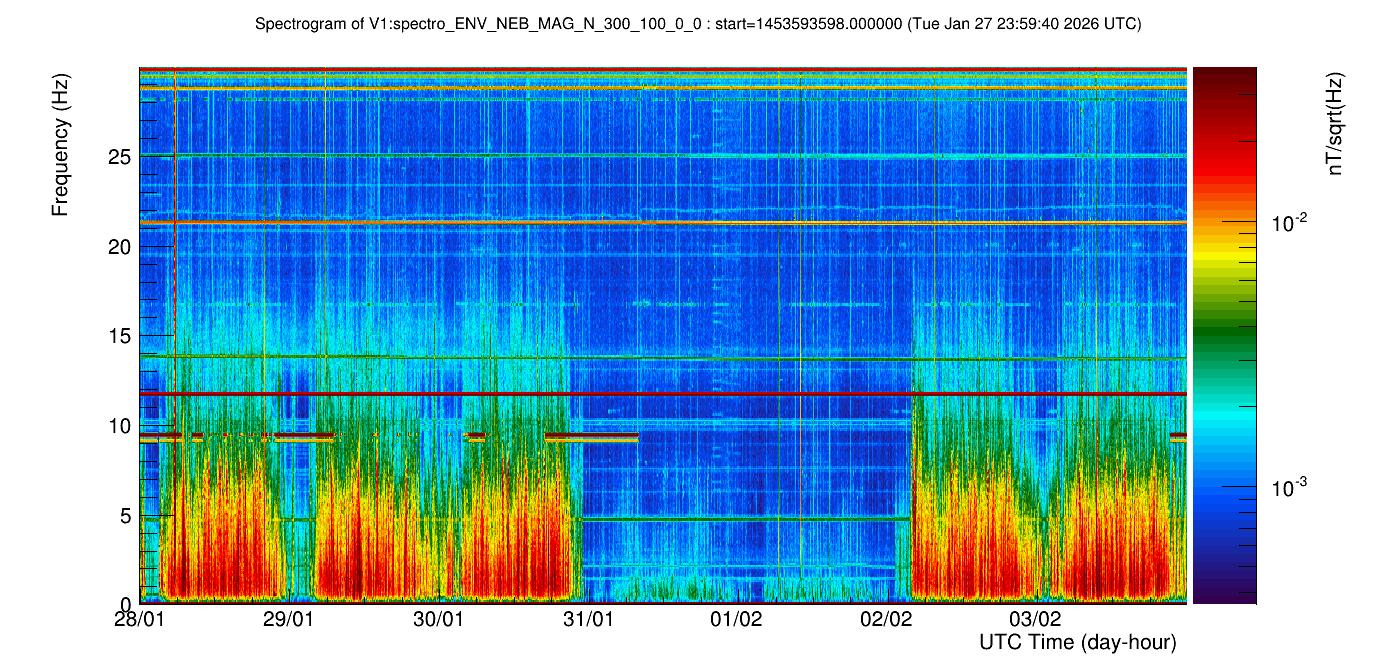
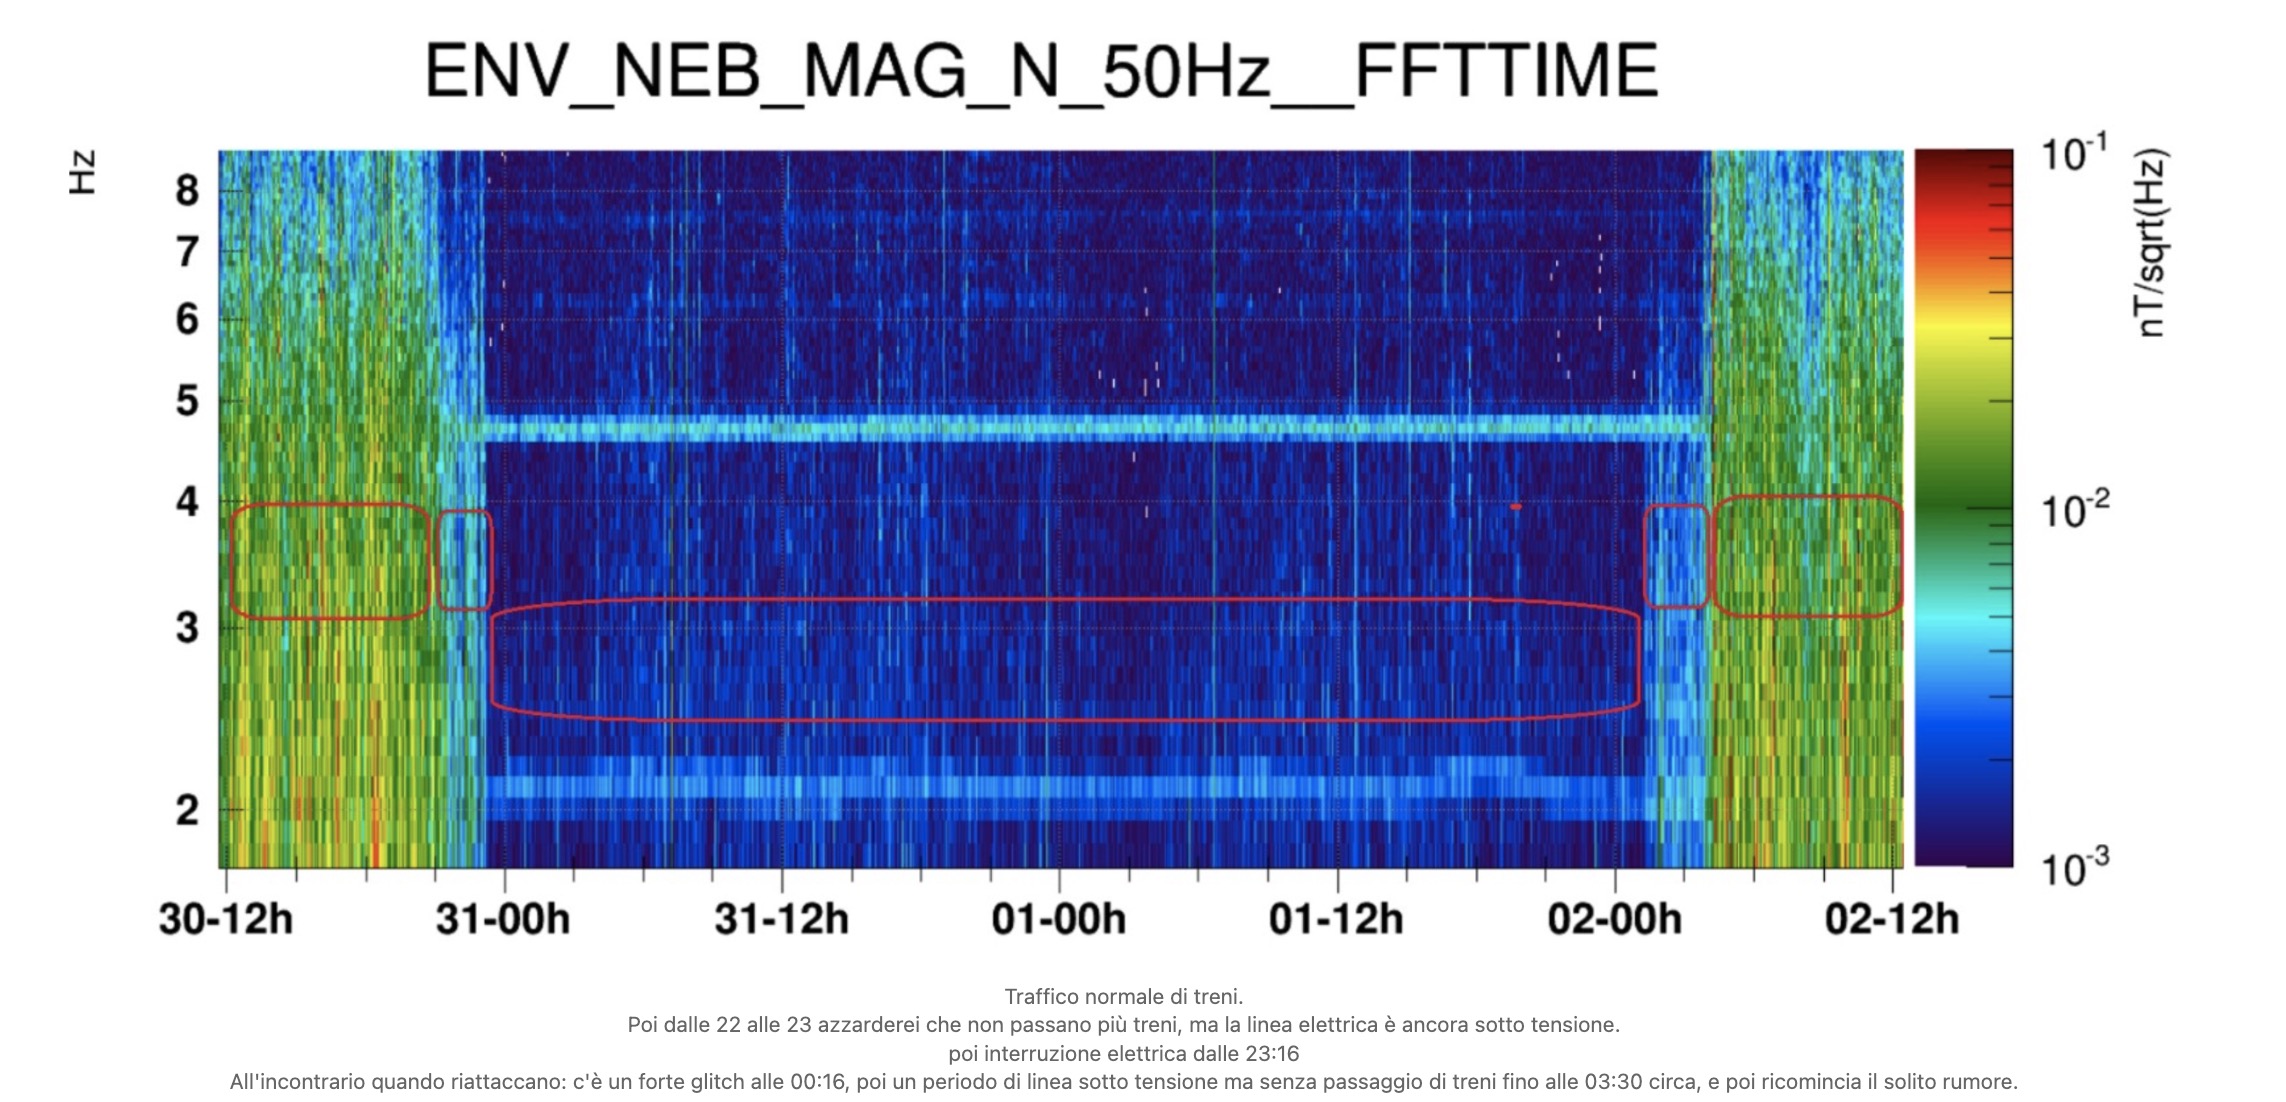
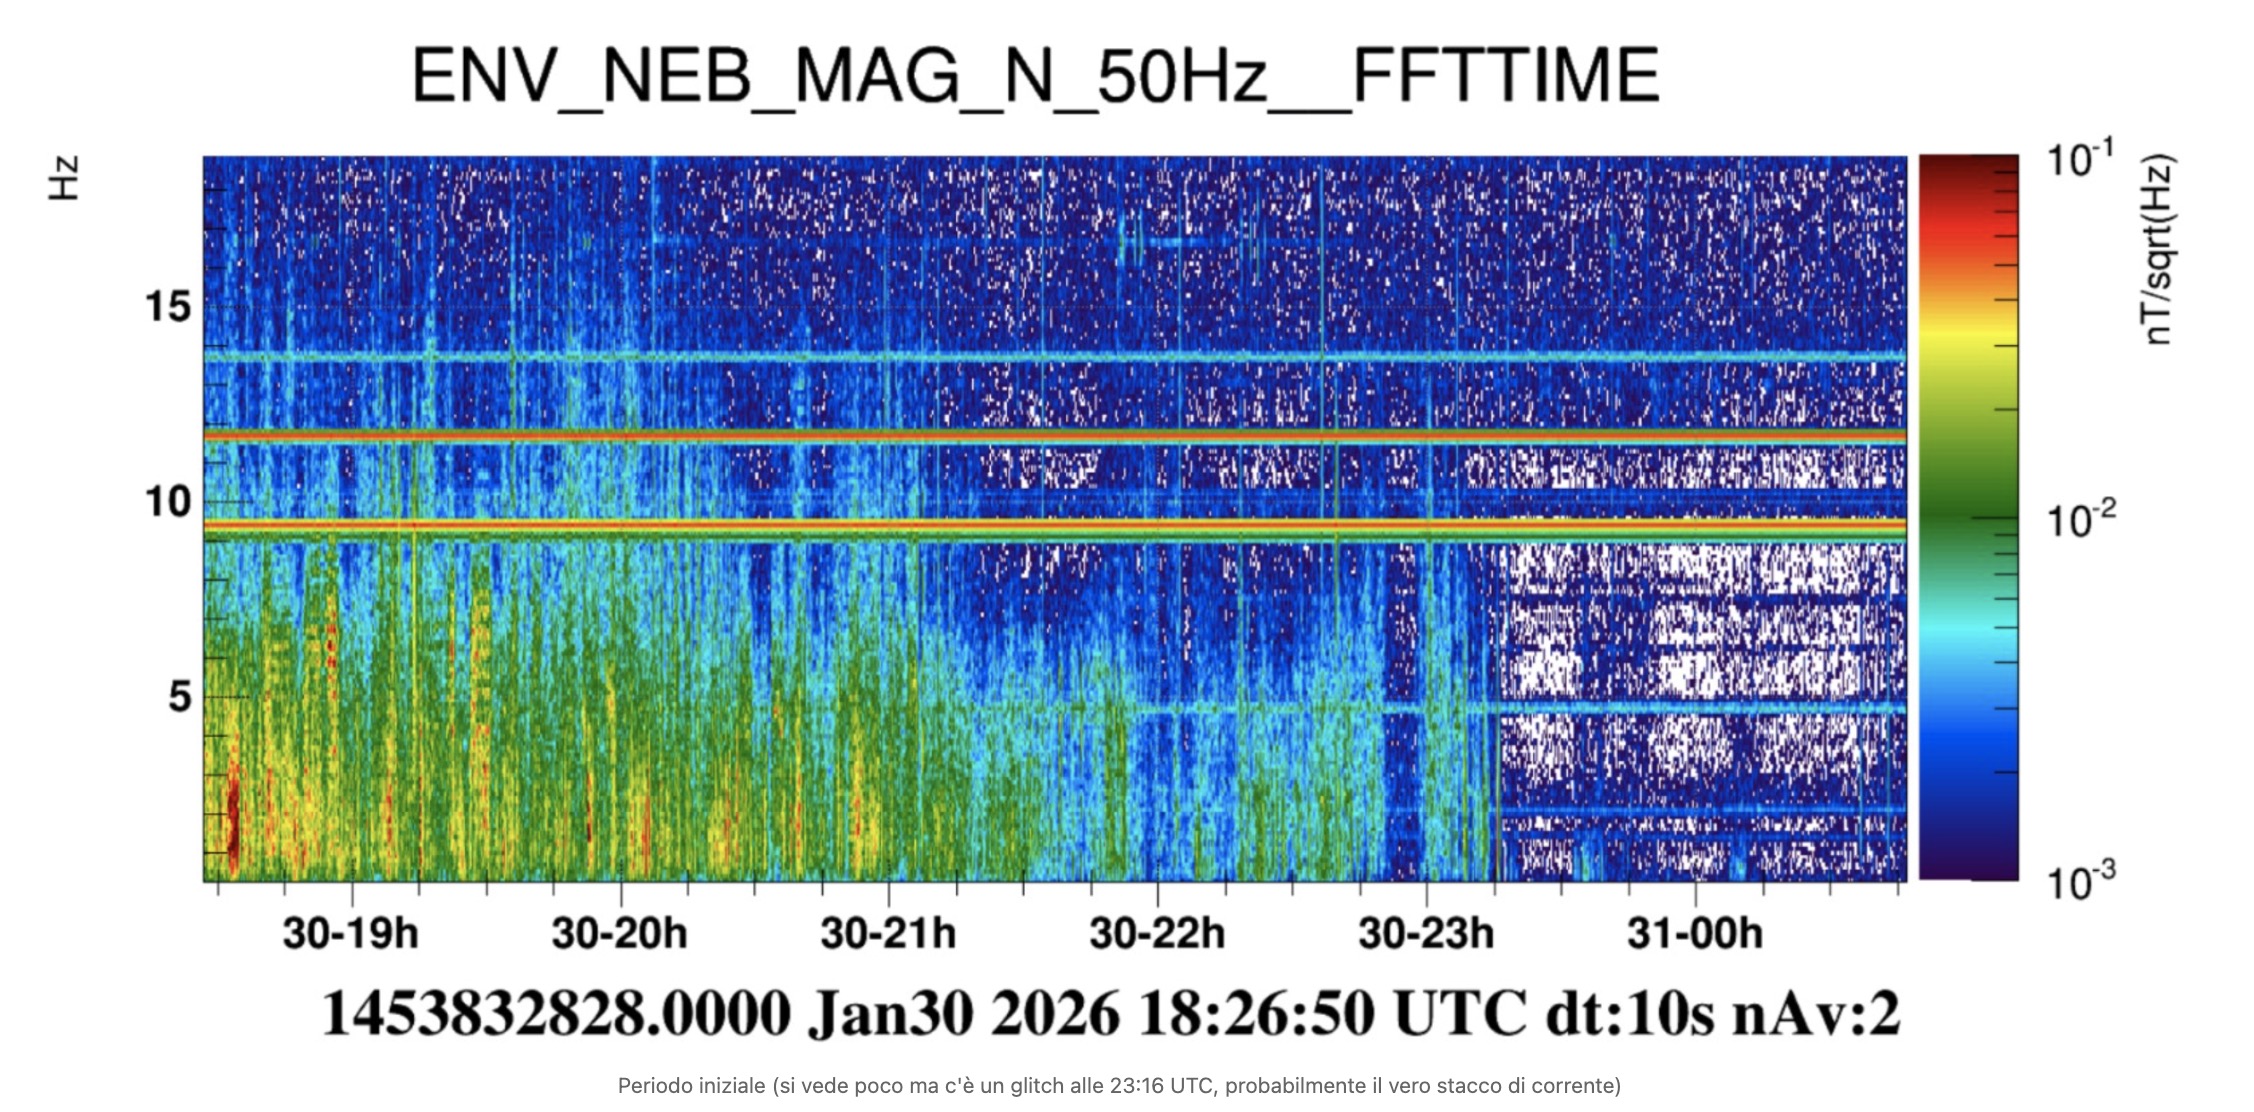
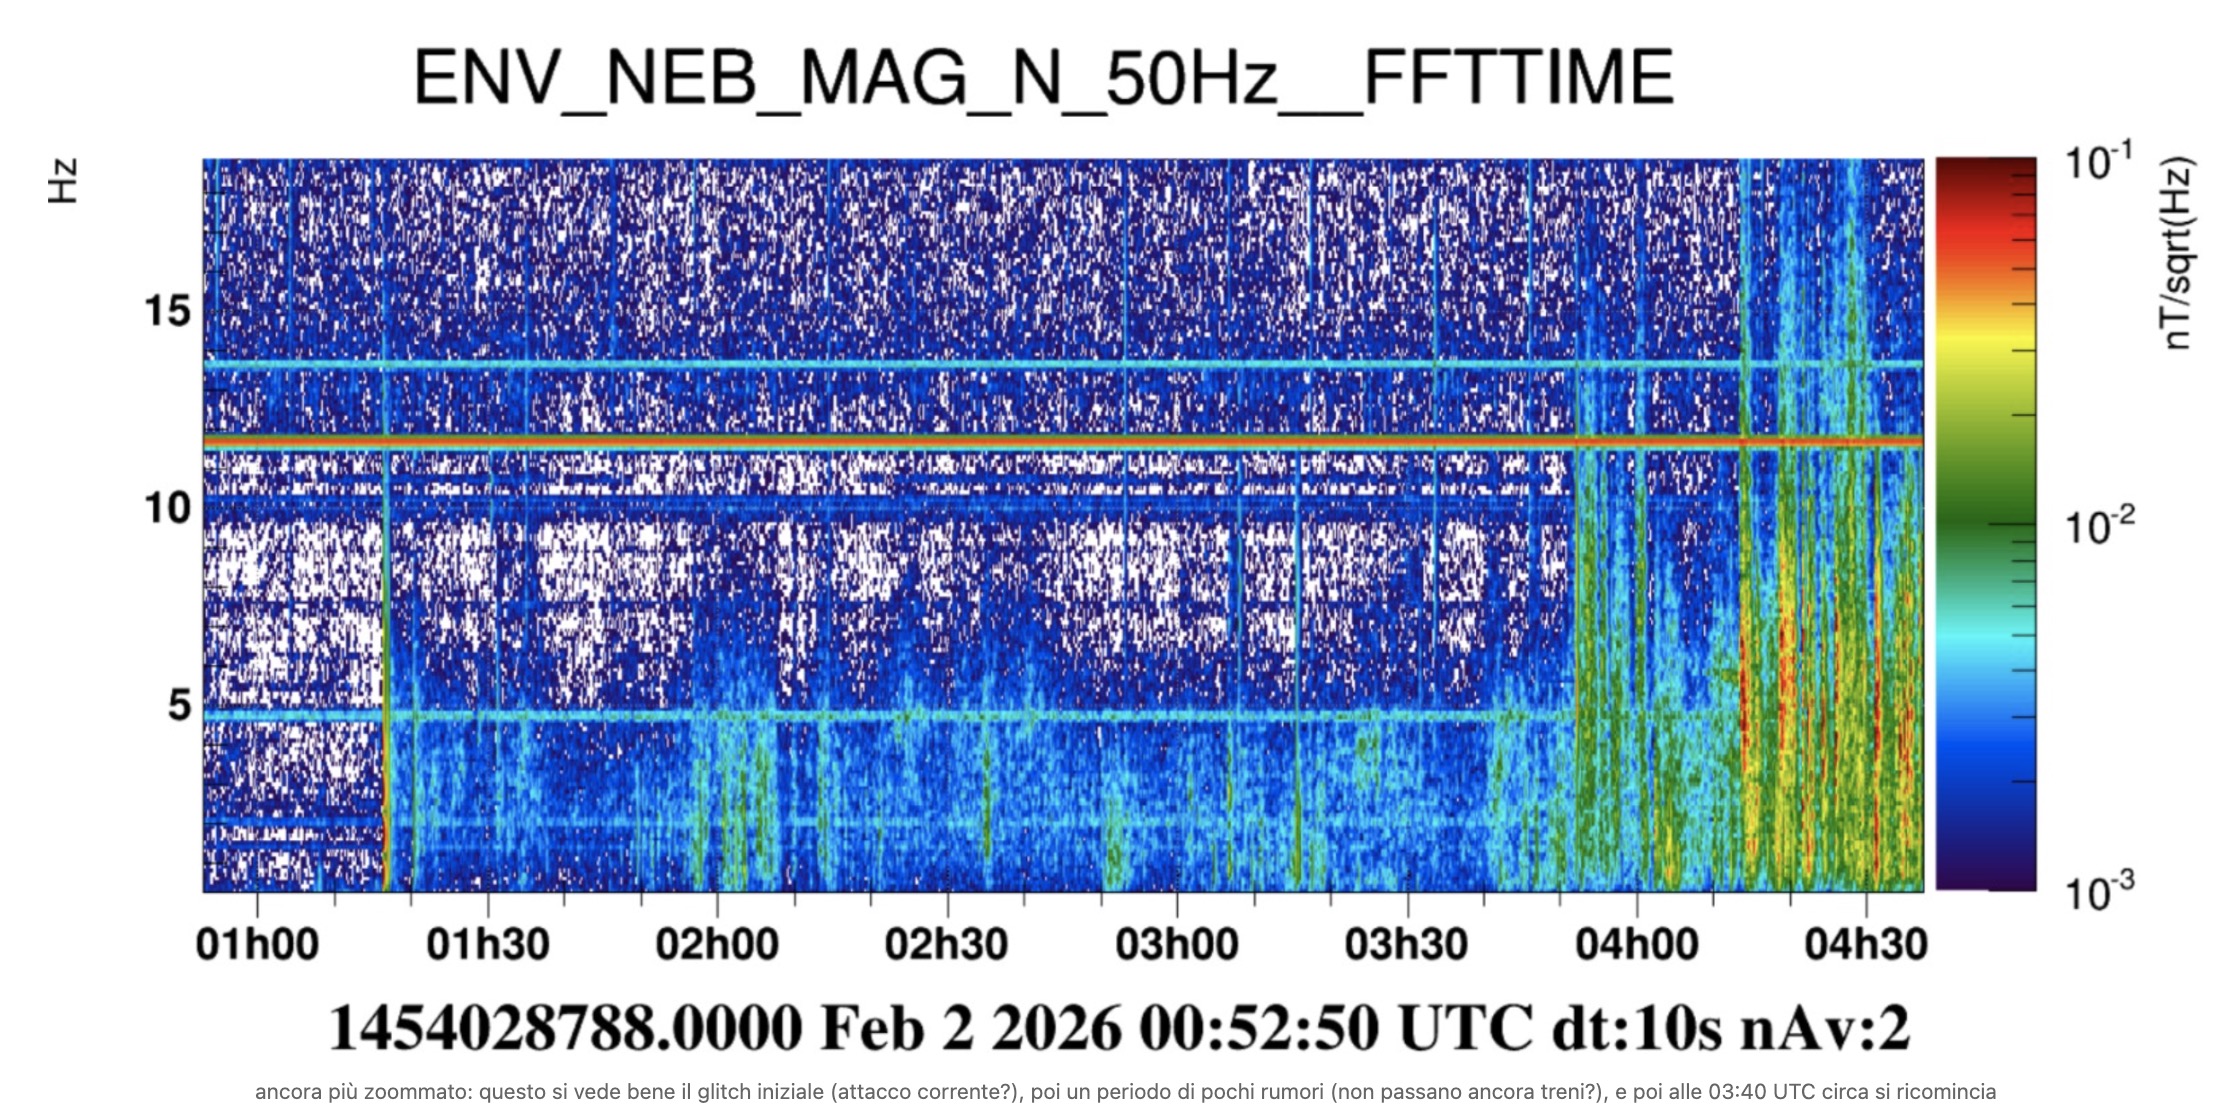
We know that our environmental magnetic noise below about 10 Hz is dominated by transients with quiter periods occurring daily between roughly midnight and 4AM. Figure 1 shows one typical VIM spectrogram of one NEB magnetometer. This noise is particularly evident at the NEB magnetometer, where transient noise tails extends also above 10Hz.

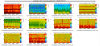
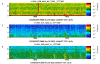
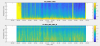
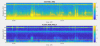
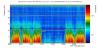
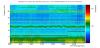
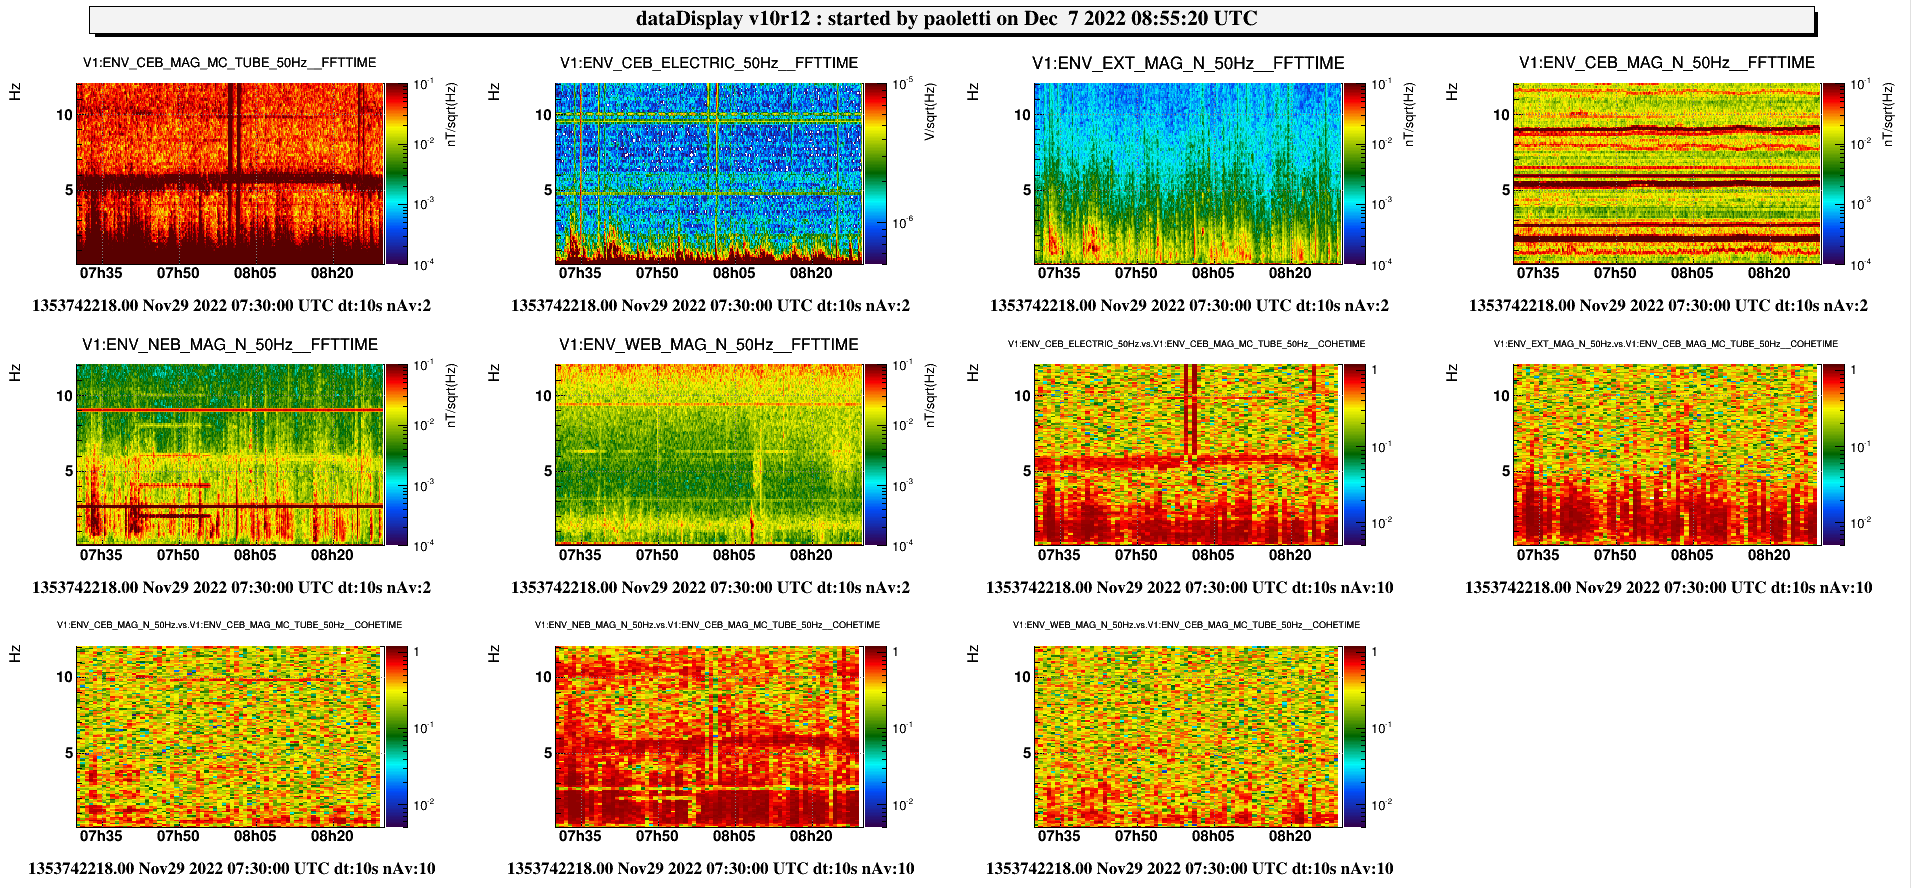
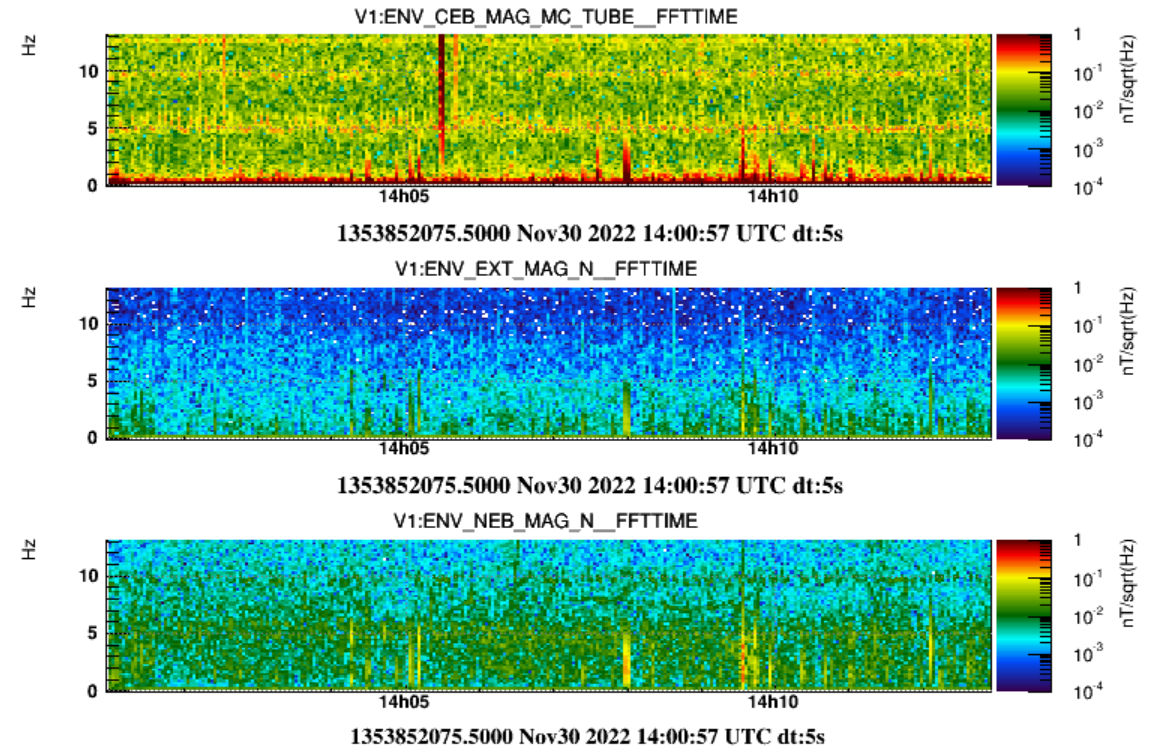
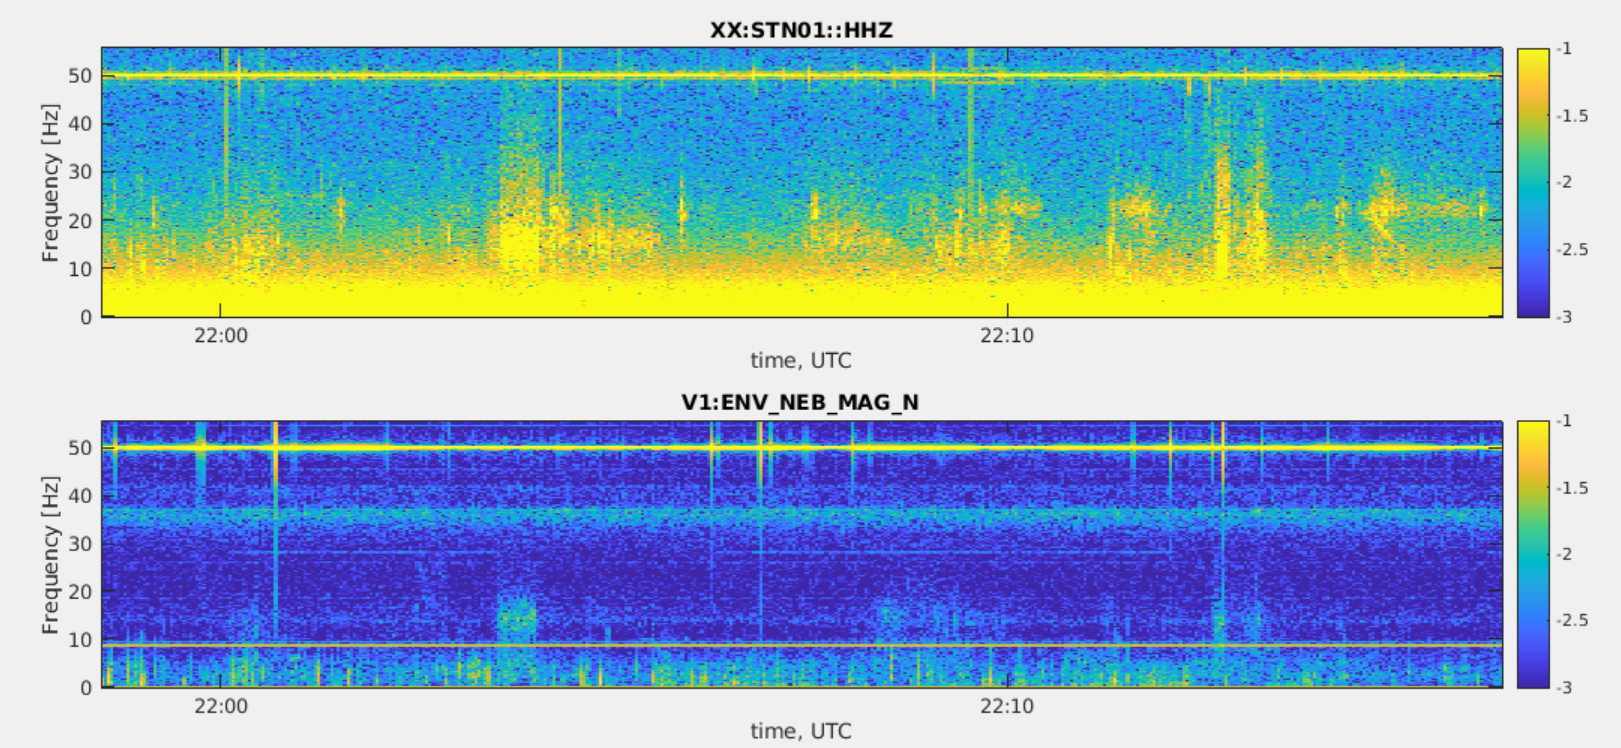
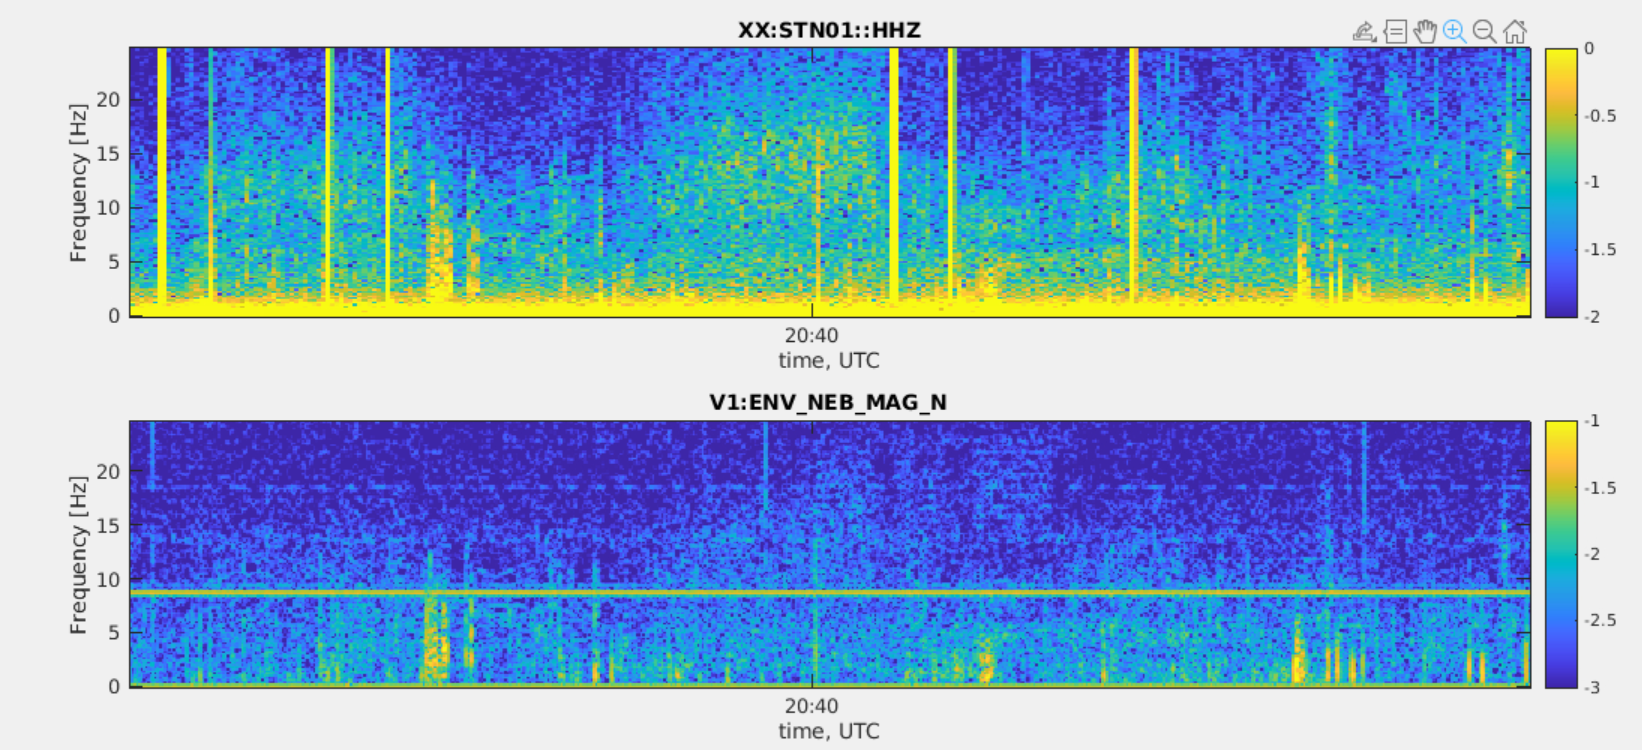
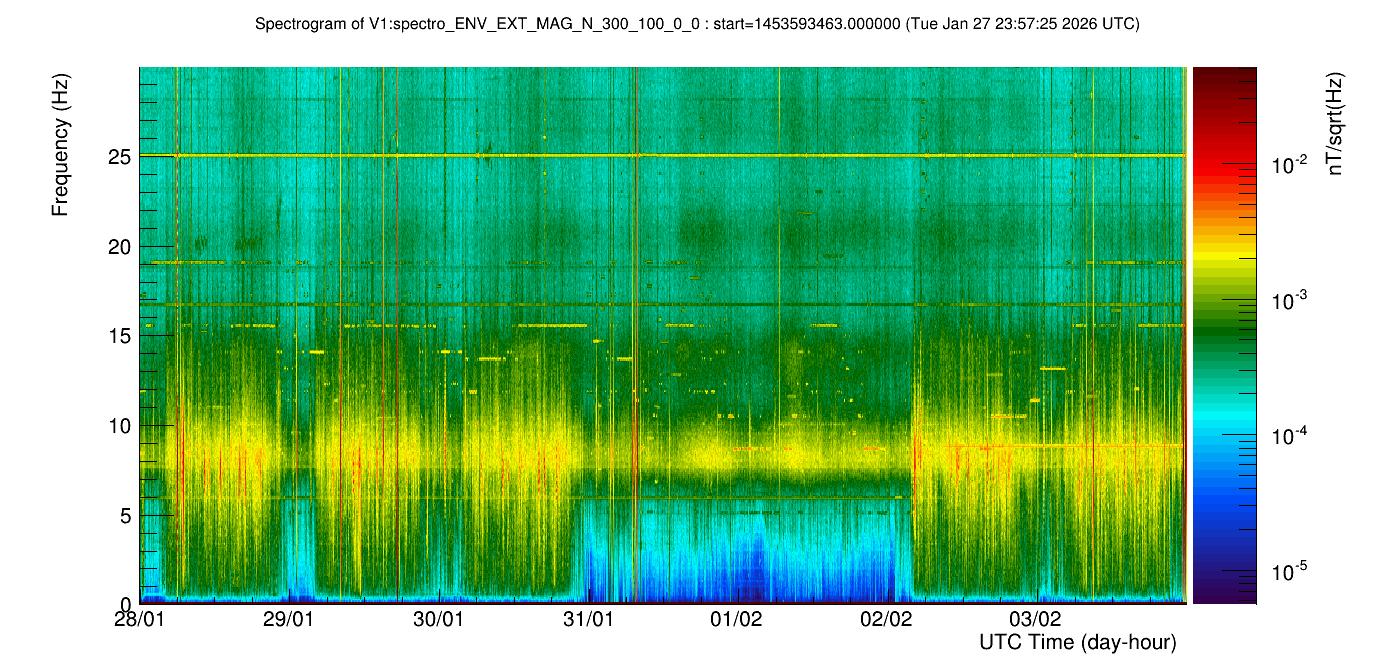
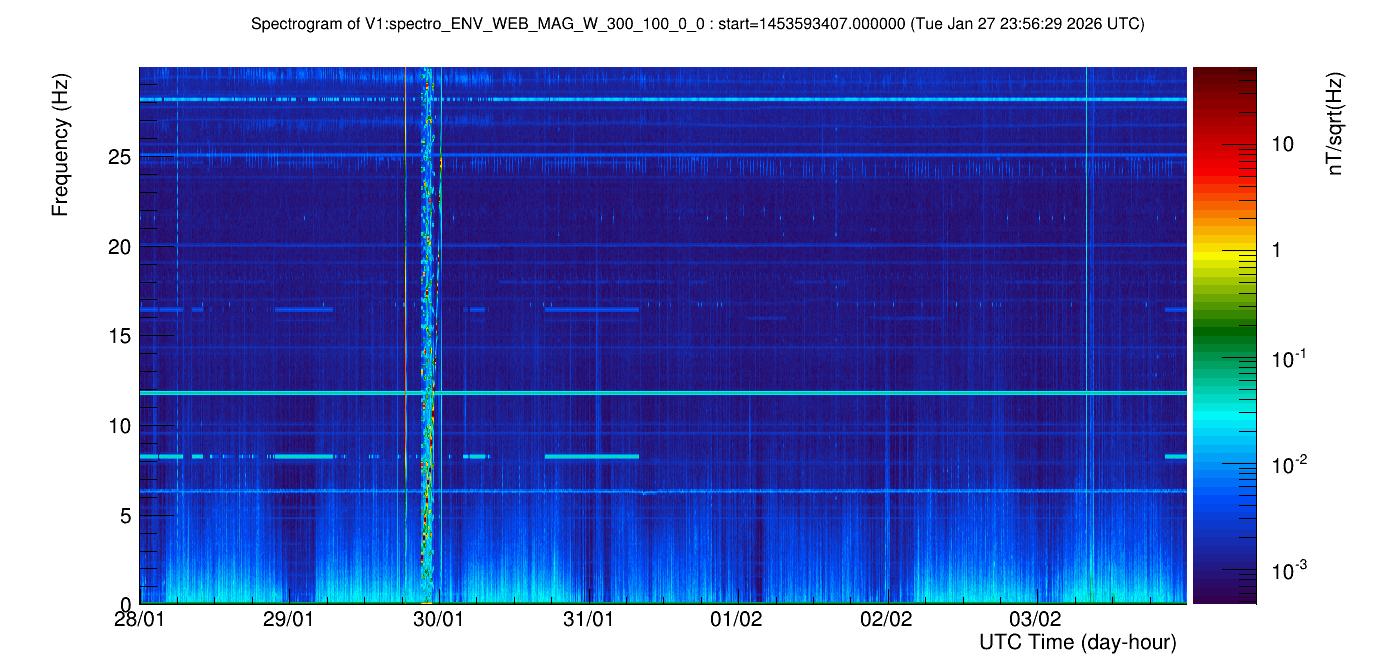
We noticed that these transients are correlated and coherent in all magnetometers: external magnetometers and magnetometers inside buildings. They look the most intense in the magnetometer we recently repositioned on top of the MC tube. Figure 2 shows 1hour typical spectrograms of all magnetometers where the correlated transients are visible. Figure 3 is a zoom-in.

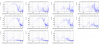
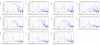
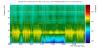
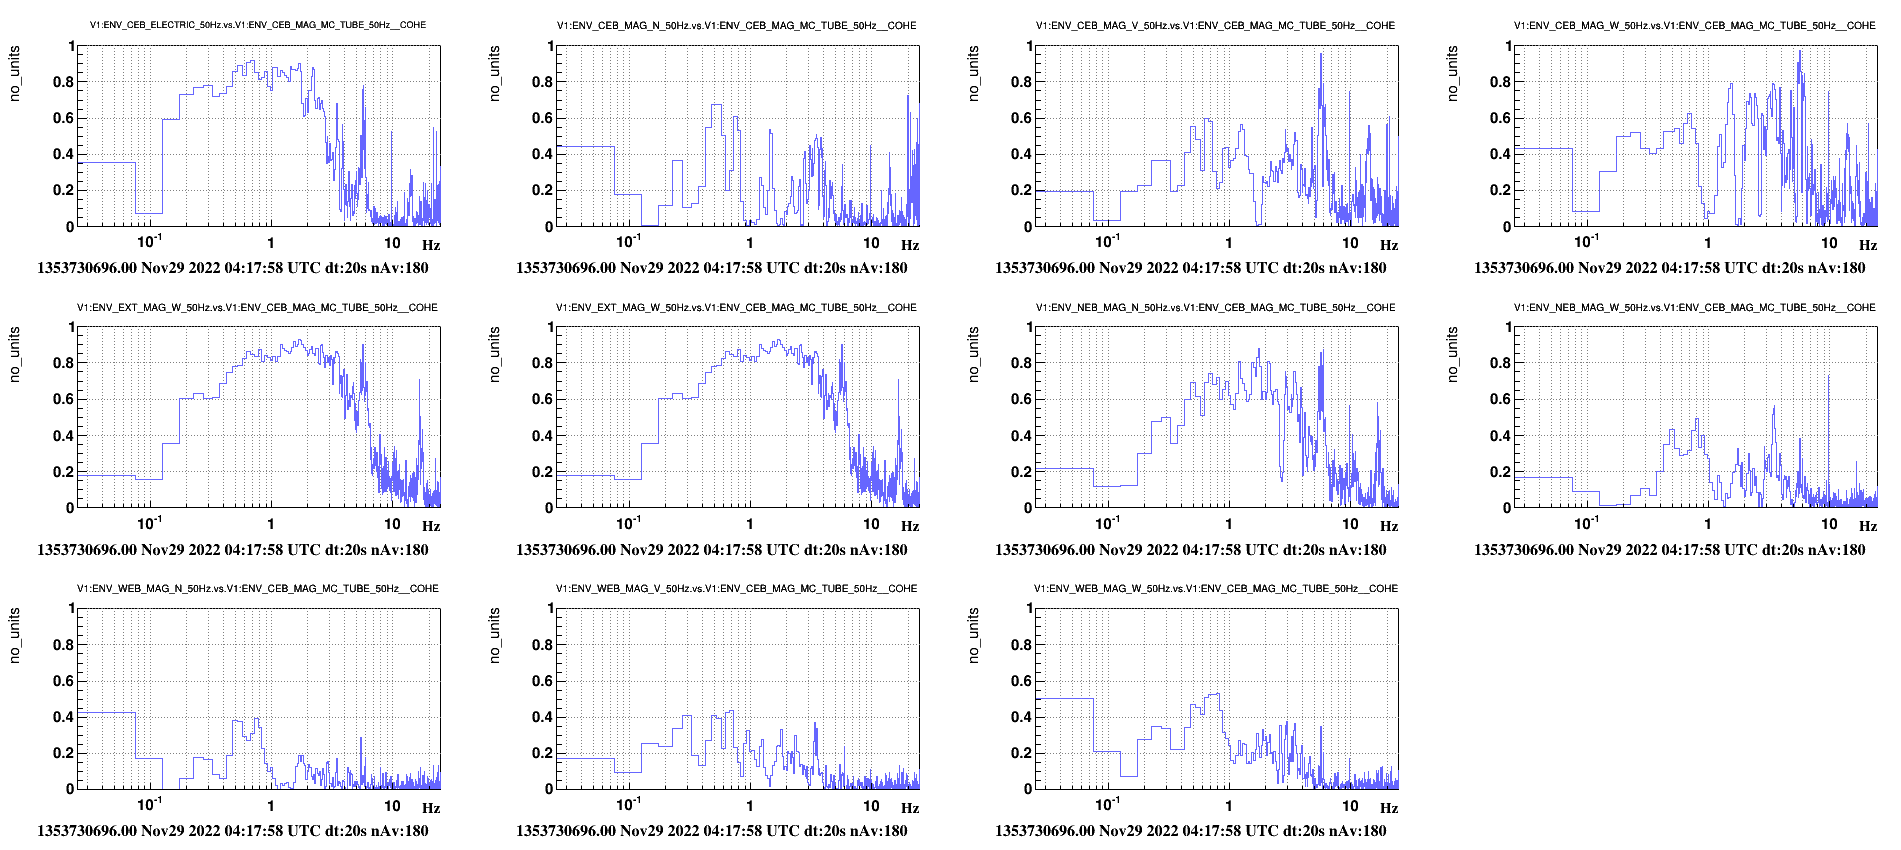
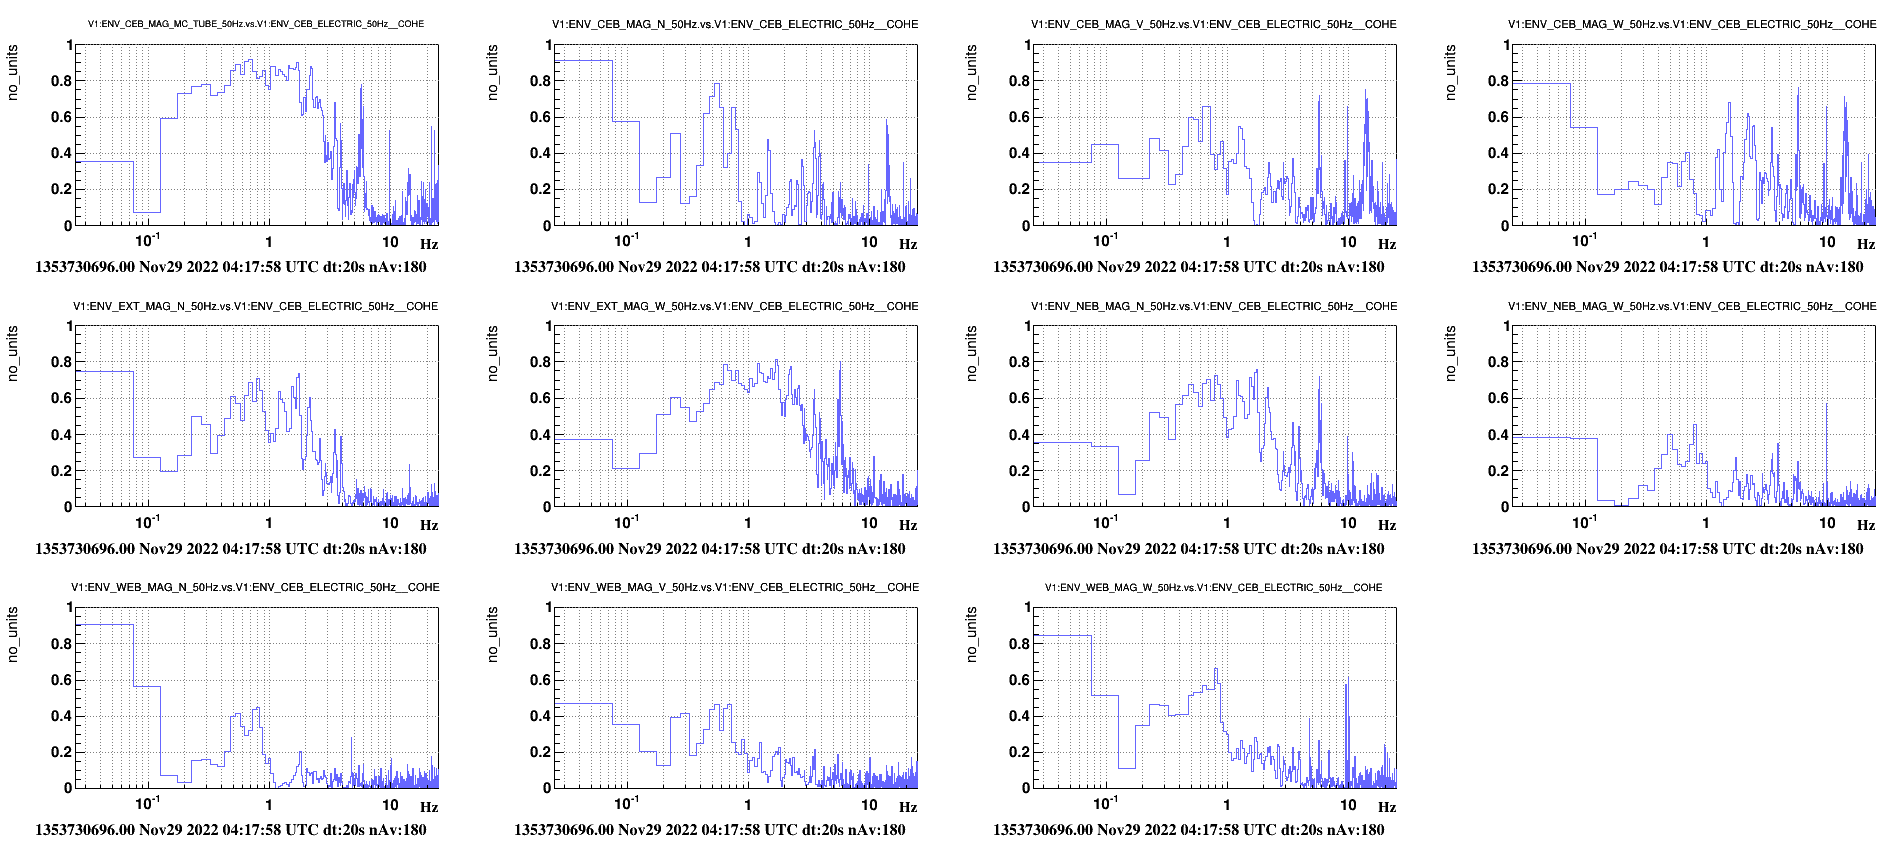
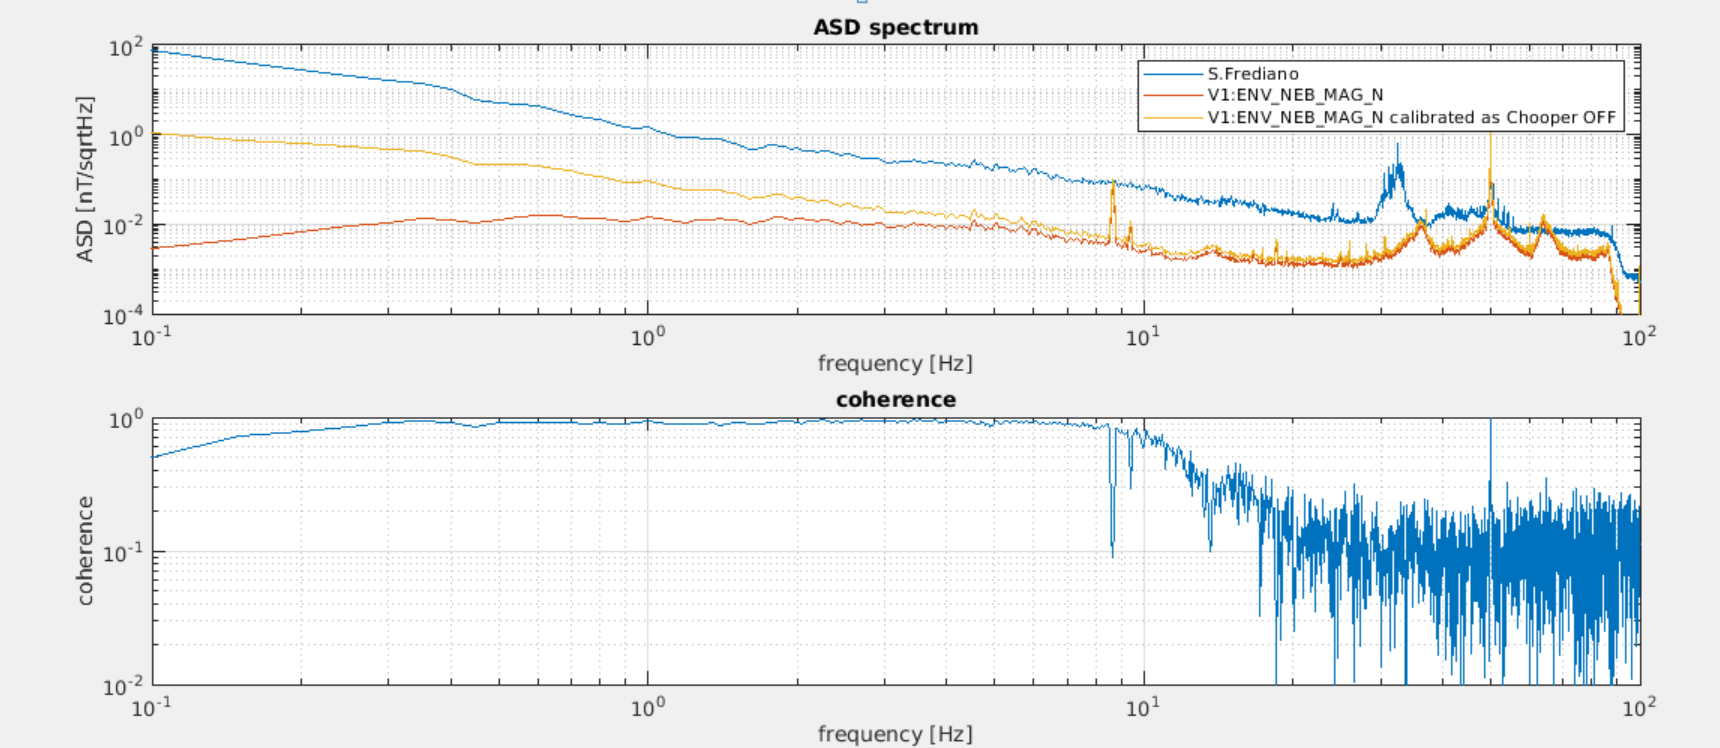
Figure 4 shows coherence between the MC tube magnetometer and all others. Good coherence is also present with the sensor CEB_ELECTRIC that monitors the voltage drop between the Virgo vacuum steel tube and the mains Protection Earth system, this is shown in Figure 5.

We also notice that the mysterious magnetic noise of November 28 - Dec 1st (https://logbook.virgo-gw.eu/virgo/?r=57973)  at 50Hz +/- 27.7 Hz has a similar coherence pattern.

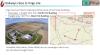
One hypothesis we make is that the propagation of the noise occurs through telluring currents in the ground. The MC tube might behave as a preferred lowest resistance path for them. cThe fact the there is no evidence of correlated noise in our IPS and UPS probes and the peculiar time distribution of transients make us think their source to be external.

This bruco https://scientists.virgo-gw.eu/DataAnalysis/bruco//2022/2022-12-07/ENV_EXT_MAG_W_1353802000_ENV/ was done using one external magnetometer as target and it evidences all the mentioned coherences.


Images attached to this report
Comments to this report:
fiori - 23:07 Sunday 05 February 2023 (58722) Print this report

One ipothesized sorce for the site-wide correlated glitches are railway tracks. the closest train stations to Virgo NEB are S.Frediano a Settimo (2.5km from NEB) and Cascina (2.9 km fron NEB). We took a 2hours magnetic (fluxgate probe) recording at about 50m from the S.Frediano train station. Data are from Sunday January 29 between 20:17 UTC and 22:18 UTC. Figure 1 shows the spectrogram of the recording (top), on the bottom is the correspondig specrogram of the NEB N magnetometer.

Several correlated transients are evident. Figures 2 and 3 show some. These are generally significanlty more intense in the magnetometer near the station than at NEB. Figure 4 compares the spectra during a bunch of these transients: they are ~ ten times more intense at the station, and the coherence is very good.

During the two hours four trains stopped and reparted from the station, at (LT): 21:12, 21:42, 22:41, 23:05. Only the first one produced a very intense magnetic signal at the station consisting of non stationary frequency lines (Figure 5). Noticeably there is no counterpart of it in the NEB magnetometer.

These data support the hypothesis that the observed correlated magnetic glitches at Virgo originate from railways. The specific location or track section which produce the disturbance is not identified.

Images attached to this comment
fiori, tringali, paoletti - 16:37 Friday 06 February 2026 (68641) Print this report

We noticed, first in VIM spectrograms, that the infamous low frequency magnetic glitches seen by all magnetometers site-wide suddenly disappeared during last week-end.

Searching information we found out that railway traffic was suspended during those two days between Pisa and Empoli stations because of works along the line (also in the attached pdf):

https://www.rfi.it/it/news-e-media/comunicati-stampa-e-news/2026/1/16/rfi---linea-firenze---empoli---pisa--lavori-di-manutenzione-e-po.html?utm_source=chatgpt.com

Few observations:

We altready knew that these glitches are related to trains but...

  • This finally proves that they are generated within the Pisa - Empoli railway section
  • These glitches disappeared completely from CEB and NEB magnetometers, instead some are still seen in WEB magnetometers (Figure 4). This probably tell us that the WEB sees also glitches from a different railway line, the freight line that runs approx. North-South: see the map in Figure 5.

Spectrograms in Figures 6 to 9 show an insight of the time of the disappearing/reappearing:

  • Figure 6, 7 and 8 show the NEB magnetometer (the closest to the Pisa-Empoli railway): the interpretation (Federico) is that first the train transit stops, than approx one hour later (/ one hour before) the electric line is de-electrified (/ re-electrified). A large glitch can be seen at these times: in Figures 7 and 8, respectively.
  • Figure 9 is the WEB magnetometer, on the same color scale and time window as Figure 6: note that in this case the glitch density reduces just a bit.
Images attached to this comment
Non-image files attached to this comment
Search Help
×

Warning

Error

The present report has been modified outside this window. Please check for its integrity in the main page.

Refreshing this page will move this report into drafts.

×