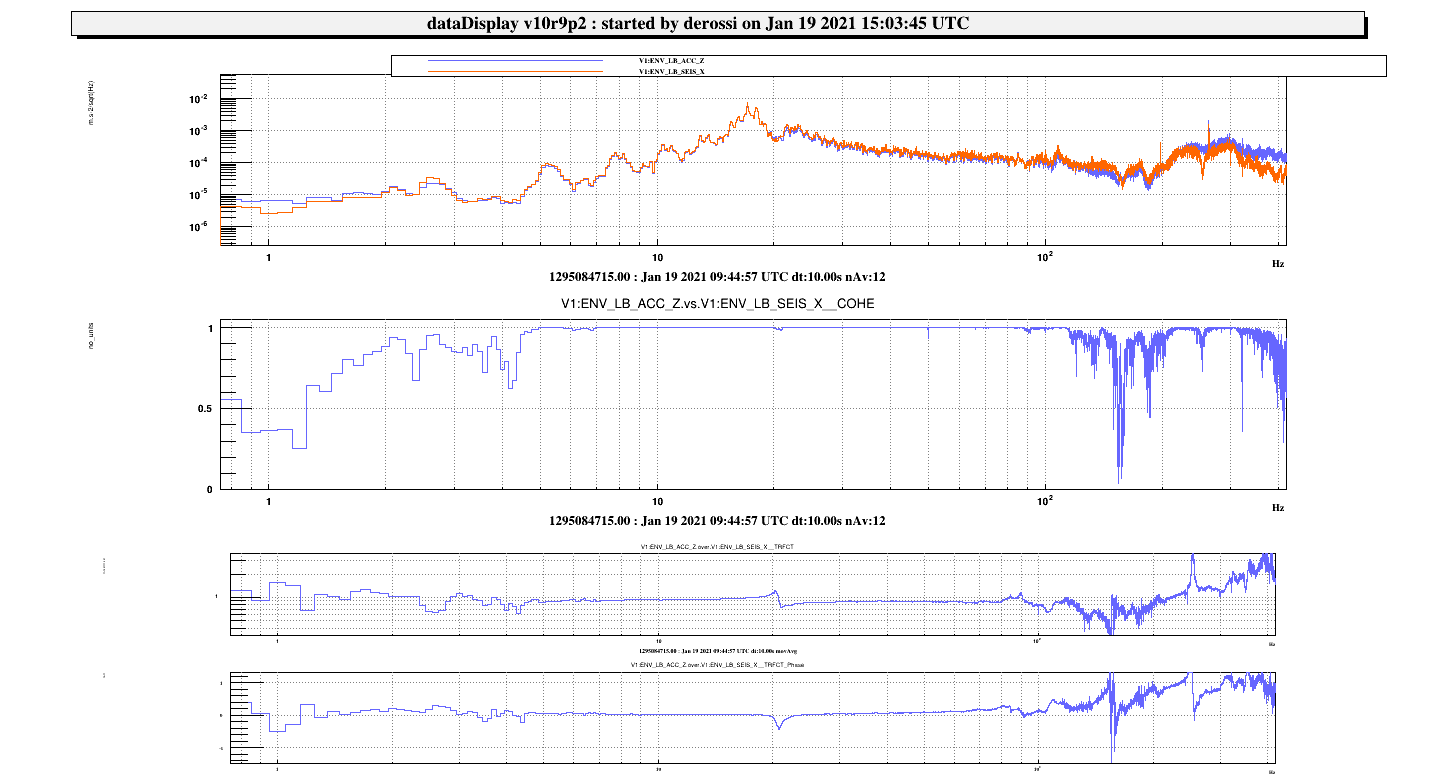
- Huddle test (plot 1) 09:44:00 UTC 1 min: we ensured that the seismometer and the accelerometer give the same results by measuring the TF between the seismometer and the accelerometer, both fixed on the amplifier bench. NB: the z axis (direction of the beam going from the LB to the EIB) on the seismometer is SEISM X
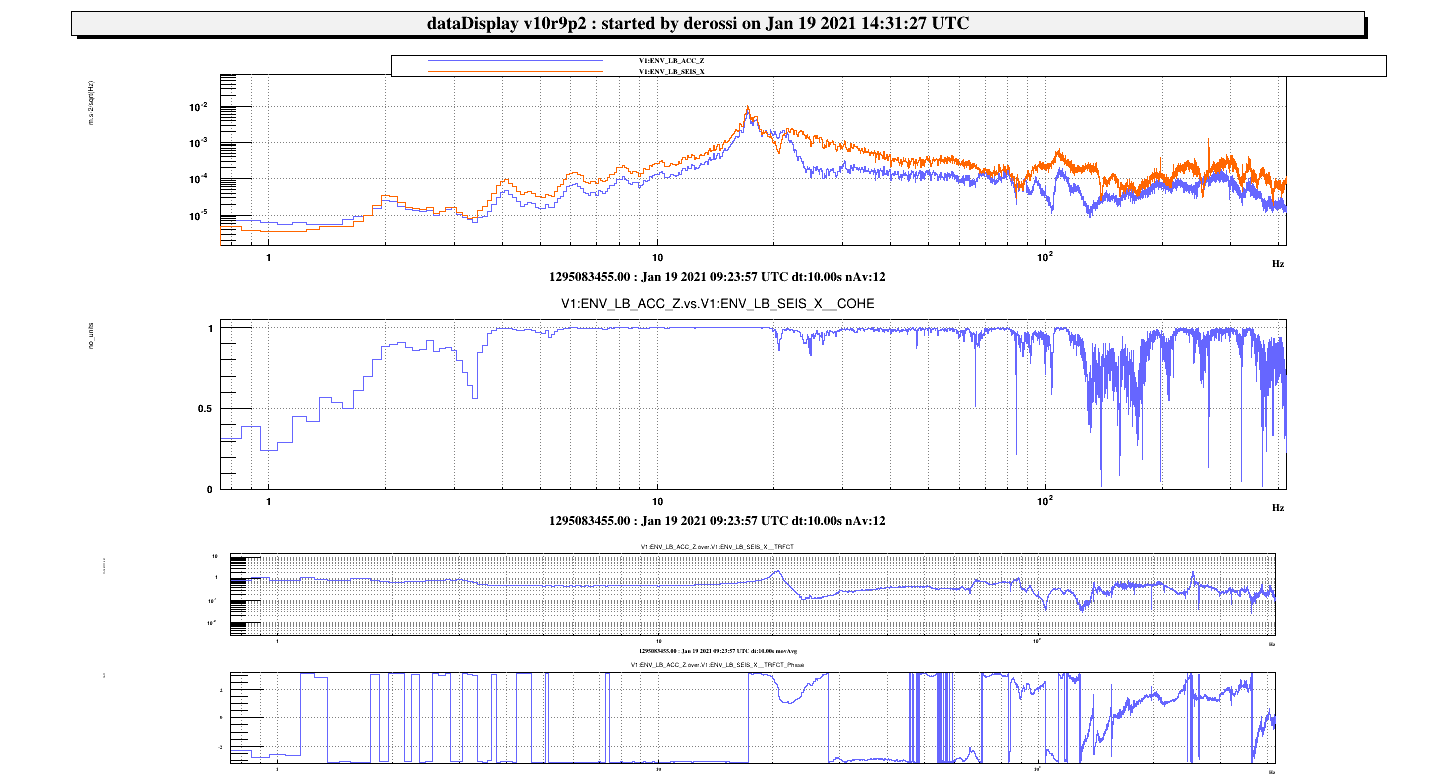
- TF between LB and fibered ampli bench (plot2) 09:23:00 UTC 1 min: TF between the accelerometer on the LB along the z direction and the seismometer on the new fibered ampli bench. We made a tapping on the NW corner along the z direction. The plot shows that they both move at 17 Hz.
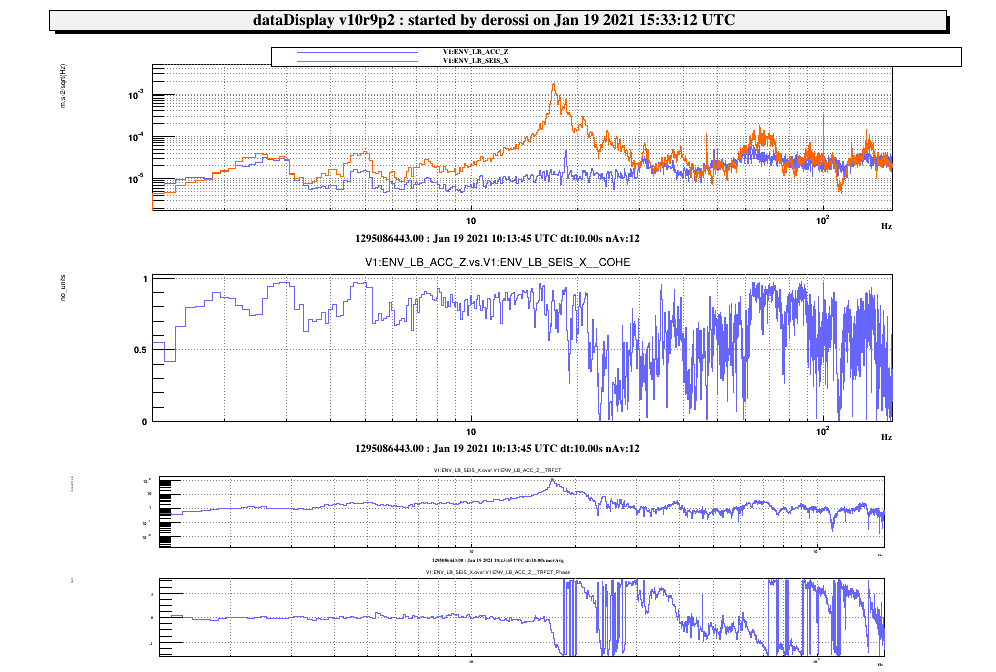
- TF between fibered amplifier bench and the floor (plot 3) 10:12:50 UTC 1 min. Once we ensured that 1) seismometer and accelerometer are well calibrated and see the same movement 2) the two benches have the same resonance frequency, we placed the accelerometer on the floor and we measured the TF between the amplifier bench and the floor. We injected noise by jumping in a close room (i.e. the LL atrium).
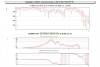
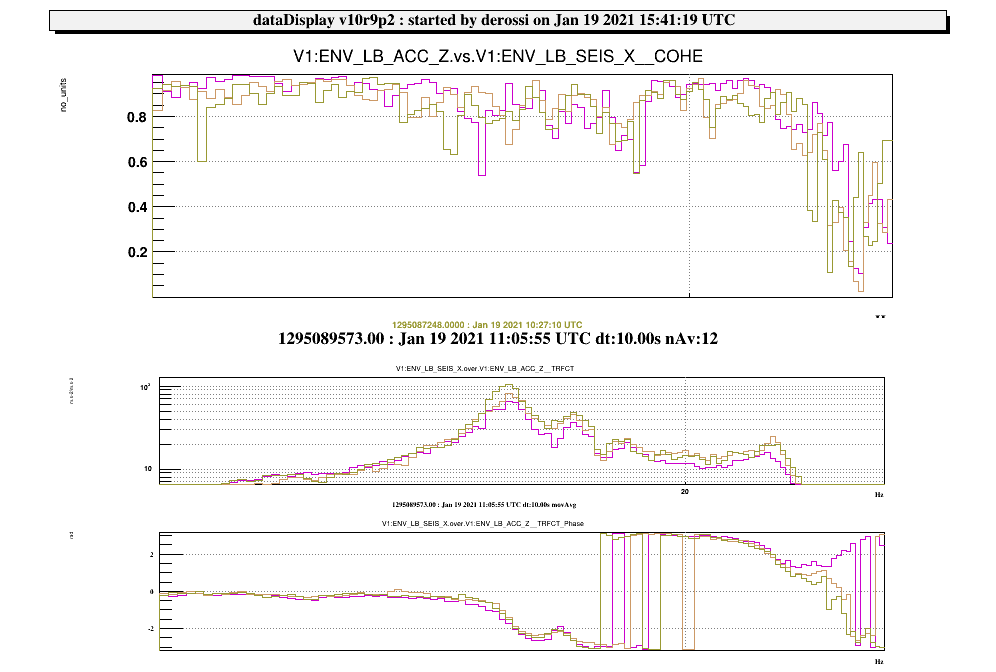
- TF between the fibered amplifier bench with the mechanical damper and the floor (plot 4). We placed on the small bench the mechanical damper developed by P. Ruggi and the Pisa group and we made the measurements in 3 different configurations (we jumped for 1 minute each time)
-
configuration
plot GPS start height of the peak at 17.1 Hz with 2 viton cylinders touching the mass green line 10:26:15 UTC 105 with 6 viton cylinders touching the mass yellow line 10:56:10 UTC 78 with 12 viton cylinders touching the mass pink line 11:05:00 UTC 64 More comments will be posted once we will have better analyzed the data and made a fit of the TFs.
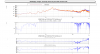
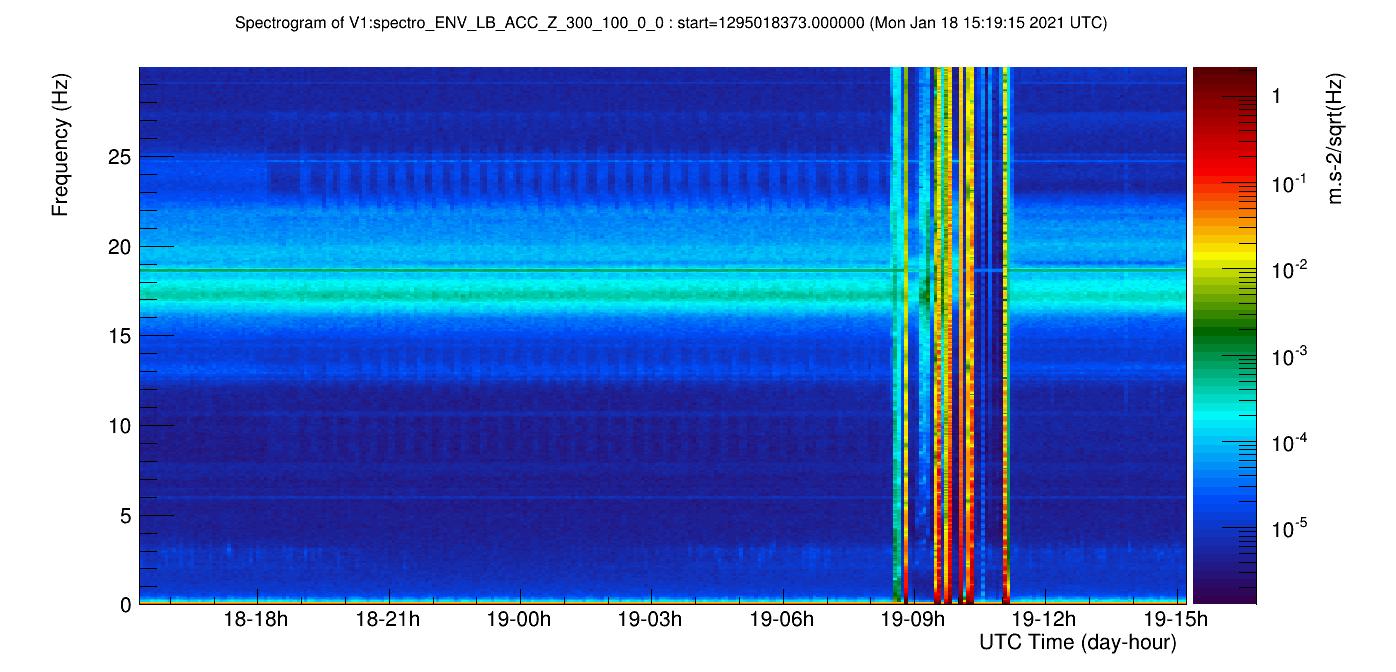
These plots document the currently achieved reduction of the 17Hz vibration of the Laser bench, in quiet conditions: before the damper and after the damper
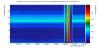
The first plot is the VIM spectrogram of the LB_ACC_Z channel (on the old part of the LB).
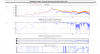
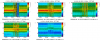
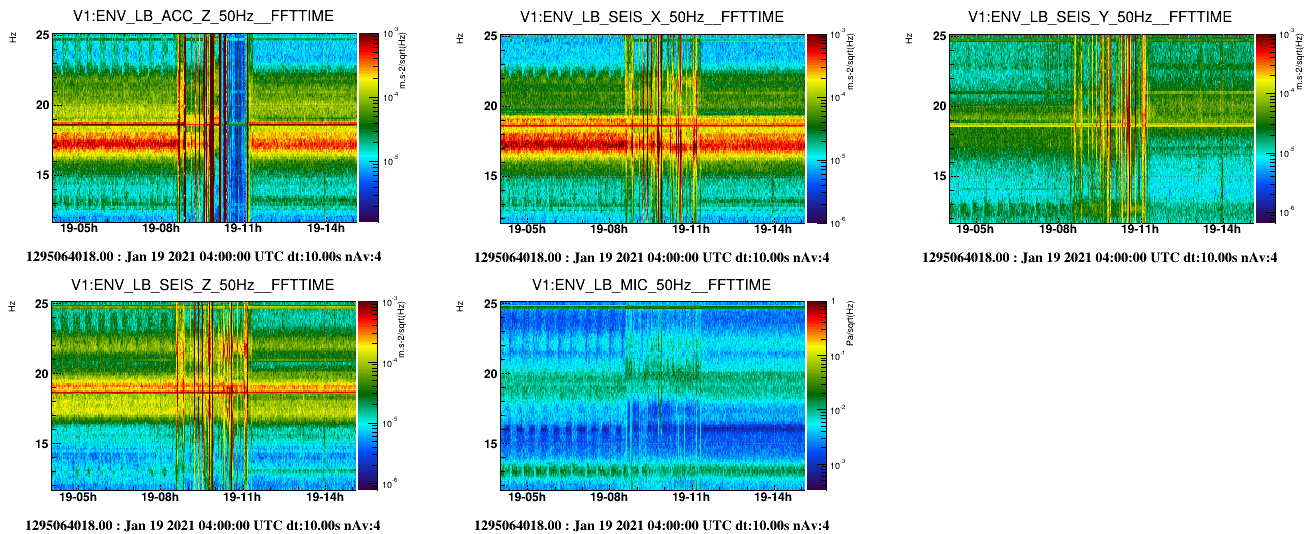
The second plot shows spectrograms of the same accelerometer, the episensor on the new part of the bench, and the microphone: since the bench vibration is influenced by the acoustic noise in the lab, it is important to check that the acoustic noise level was the same at the compared times, and it was.
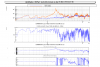
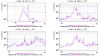
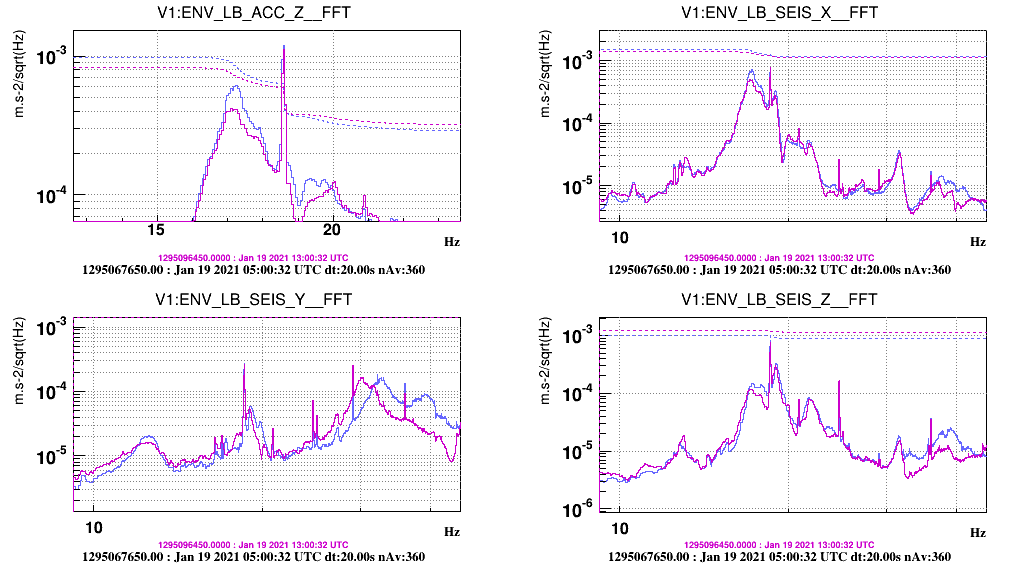
The third plot compares spectra before and after the damper, same channels.
The reduction of peak amplitude is about 35%, the RMS reduction is about 20%.
To test further damper configurations, aiming to improve the tuning, could be simply consist in applying the change then collecting some hours of quiet data.