We evaluated the power budget of the Injection System, after the INJ power increase (realized in Nov 13 2020), in order to have a reference for future comparison with the new MC payload installed this last weekend.
The first thing to take into account is the power budget on EIB bench. Here, we have the measurements done on 21/11/2020 (#entry 50015). On that occasion, it was measured 50.1W after the PMC (corresponding to 0.844V of PMC_TRA) and 39.5 W in transmission of the IPC on EIB bench. This corresponds to a loss of 21.15% in the EIB, overall coming from: the Farady Isolator, the polarizers, and the EOM. We expected less than 10% , so this discrepancy is being analyzed and will be further checked when we replace the polarizers for the Faraday isolator on EIB.
Taking as reference the measurements of 21/11, we have the following values (reported on the table below):
- PMC_TRA and IPC_OUT have been measured here #50015.
- IMC_Losses are composed by:
- IMC_Mismatch: calculated doing (IMC_REFL_PD_locked - IMC_REFL_PD_offset) / (IMC_REFL_PD_unlocked - IMC_REFL_PD_offset) with the values of 21/11, which resulted in:
.
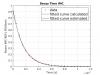
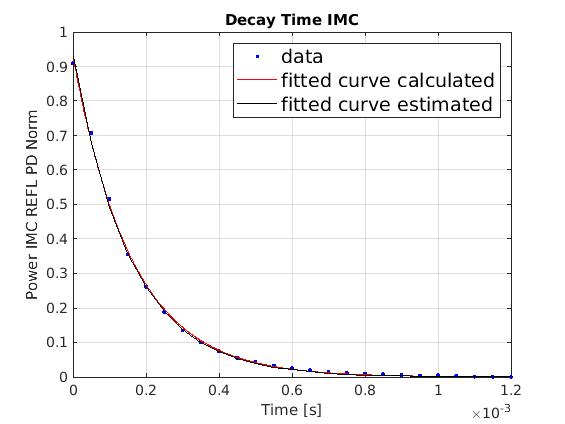
- The IMC throughput of 93% has been calculated fitting the IMC decay time with the measurements perfomed on 21/11 (#50087). However, these measurements are not very reliable. Therefore, here we estimated the value of the IMC_Throughput considering how much of losses was missing to match the IMC_TRA at the moment (as we have the power entering the IMC, and in the output of the IMC). Considering the IMC mismatch and "other losses", we are still missing 13%, which was attributed to the throughput losses. In order to see how much difference it would make in the decay time with this throughput loss, Fig. 1 shows the comparison of the two values: the black curve represents the decay time with the estimated value of throughput losses of 13% and the red curve shows the measured fit of the decay time correspoding to a throughput loss of 7%, as measured in #50087. As we can see, there's almost no visual difference, and probably the lack of better measurements to perform an average has not allowed a good estimation. This result also tell us that probably the decay time is not a good method to calculate the round-trip losses of the IMC cavity afterall.
- Moreover, we have 0.5% of "other losses" that can be better studied in VIR-0225A-18.
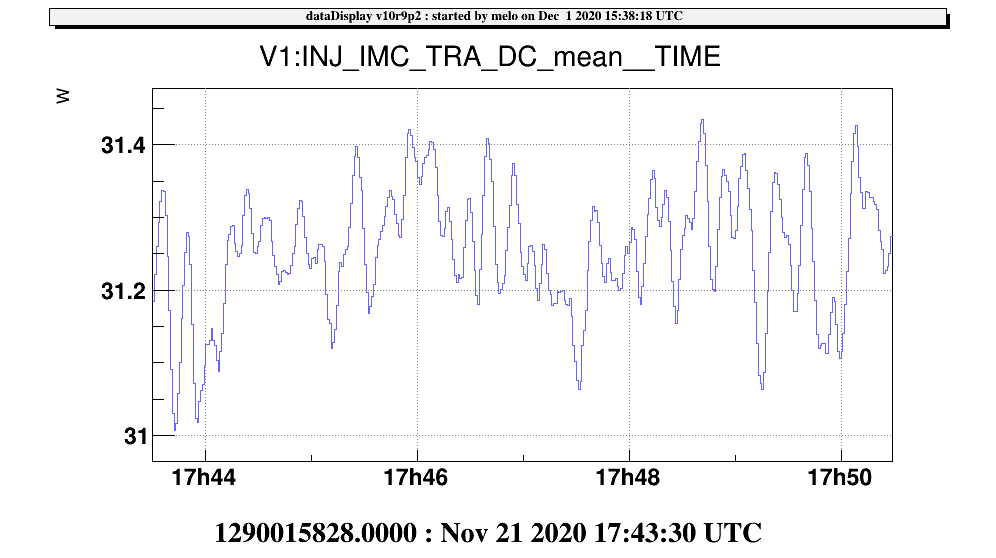
- Considering these losses, we should have 31.5 W in IMC_TRA, which is consistent with value on data display on that day (Fig. 2)
- IMC_Mismatch: calculated doing (IMC_REFL_PD_locked - IMC_REFL_PD_offset) / (IMC_REFL_PD_unlocked - IMC_REFL_PD_offset) with the values of 21/11, which resulted in:
- Between the IMC_TRA and the ITF input we have losses on: SIB1_M11 = 1% (#32354), Faraday SIB1 = 5% (#32354), IPC SIB1 = 1% (#40678), and other losses = 0.5% (VIR-0225A-18), accountig for 7.5% of total losses.
- In this configuration, we have at the end of the INJ chain 29.1W of power in the ITF input after the power increase.
| calculated losses (%) | measured power (W) | Reference | |
| PMC_TRA | - | 50.1 | Measured #50015 |
| 21.15% | |||
| IPC_OUT | - | 39.5 | Measured #50015 |
| IMC mismatch (6.8%) + IMC throughput (13%) + other losses (0.5%) | |||
| IMC_TRA | 31.5 | ||
| SIB1_M11 (1%) + Faraday SIB1 (5%) + IPC SIB1 (1%) + other losses (0.5%) | |||
| ITF_INPUT | 29.1 |
