Reports 1-1 of 1 Clear search Modify search
Environmental Monitoring (Environmental Monitoring)
Degallaix - 20:28 Wednesday 25 March 2020 (48809) Print this report
Excess environmental noise in North end building after the maintenance

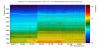
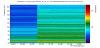
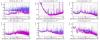
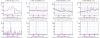
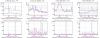
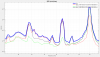
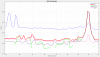
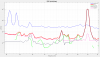
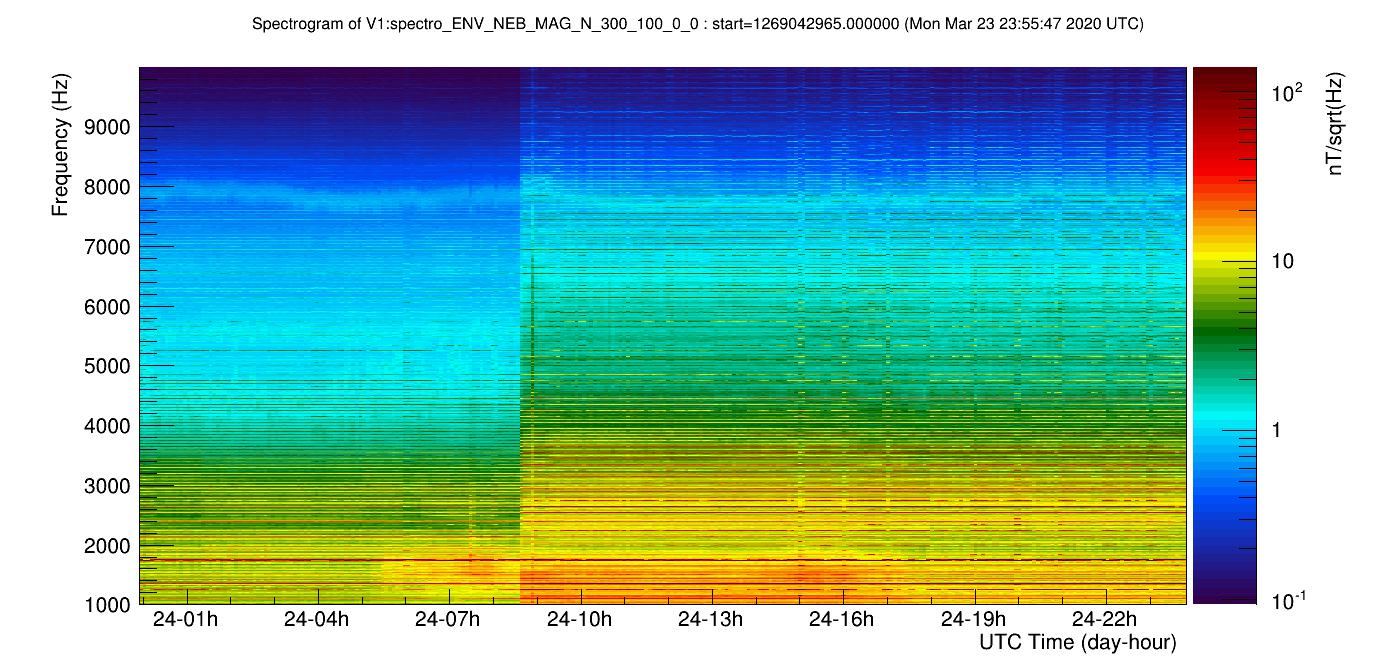
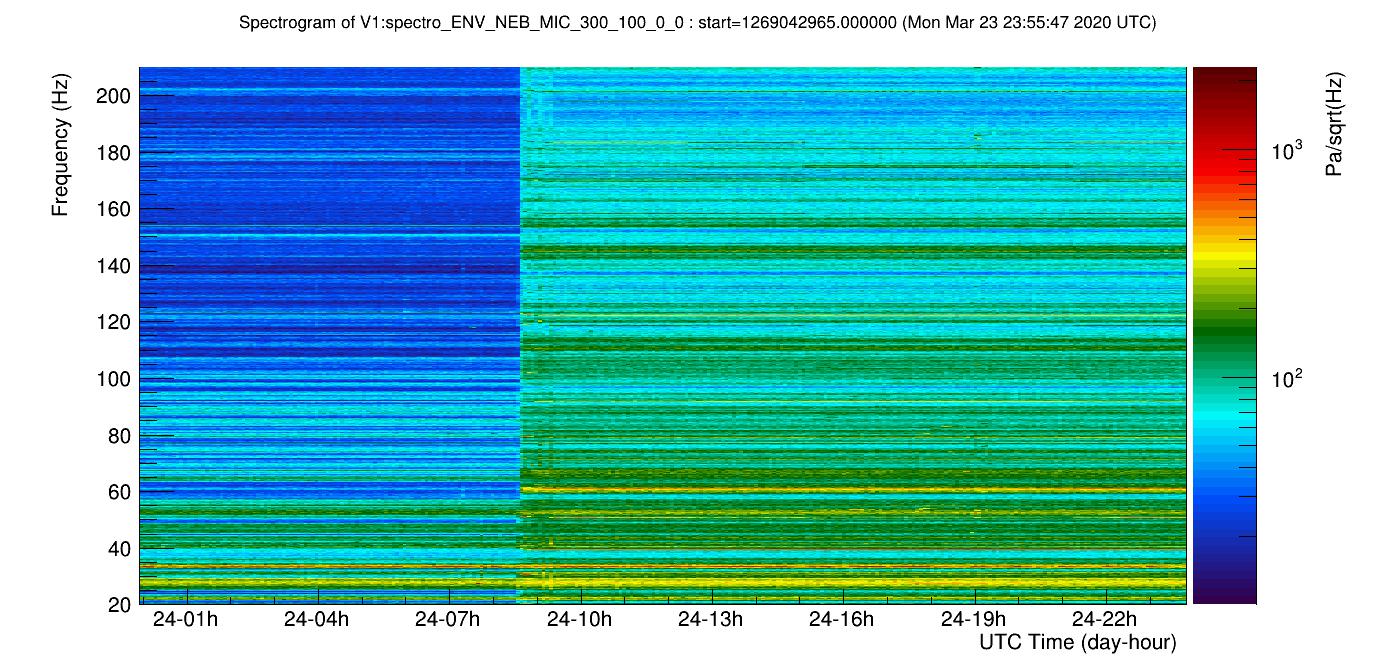
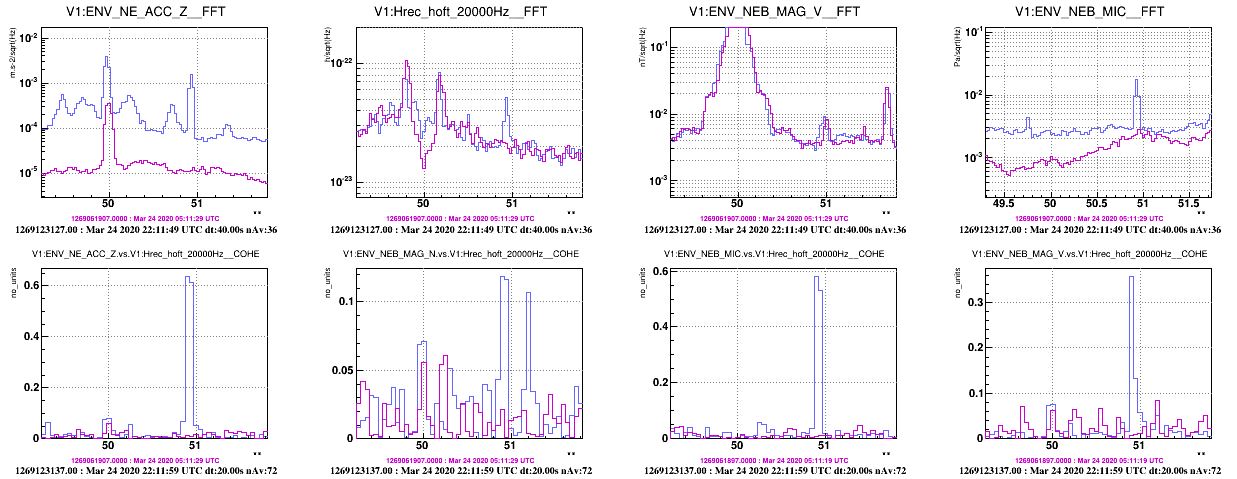
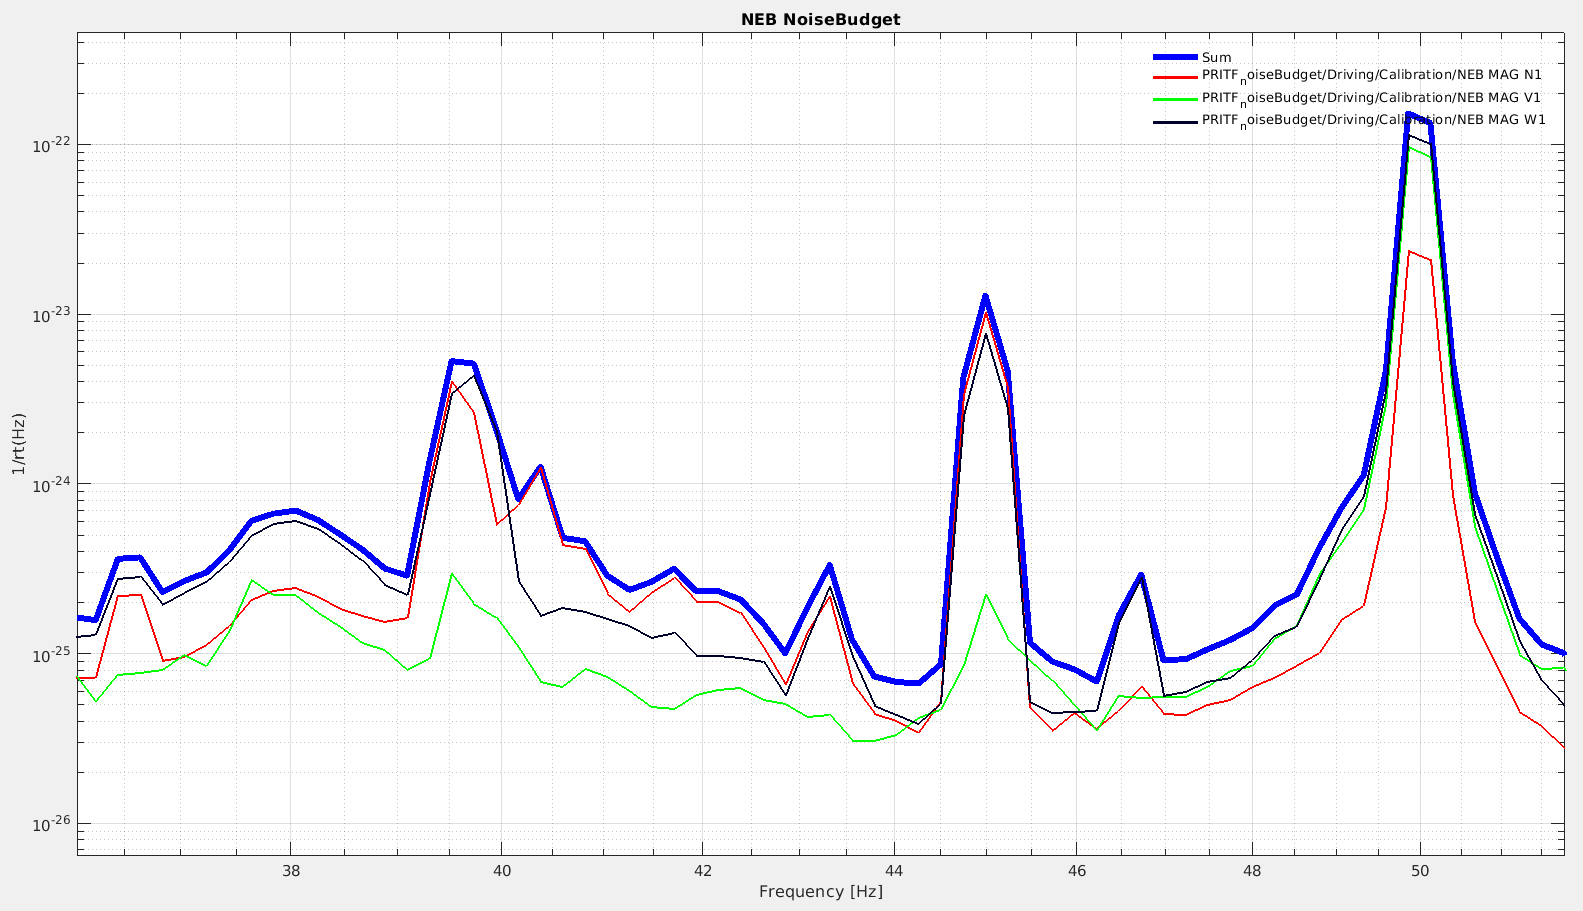
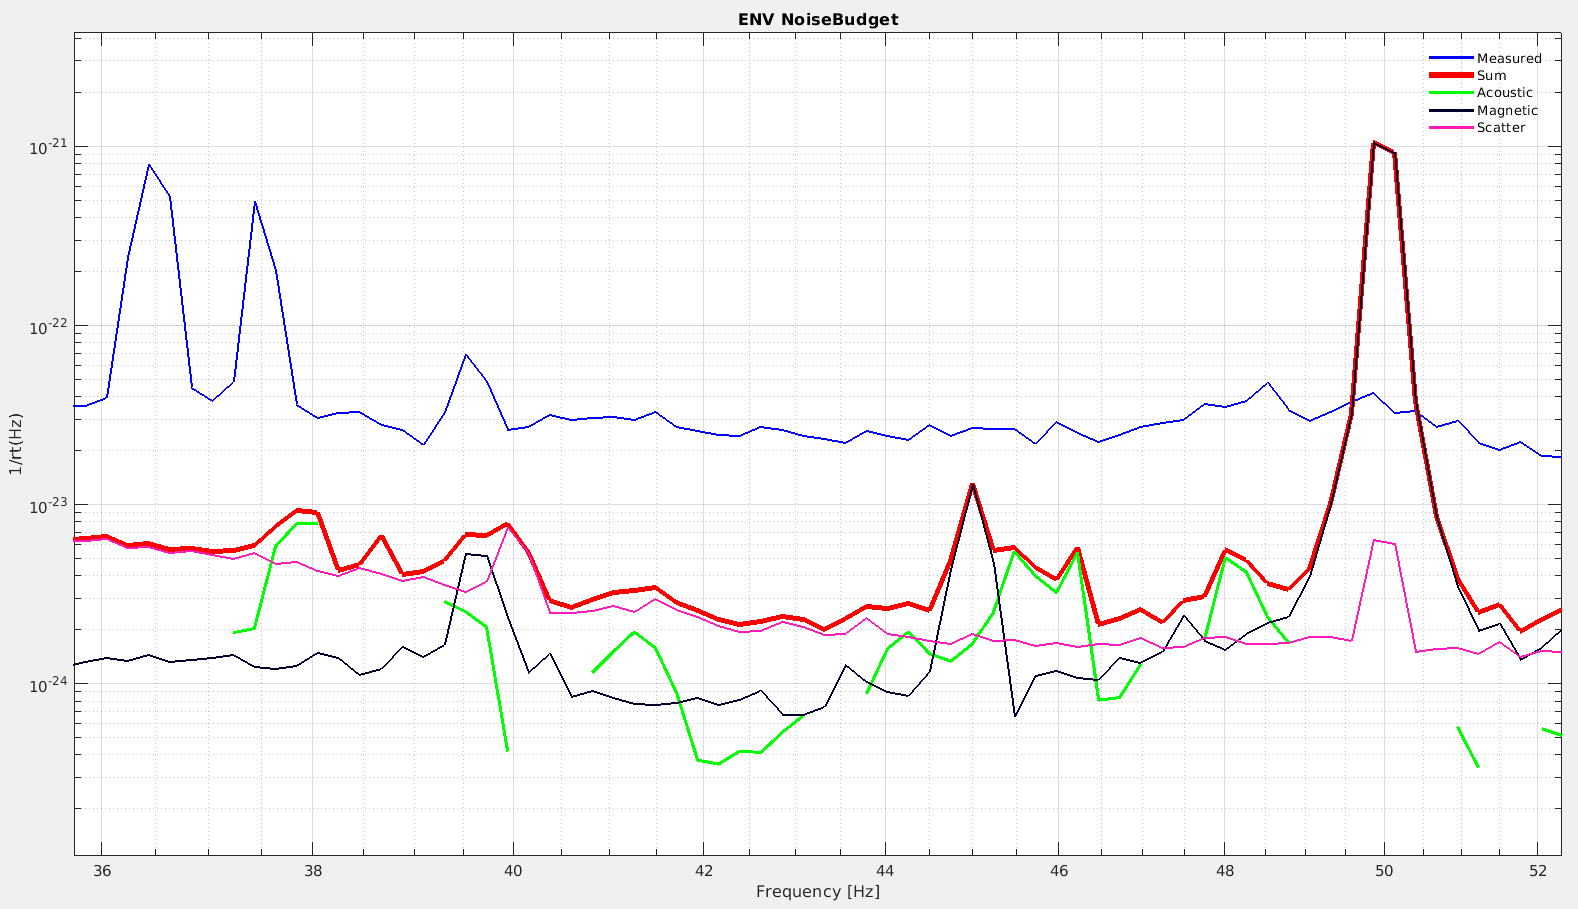
During the maintenance last Tuesday (24/03), following the data from the seismometers it must have been interventions in the West end building and then in the North one (between 8 and 9am UTC). The environmental noise (acoustic, magnetic) in the North end building has increased and then stays constant, looks like something noisy has been switched on. The West end building is fine.

I joined the spectrograms of the magnetic and acoustic probes.

Images attached to this report
Comments to this report:
fiori, paoletti - 18:51 Thursday 26 March 2020 (48820) Print this report

About the extra noise produced by the clean air flux machine at NEB (see F.Nenci report) we notice that:

  • there was a very large vibration noise of the tower (a possible path is vibration of clean air ducts that is transmitted to the chamber) but also some acoustic and magnetic noise: Figure 1
  • two narrow lines were excited in Hrec: about 39.6 Hz and 50.9 Hz
  • the 39.6Hz line is present in microphone and magnetometer, and there is coherence with Hrec at this frequency: Figure 2
  • the 50.9Hz line is present in the accelerometer and microphone (nothing in Magnetometer), and there is coherence as well. Figure 3
Images attached to this comment
tapia - 16:28 Monday 30 March 2020 (48863) Print this report

Apart from the peak at 39.6 Hz, the noise projection also shows that magnetic noise is also present at 45 and 46.7 Hz for the NEB North and West directions. As shown in figure 1.

If we compare the Enviromental noise budget between these two instants, we can see how these peaks are spoiling the sensitivity in the region between ~39 to 40Hz and ~44 to 47 Hz. Compare figure 2 (no peaks) and 3 (with peaks).

However the peak at 50.9 can not be seen at any direction of the NEB magnetometers as commented before.


Images attached to this comment
tapia - 19:28 Tuesday 31 March 2020 (48881) Print this report

The comparison of the noise projection between the figures 2 and 3 were performed at:

Figure 2 (without peaks), gps: 1269061907.

Figure 3 (with peaks), gps: 1269123137.

with a duration of 180 s each.

Search Help
×

Warning

×