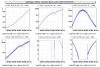
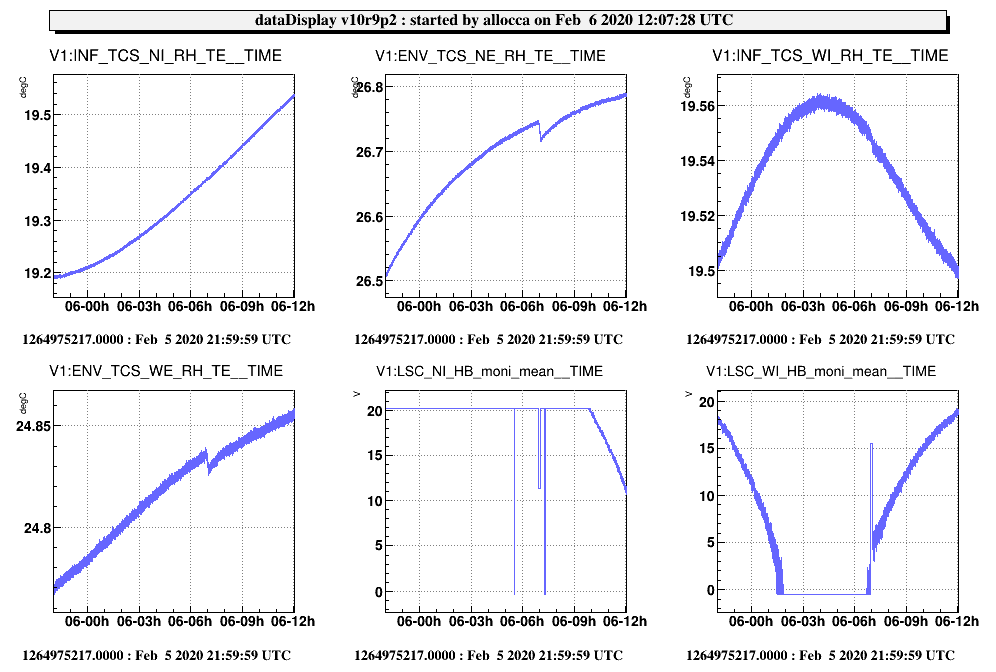
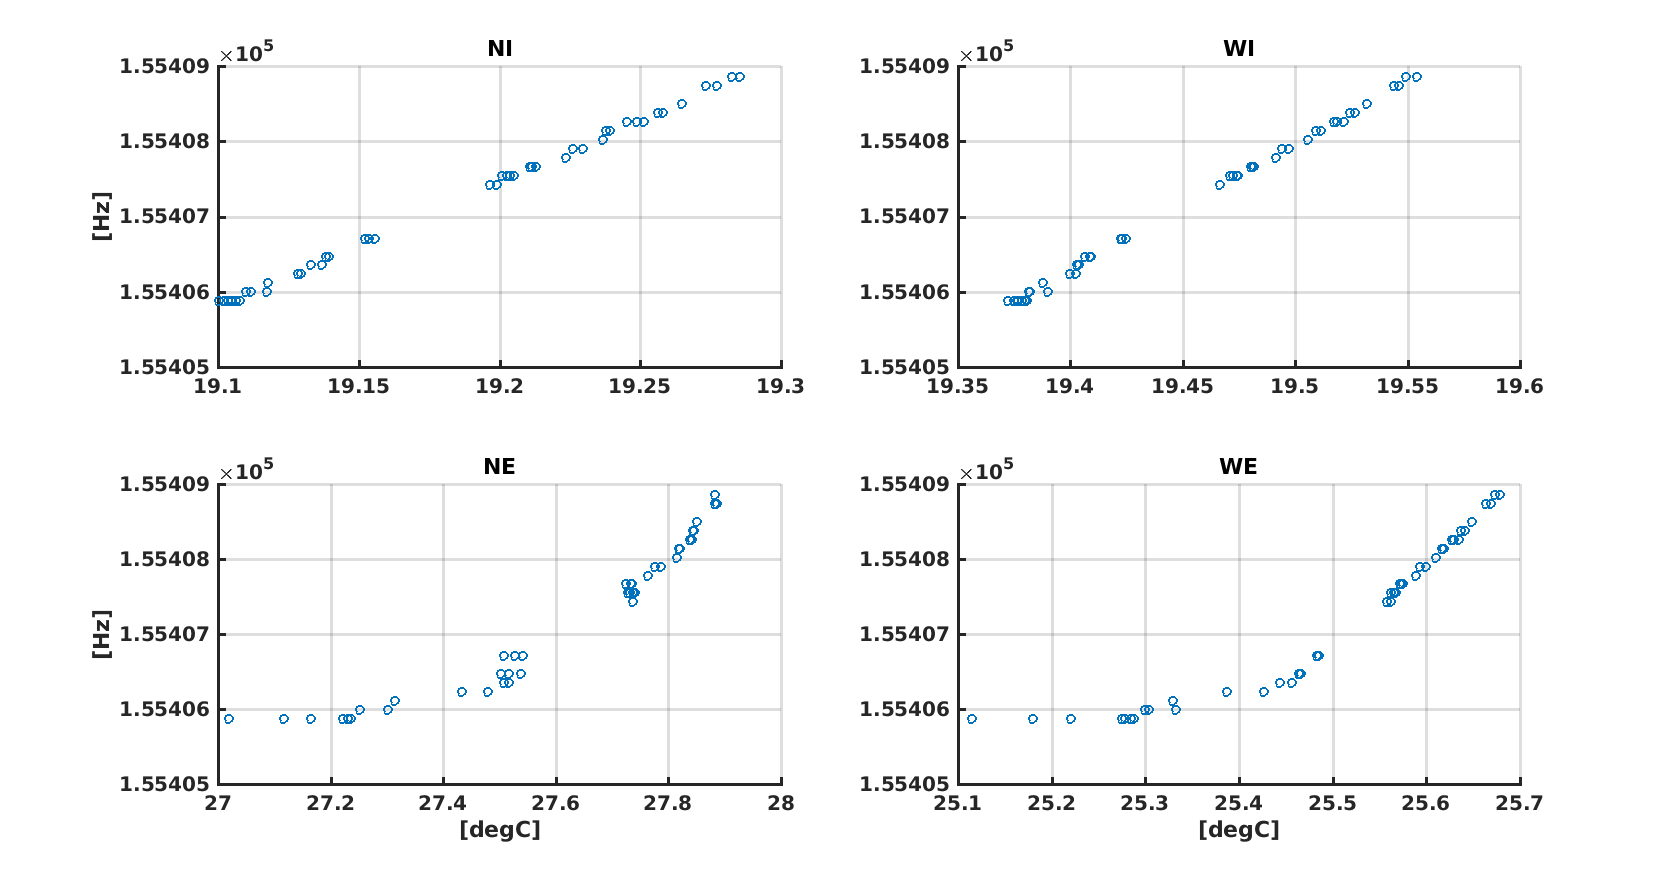
Last night, the setpoint of the NI heating belt has been changed by 0.3 K in order to change the temperature of NI test mass only. This test had the aim to verify whether the 155.408kHz peak belongs to the NI. If yes, the frequency of this line should move by a known amount, as computed below.
In figure 1, the temperature variation for the four test masses is shown for the analyzed period (gps1 = 5/2/20 22h00 UTC --> gps2 = 6/2/20 10h38 UTC). Moreover, also the correction given to the two heating belts is plotted. What was not expected is that both the temperature of NI and NE changes by approximately the same amount, which is, respectively:
deltaT_NI = 0.3K
deltaT_NE = 0.27K
A much smaller temperature variation is seen instead on the West test masses, also thanks to the etalon loop acting on the WI tower and keeping the WI temperature almost constant.
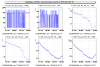
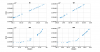
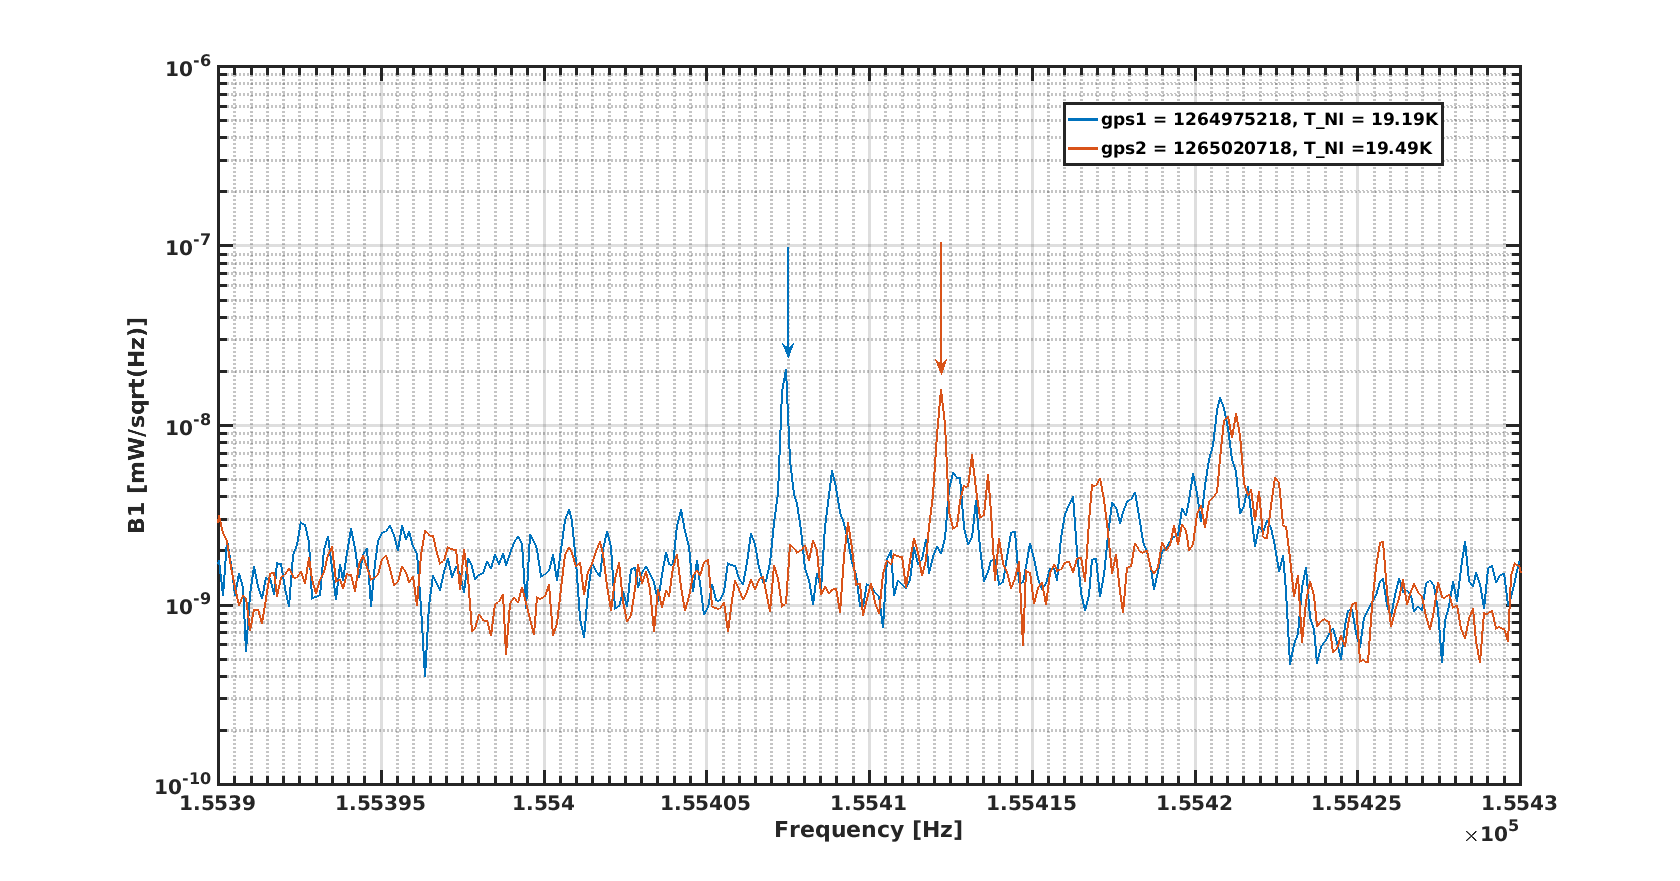
Taking into account the rate of frequency change reported in 42370, using the temperature variation for NI and NE, it is possible to compute the expected frequency change for the 155.4kHz line:
0.67Hz/K * (155.4kHz/7.8kHz) * deltaT_NE ≈ 3.6Hz
0.87Hz/K * (155.4kHz/7.8kHz) * deltaT_NI ≈ 5.2Hz
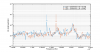
In the attached movie, a zoom around the frequency of interest of the B1 spectrum is shown. A plot is taken every 3500 seconds, and it is possible to follow the evolution in frequency of the 155kHz line.
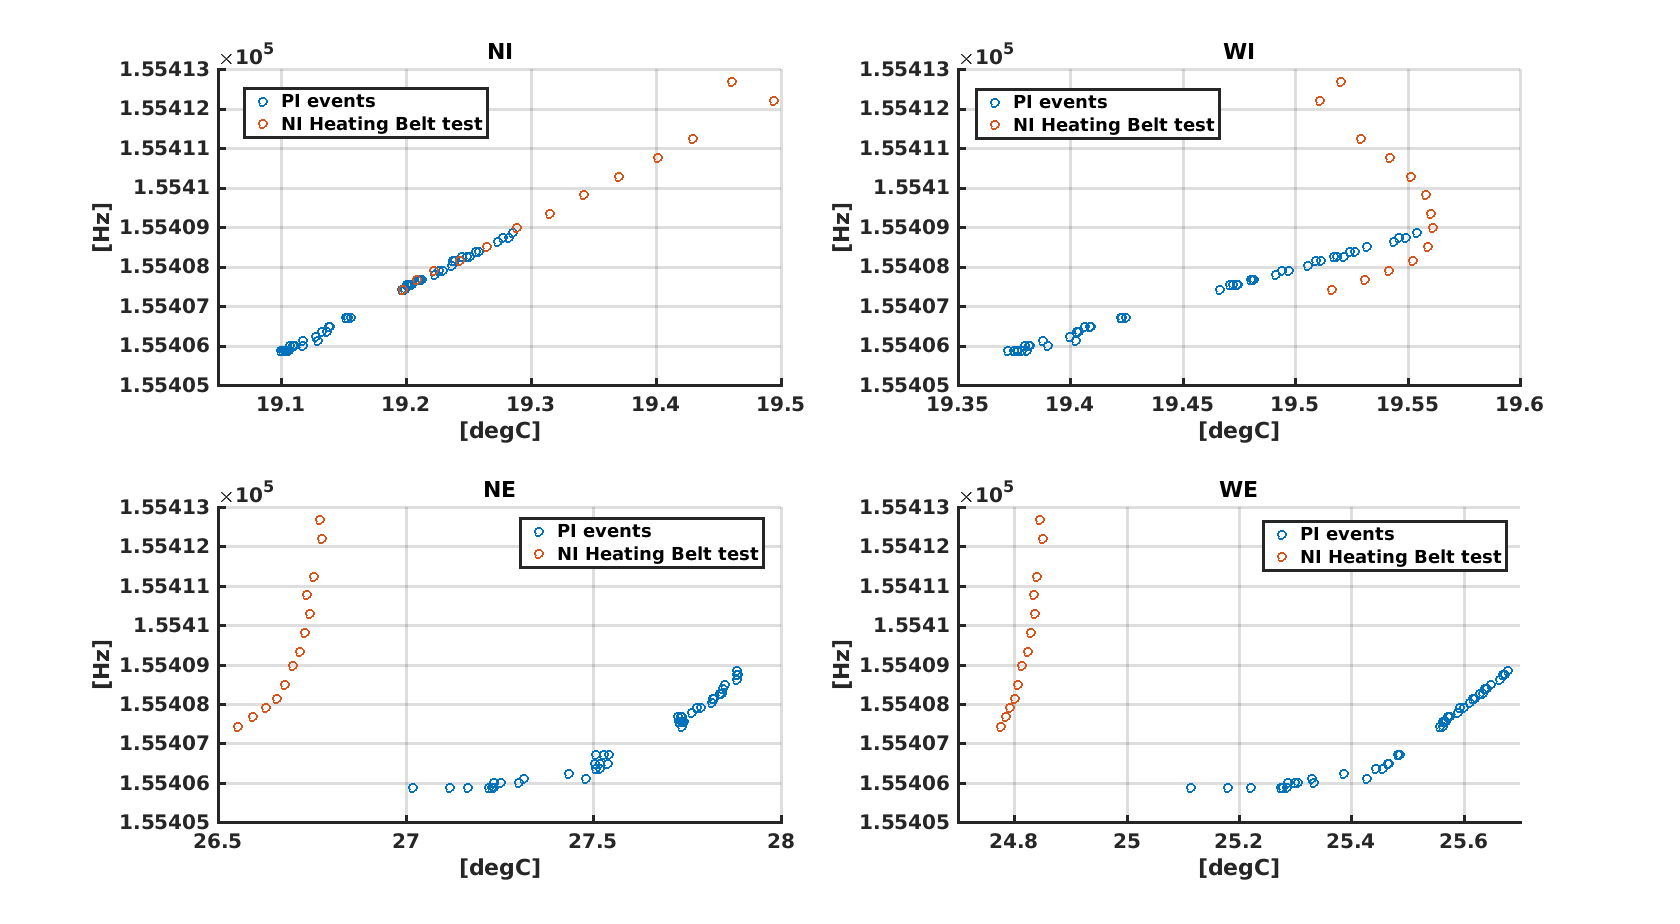
In figure 2, the two superimposed plots correspond to gps1 and gps2, respectively.
The measured frequency shift is ≈ 4.8Hz, which is compatible with the value expected for the NI test mass.