Reports 1-1 of 1 Clear search Modify search
AdV-COM (AdV commissioning (1st part) )
ruggi - 18:41 Friday 31 January 2020 (48311) Print this report
Excavator injecting noise near the central building

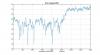
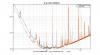
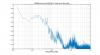
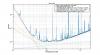
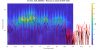
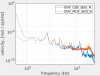
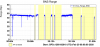
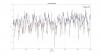
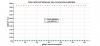
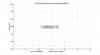
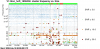
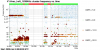
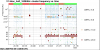
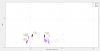
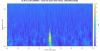
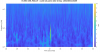
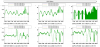
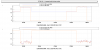
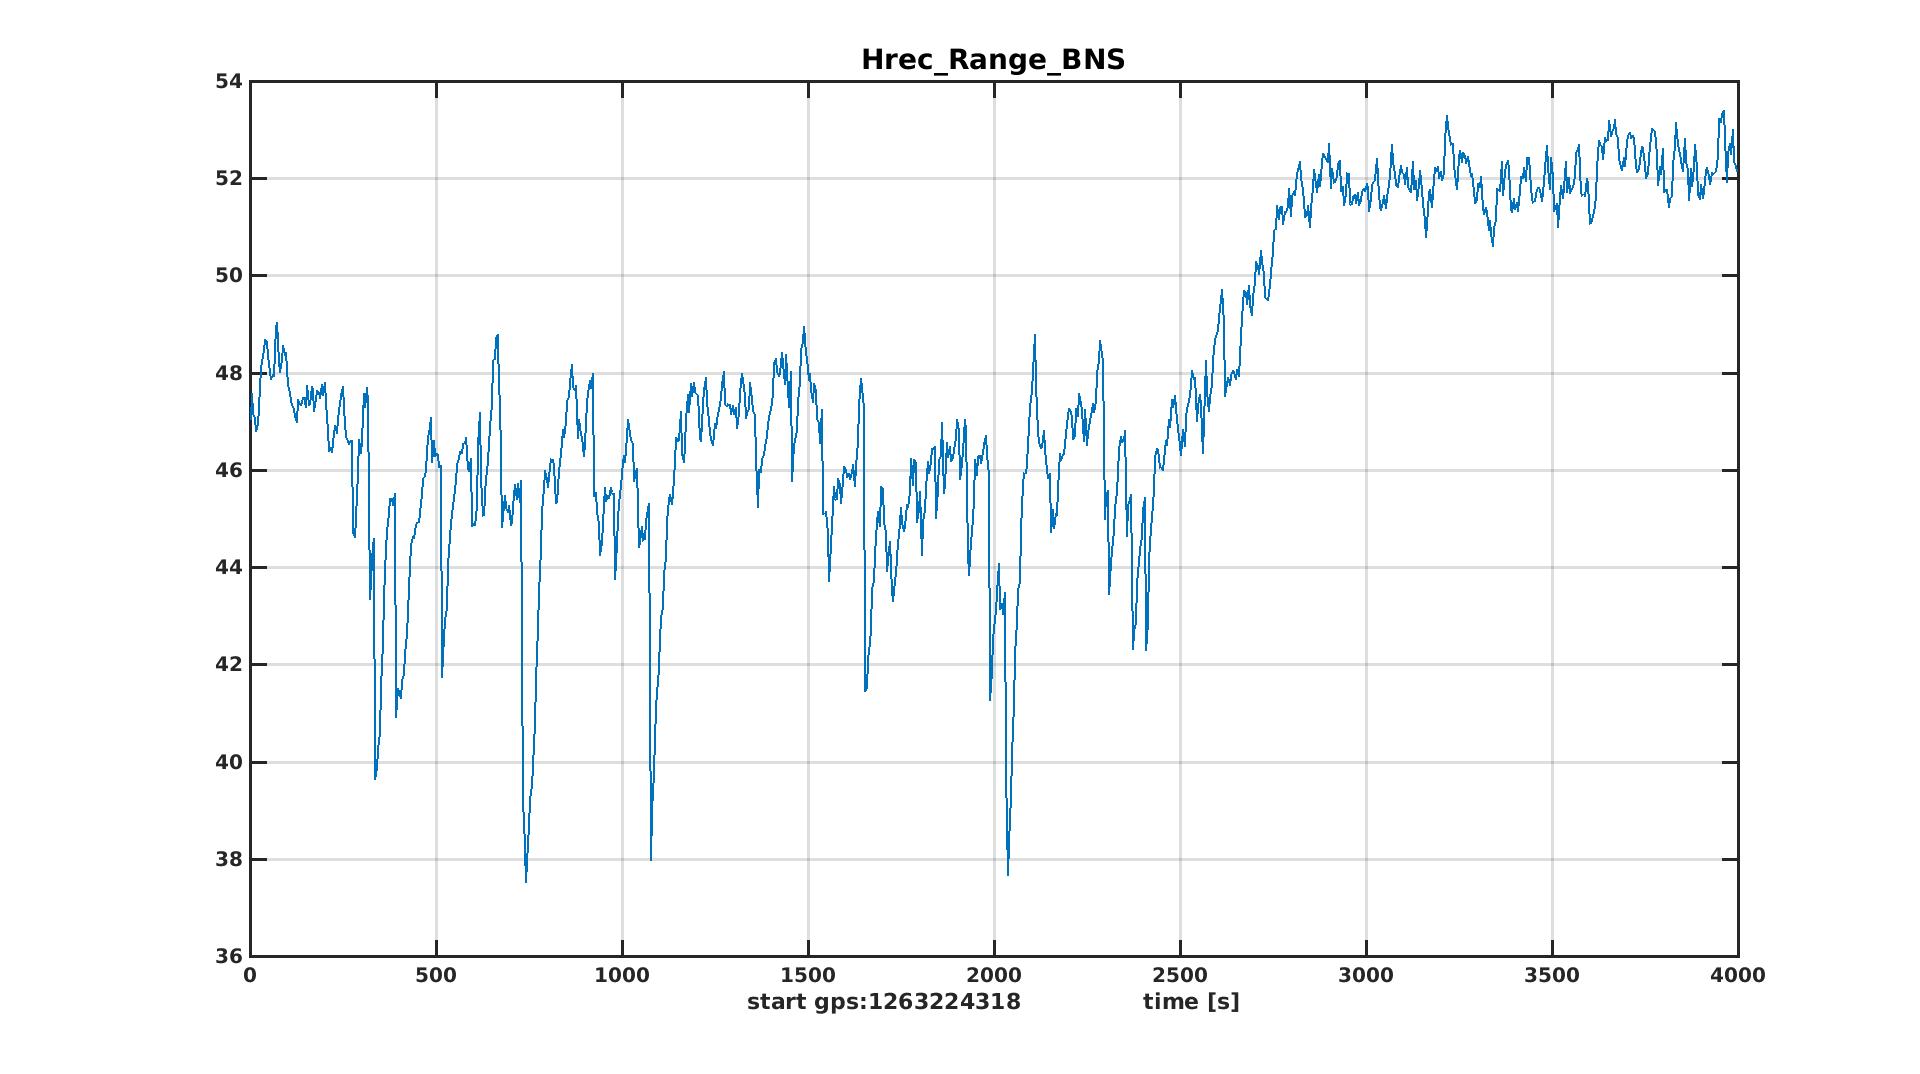
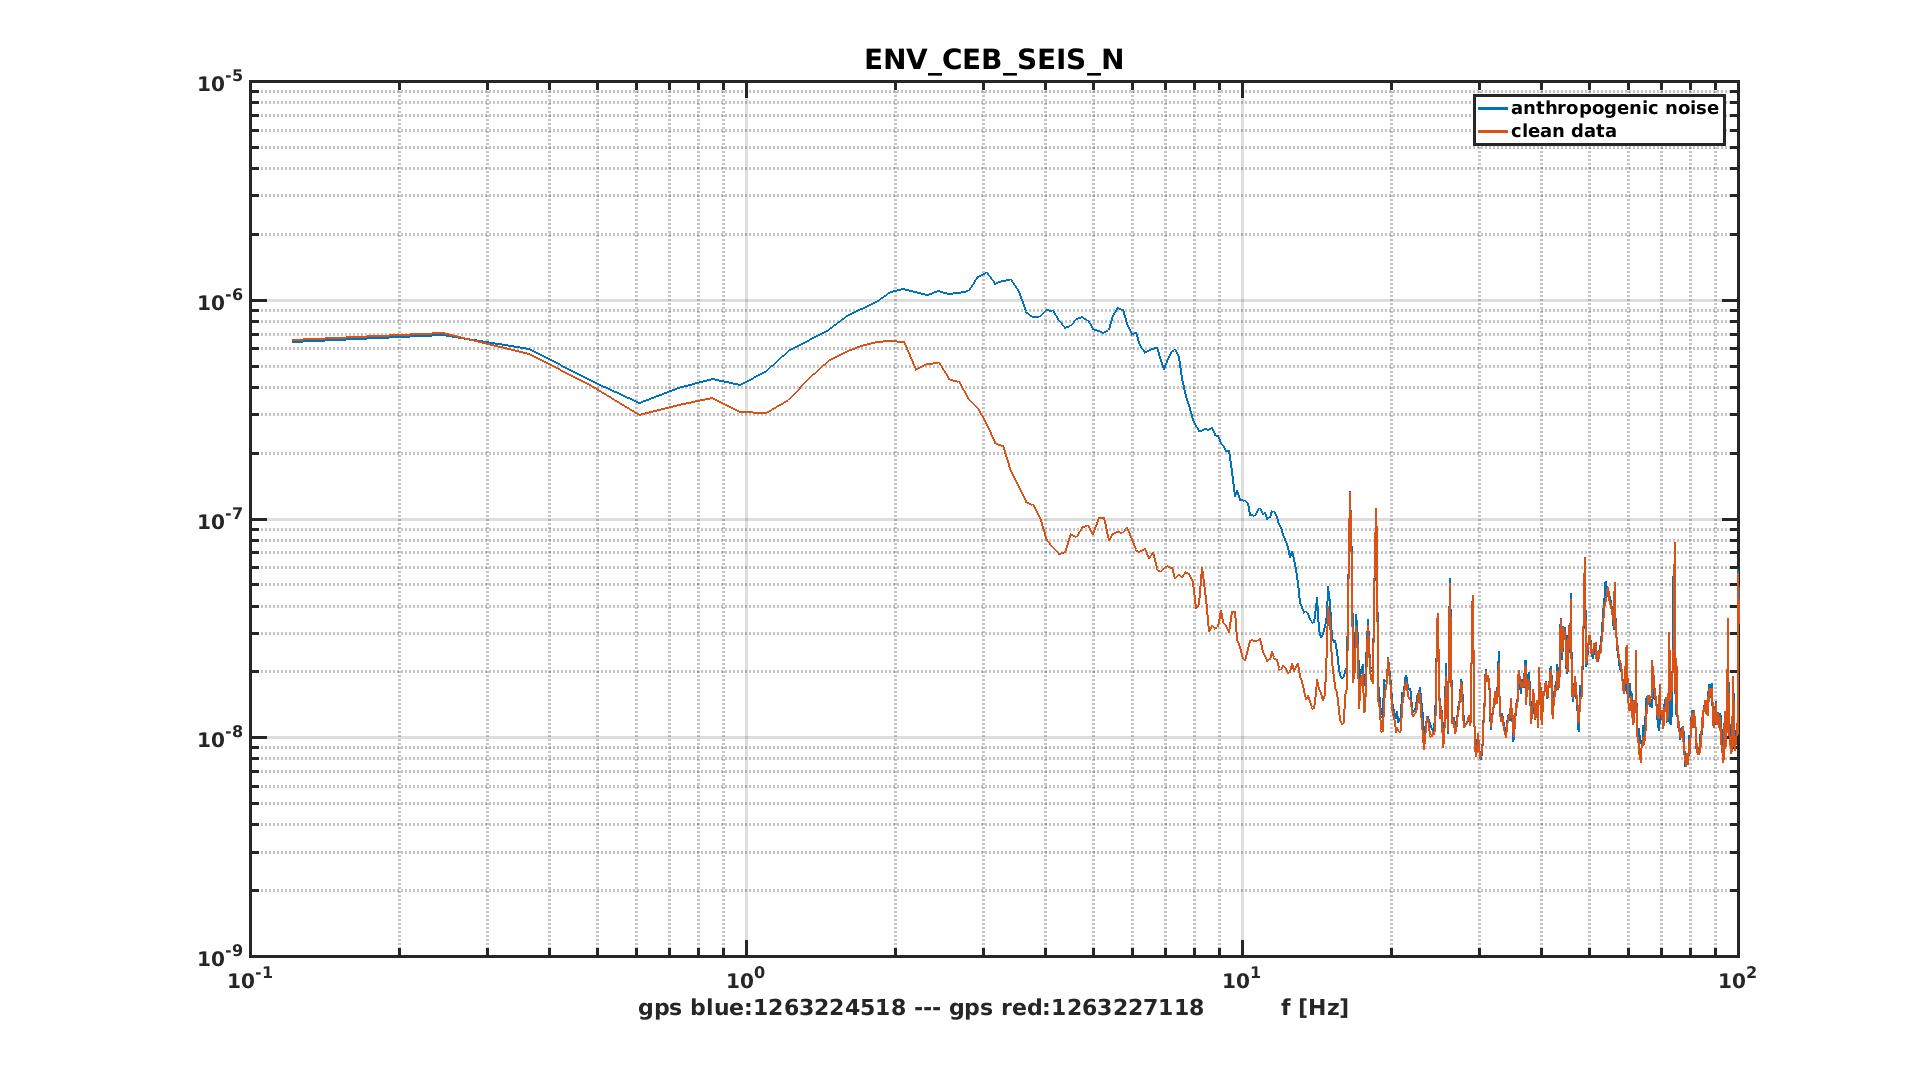
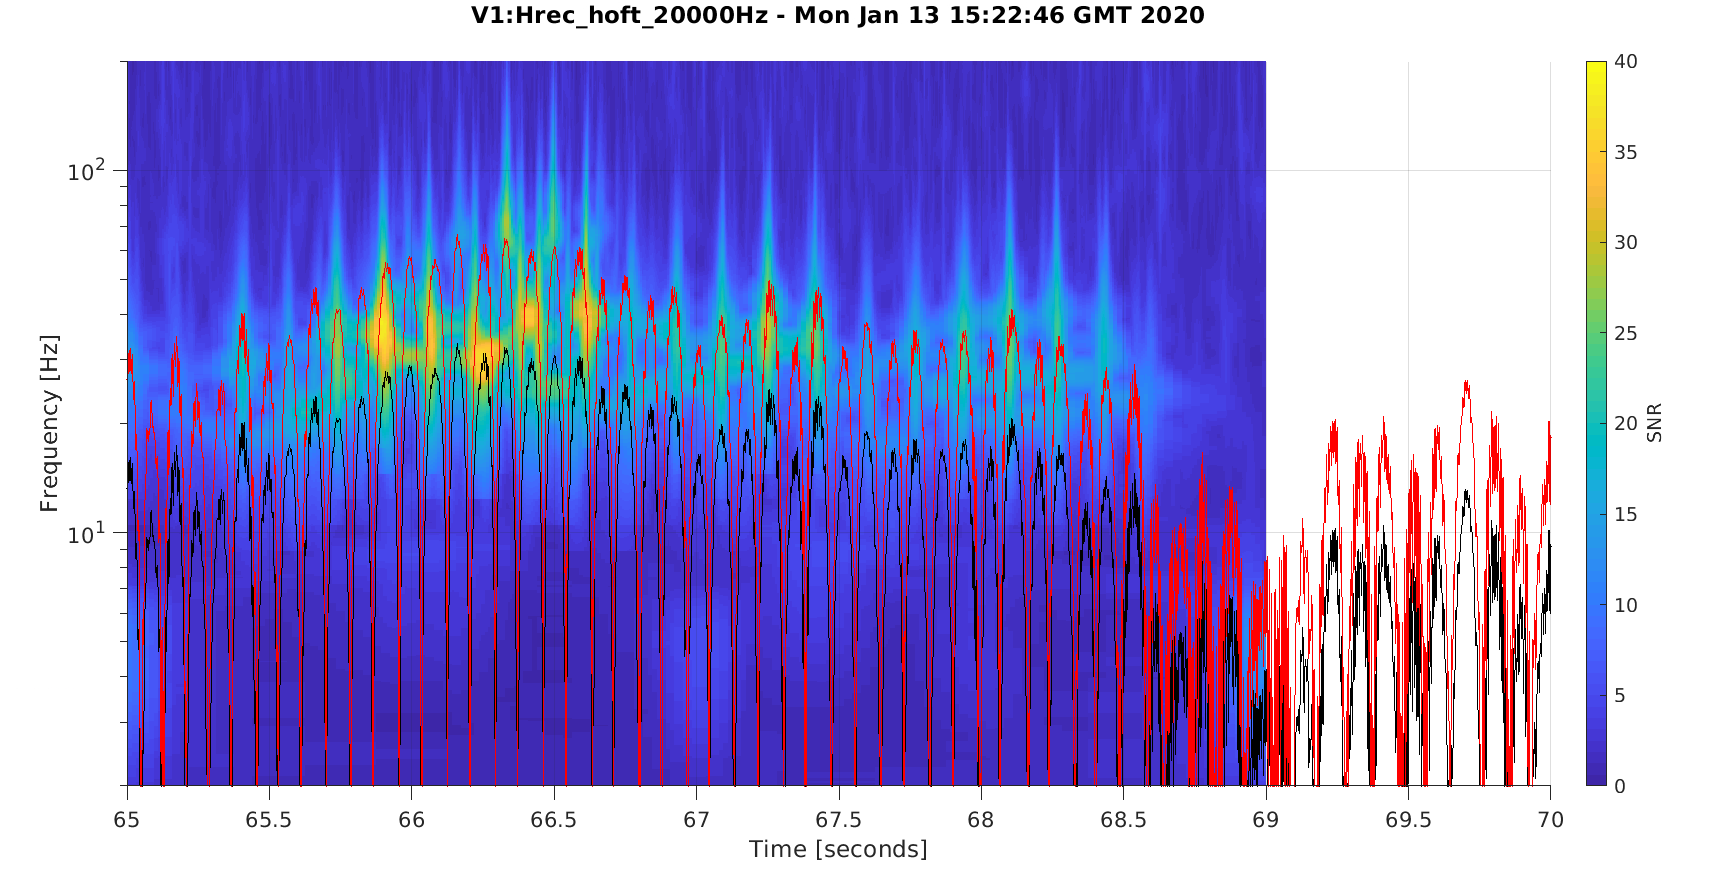
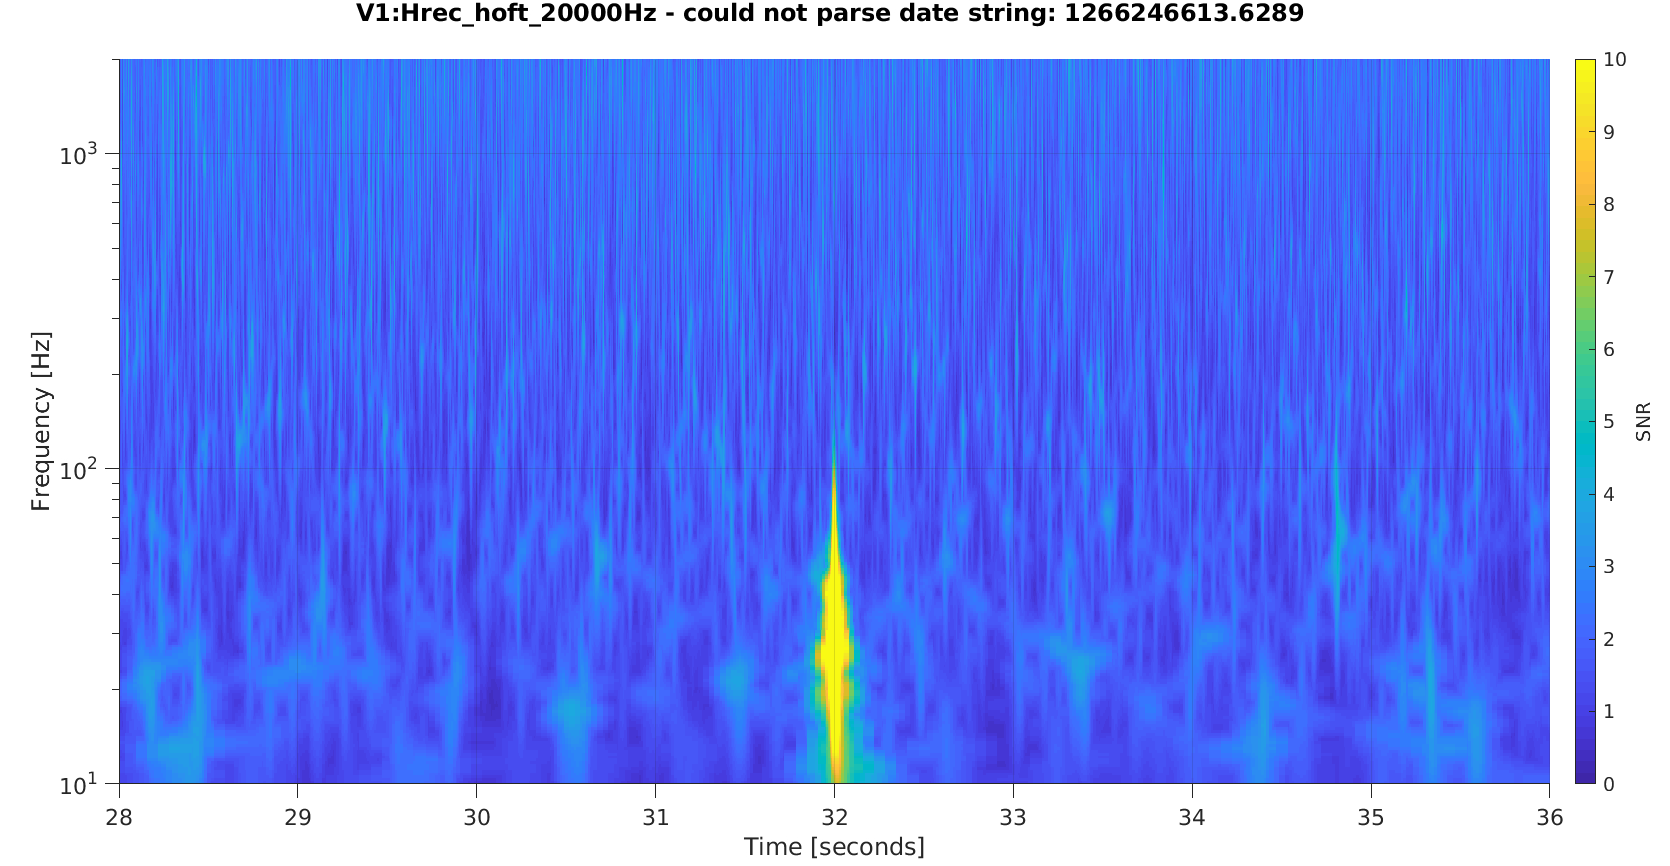
Two weeks ago an excavator working near the central building provided a persistent and maybe useful noise injection. The effect on the sensitivity was quite big (fig 1). One could consider this normal and forget about it, but the shape of the noise (fig 2) is so similar to the curve in quiet condition, that maybe it is worth to ask ourself what is the feedthrough of this noise towards the ITF.

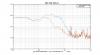
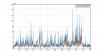
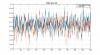
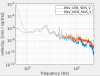
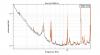
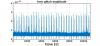
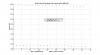
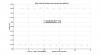
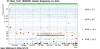
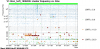
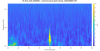
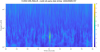
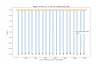
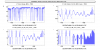
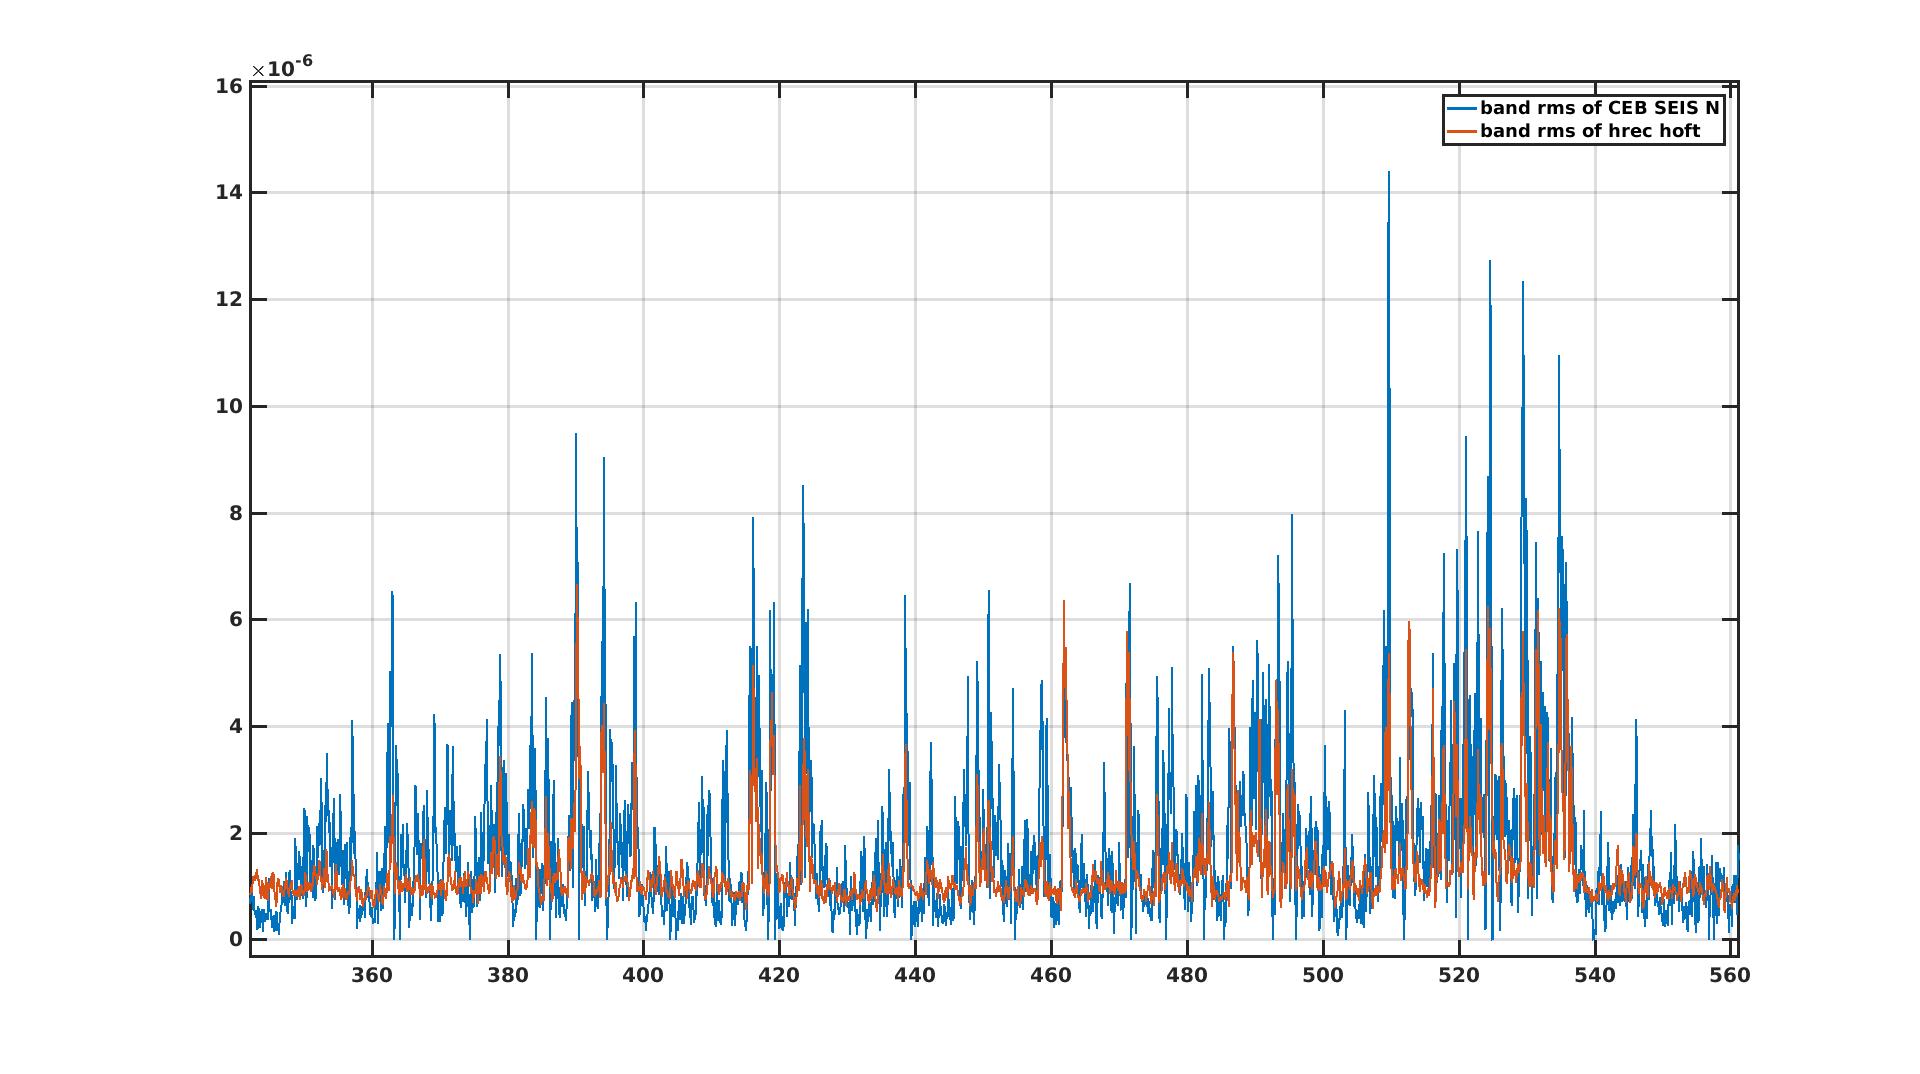
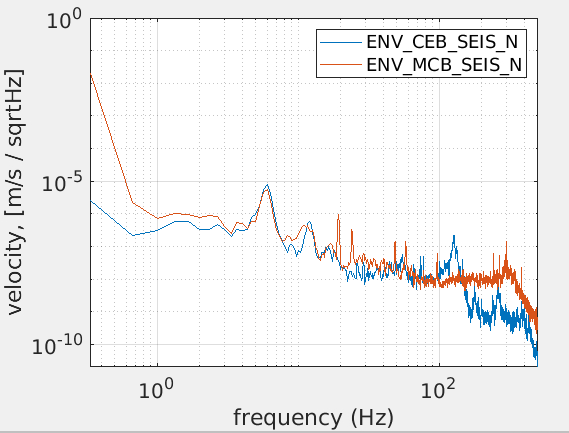
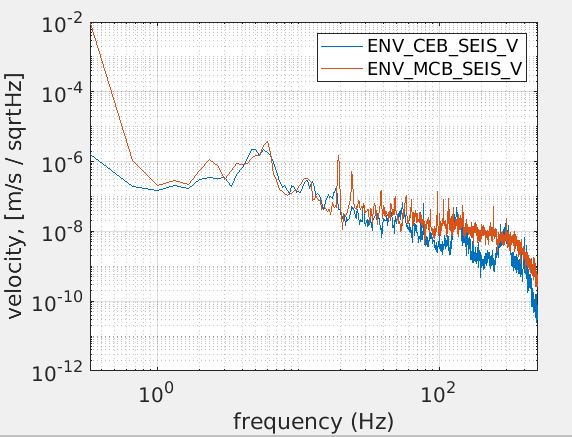
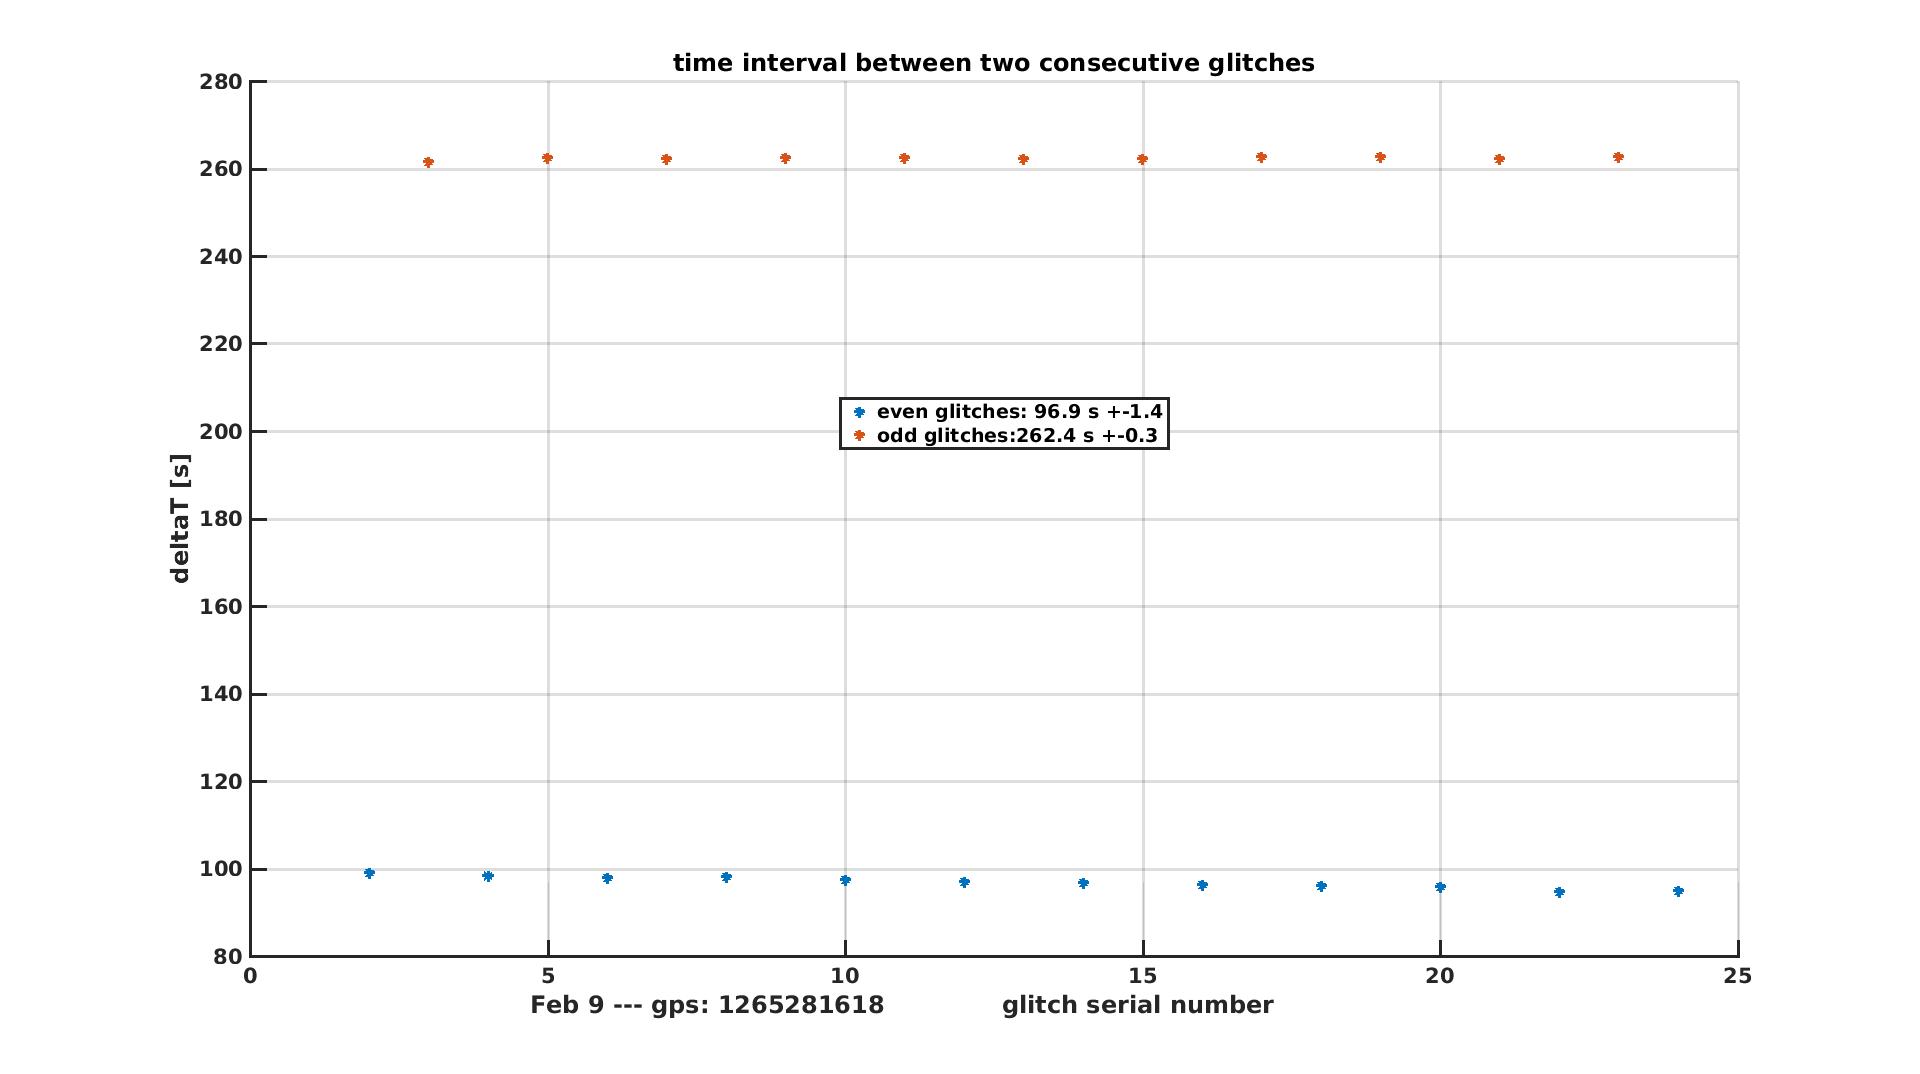
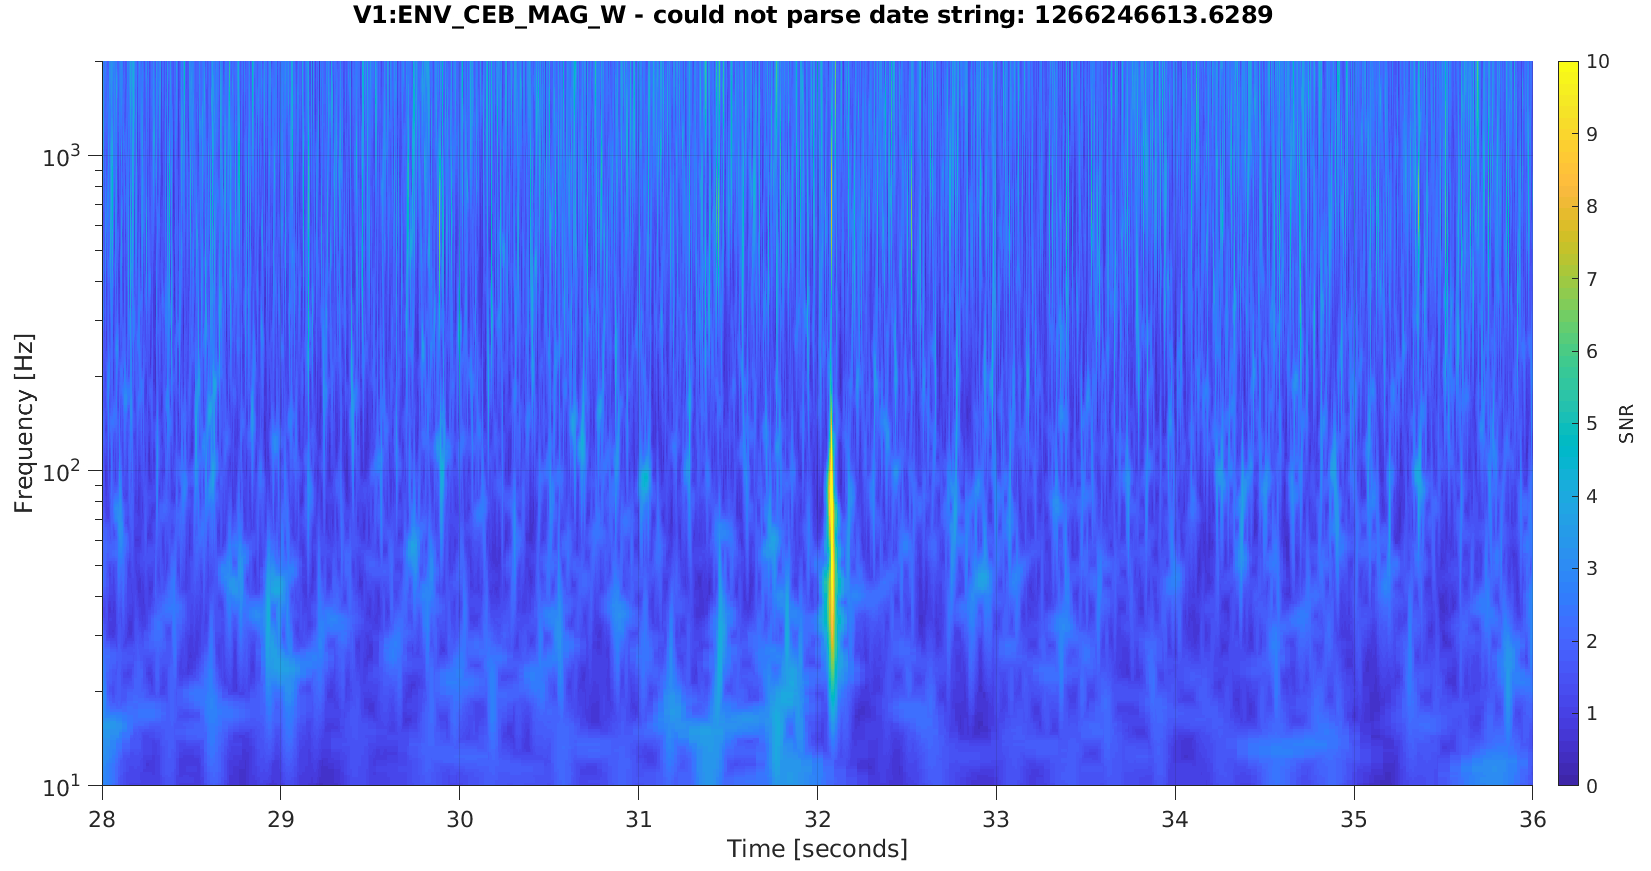
The shape of the ground noise sensed by the seismometer is shown in fig 3. We can see the typical effect of the anthropogenic noise, namely the increase of the 3 Hz region, but also a relevant component around 10 Hz, that rarely are interested by the variations of environmental conditions. Looking at the rms of the disturbance in time domain, one can recognize a series of short seismic events, producing very often a similar variation in the rms of ITF noise (fig 4). In fig 5, the coherence between the two rms signals, in order to certify that the seismic events in CEB were actually the source of noise (in that period, there was also agricultural activity near WEB).

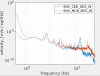
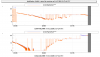
In fig 6 the 'polinomial decomposition' of the noise is shown, following the method shown in the previous entry. It is not obvious to me why I can use exactly the same components of the quiet noise, just rescaling the 1/f^4 and the 1/f^1.5. And, really amazing, the scaling factor looks the same for the two components. In fig 7, the quiet data, taken half a hour later, are fitted having divided by 2 the low frequency components.

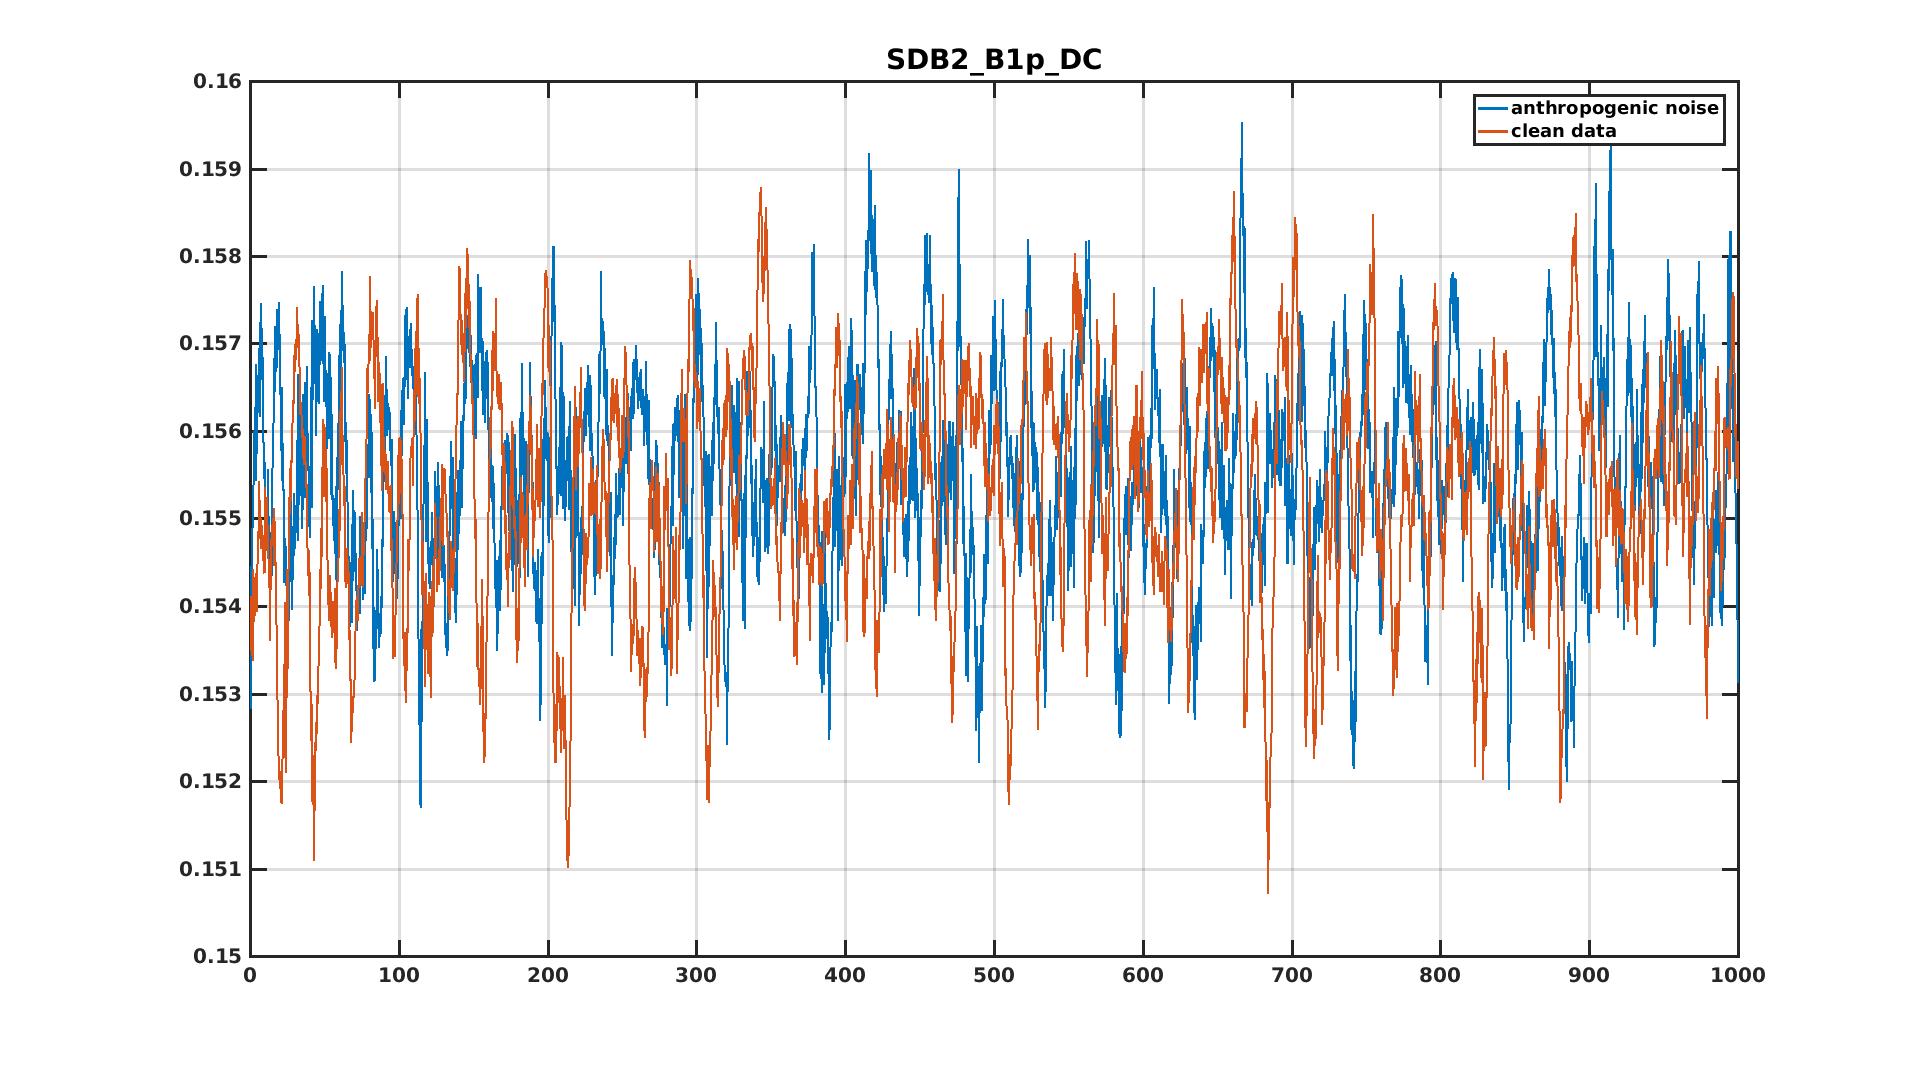
One possible explanation: the events do not add noise, but have an impact on the working point, so that the same noise have a doubled coupling factor. I say it, but it seems to me  definitely not realistic, because the working point cannot change in the timescale of a glitch. Moreover, there is nothing in the typical parameters sensible to the working point, like B1p_DC (fig 8).

I would propose to 'excavate' more around this topic.

Images attached to this report
Comments to this report:
ruggi - 15:36 Monday 03 February 2020 (48331) Print this report

The attached spectrogtram refers to an excavator event in which a resonance at 6 Hz was excited, and produced many harmonics in the sensitivity, up to 100 Hz. The object moving at 6 Hz has to be identified,

Images attached to this comment
mwas - 14:59 Tuesday 04 February 2020 (48345) Print this report

Looking at this glitch more closely with a scattered light modeled.

Figure 1 shows in color map h(t) as seen in a time frequency decomposition done by omega, and the black and red trace correspond to the scattered light expected from an object moving at the same speed as the speed measured by ENV_CEB_SEIS_N, either assuming scattering that sees the moving surface once (in black) or twice (in red). The observed glitches are broadly consistent with the seismometer signal, but the glitches are visible in h(t) only for every second peak in the measured speed. I don't have an explanation for that, why we would see only scattering for one sign of the speed (only positive maximum or only negative maximum of the speed).

/users/mwas/SBE/scatter_20200113/arches.m

Images attached to this comment
swinkels - 15:37 Tuesday 04 February 2020 (48347) Print this report
I had a quick look at the excavator noise with ... EXCAVATor, results are here. The winning channel is the main seismometer of the central building, with basically every other seismometer in the building high on the list as well. Since the big seismic shocks will be correlated through the whole building, it will be hard to narrow the location of the scatterer down beyond 'somewhere in the central building'. It might be interesting to try with other tools, but I suspect they will suffer from the same issue.
fiori - 19:44 Tuesday 04 February 2020 (48350) Print this report

the seismic signal at 6Hz had similar intensity also on MC building floor. This might point not to something resonating inside CEB, unless something in both buildings that have a very similar resonance? The coherence among the two sensor is almost 1 al the 6Hz peak.

might be crazy but, one candidate coul be towers: a shaking (pushing) of the NE tower vacuum chamber showed an excitation at 6Hz:

https://logbook.virgo-gw.eu/virgo/uploads/47122_1570479203_20191006_pushimg_vacuum_chamber.png

the tower in MCB is short though... it might be different

Images attached to this comment
ruggi - 11:04 Friday 21 February 2020 (48505) Print this report

Observing the BNS range during the lock of yesterday evening, one can notice a line quite fat (fig 1). Entering more in the details, it seems that the range was moving from a high level to a low level and viceversa (fig 2), staying on each level for a time relatively long (>100 s). The difference in terms of sensitivity is spread over a large interval of frequency, in a way similar to the one induced by the excavator noise (fig 3).

The second observation, likely correlated to the first one, is the presence of a persistent glitchness centered at 30 Hz (fig 4). Observing the rms of a whitened hrec (fig 5), it is clear that the glitchness has a double periodicity. The evolution of the time interval between two subsequent glitches (fig 6) shows that the involved device has a metronomic precision.


Images attached to this comment
ruggi - 12:50 Friday 21 February 2020 (48507) Print this report

The interval between two glitches was larger on wednesday night (fig 1). This night was similar to yesterday evening, but not equal.

Images attached to this comment
ruggi - 16:05 Friday 21 February 2020 (48513) Print this report

This is a glitchy period on Feb 9. The SNR was small, so I had to do manually the identification of the ripetitive pair, among some more randomic glitches. The resulting intervals are so stable and so close to the ones measured now, that I feel quite confident that the source is the same.

Images attached to this comment
mwas - 16:20 Friday 21 February 2020 (48511) Print this report

Looking back in time of these glitches in Omicron. The glitches have started on Feb 19 (figure 1), but they were actually much louder the day before on Feb 18 (figure 2)  after the new relay boxes on marionetta's have been installed. However they hav been sporadically visible at earlier timse (but less loud and only for a few hours), see figure 3 and 4 for Februry 7 and 16. Now they are much louder, with an SNR measured by omicron of ~25 (figure 5).

Collected glitche in h(t) from omicron using omicron print and selecting those with frequency between 30Hz and 35Hz with SNR > 11.

Figure 6 shows the time between two consequtive glitches for different data sets. There is always two sets of time delays around 100s and 300s. In some cases, like Feb 20, the time delay is really constant, in others there is a little bit more of scatter. From day to day the time delay between glitches seem to be changing.

Images attached to this comment
swinkels - 18:04 Friday 21 February 2020 (48517) Print this report
I ran a full omicron scan over one of the glitches from yesterday, results are here. The glitches are indeed visible on the central building magnetometers, but they appear even stronger in ENV_CEB_UPS_VOLT_T, and vaguely in some injection signals.
mwas - 18:09 Friday 21 February 2020 (48515) Print this report

I have looked at two random examples of these glitches. Figure 1 and 3 show them in h(t), and figure 2 and 4 show that each time there is a glitch in the central building magnetometers. An odd thing is that the glitches in the magnetometers seem to be about 100ms after the glitch in h(t). I expect magnetometers can't be disturbed by the ITF control for such relatively small glitches, so it is not h(t) glitches that are causing glitches in the magnetometers. But rather that the switching device that is causing the glitches in h(t) is also causing glitches in the magnetometers.

Below is a list of glitches in h(t) (as seen by omicron) and a yes or no if the a corresponding glitch in ENV_CEB_MAG_W is found in omicron, in about 40% of cases there is one. In most cases when omicron doesn't see a glitch in the magnetormeter, I can't find it either.

# time-clustered triggers, dt = 0.10000s
# peak time [GPS]
# peak frequency [Hz]
# SNR [-]
1266286283.8008 31.40 23.42 n
1266286400.0039 31.40 22.23 n
1266286678.1367 31.40 22.55 n
1266286794.0820 31.40 23.98 n
1266287072.8867 31.40 23.24 y
1266287188.7539 31.40 23.45 n
1266287468.3320 31.40 25.35 y
1266287584.1602 31.40 22.85 n
1266287864.6602 31.40 25.76 y
1266287980.3477 31.40 24.86 n
1266288376.4648 31.40 23.93 n
1266288657.6523 31.40 24.75 y
1266288773.0273 31.40 25.85 y
1266289054.0430 31.40 28.01 y
1266289168.8008 31.40 25.69 n
1266289449.3477 31.40 26.64 y
1266289563.8711 31.40 27.14 n
1266289843.7461 31.40 26.73 n
1266289958.3633 31.40 25.02 n
1266290236.9023 31.40 26.54 y
1266290351.6914 31.40 24.93 n
1266290629.9414 31.40 24.51 y
1266290744.7070 31.40 23.44 n
1266291136.8867 31.40 25.24 n
1266291413.8633 31.40 24.92 y


Images attached to this comment
Paoletti - 21:06 Friday 21 February 2020 (48519) Print this report

An activity reported during Tuesday's maintenance is "a change of a different chiller with filters":

https://logbook.virgo-gw.eu/virgo/?r=48484

Does this mean that a different device has been put into operation?


chiummo - 21:26 Friday 21 February 2020 (48520) Print this report


The hardware configuration of the chillers was restored around 11h30 utc, as reported in the entry.


swinkels - 23:28 Friday 21 February 2020 (48521) Print this report
Assuming that the pattern of glitches with alternating short and long intervals is caused by some on-off sequence, I did the following steps:
-get the times of 2 hours of glitches using the command
omicron-print channel=V1:Hrec_hoft_16384Hz gps-start=1266249618 gps-end=1266256818 freq-min=25 freq-max=35 snr-min=15
Taking the difference between showed alternating intervals of roughly 83 and 269 seconds. Since two intervals were too long, 2 fake glitches were inserted at the approximate position
-generate a square-wave signal that flips sign at the moment of the glitches
-do a brute-force correlation between this signal and all channels in trend.ffl. The winning channel is LSC_NI_HB_moni_mean, which shows perfect correlation. This channel is likely is some monitor of the current sent to the heating belt that is used to actuate on the NI etalon. Fig 2 shows that this is indeed correlated to glitches in the Hrec (band-passed from 25 to 35 Hz). Fig 3 shows that the signal is indeed going crazy since a few days. To be understood by the experts if this is some numerical issue with the digital control loop, or with the actuator itself.
Images attached to this comment
masserot - 10:18 Saturday 22 February 2020 (48524) Print this report

This morning  the PyEtalon was stopped as it s not anymore used for the Etalon control since few weeks

The first plot shows for NI and WI:

  • the error  LSC_Etalon_{NI,WI}_RH_ERR
  • the command LSC_Etalon_{NI,WI}_HB_cmd
  • and the readout of the correction applied LSC_Etalon_{NI,WI}_HB_moni

One can see that

  • there is no digital noise issue as there is no glitches in the LSC_Etalon_NI_HB_cmd and as the WI Etalon works correctly too
  • the troubles on NI Etalon control started from the 20200215 with an increase of  these troubles in the last days

The last plot shows

  • the DAC channel LSC_{NI,WI}_HB_cmd_100Hz
  • and the HB driving monitoring LSC_{NI,WI}_HB_moni

The 2 DAC channels are coming from the same DAC1955 mezzanines . According this, one may supects some troubles at  the NI HB driving par level.

Images attached to this comment
dattilo, magazzu - 0:22 Sunday 23 February 2020 (48527) Print this report
As a follow up of the analysis of Bas (#48521) and Alain (#48524) on LSC_NI_HB_moni, we made a check of the NI heating belt power supply.
At around 22:00 UTC we went in TCS room where the power supply is located, and also looking at its analog display, we saw that it was delivering intermittently, as indicated by the LSC_NI_HB_moni signal.
We found that this faulty operation was in turn caused by a failure of its fans: in this situation the power supply was periodically going to block for thermal protection.
We replaced the power supply with a new one of the same kind (Kert 420). During the replacement we temporarily opened the NI etalon loop, as recommended by Maddalena.
Now the loop seems working regularly. Just to mention that the moni signal of NI is a bit more noise than WI at higher f (attached fig), while at lower f, the WI corr signal is nosier than NI.

Images attached to this comment
menzione, dattilo - 14:20 Sunday 23 February 2020 (48535) Print this report

Etalon power supply is working fine. (plot attached)

Images attached to this comment
Search Help
×

Warning

×