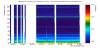
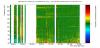
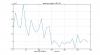
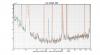
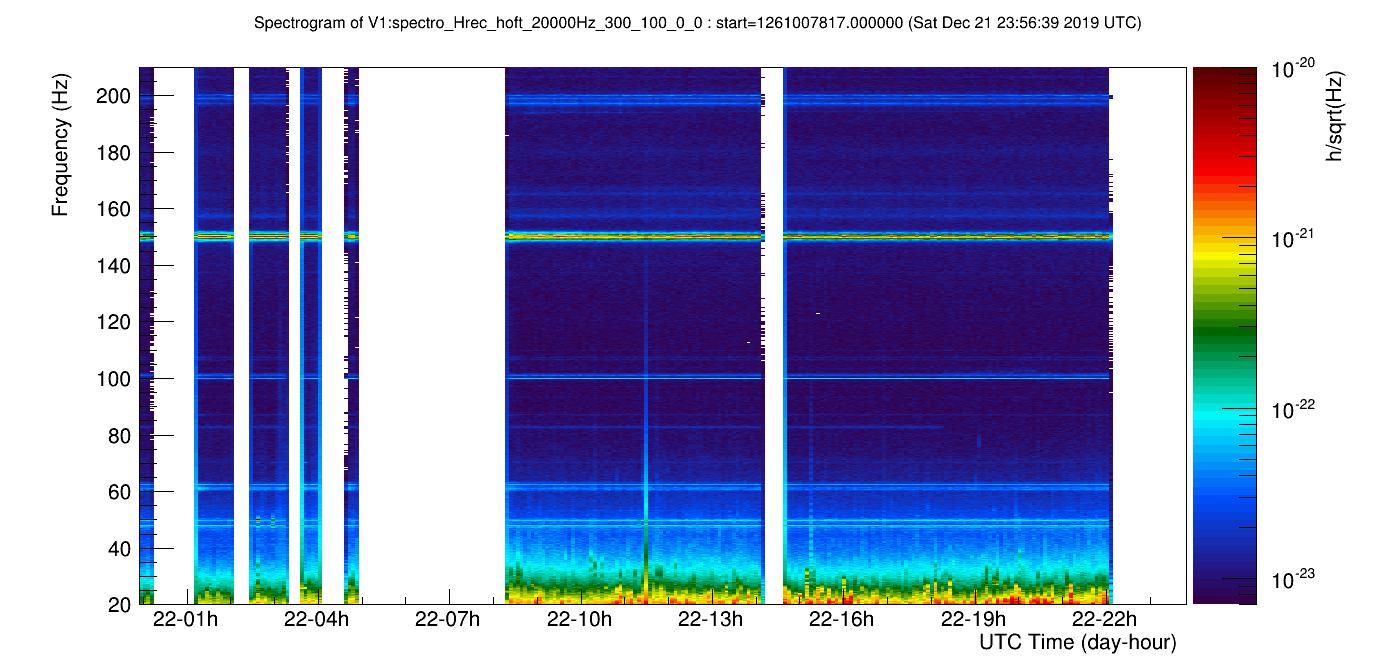
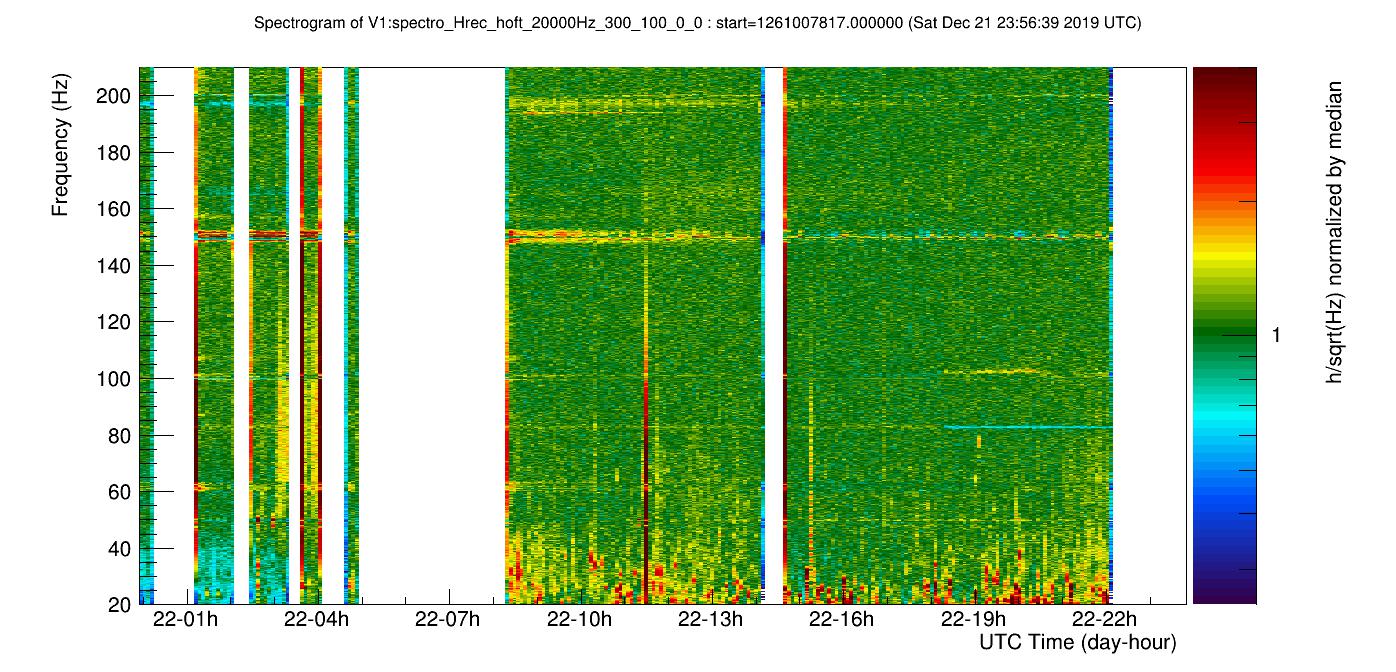
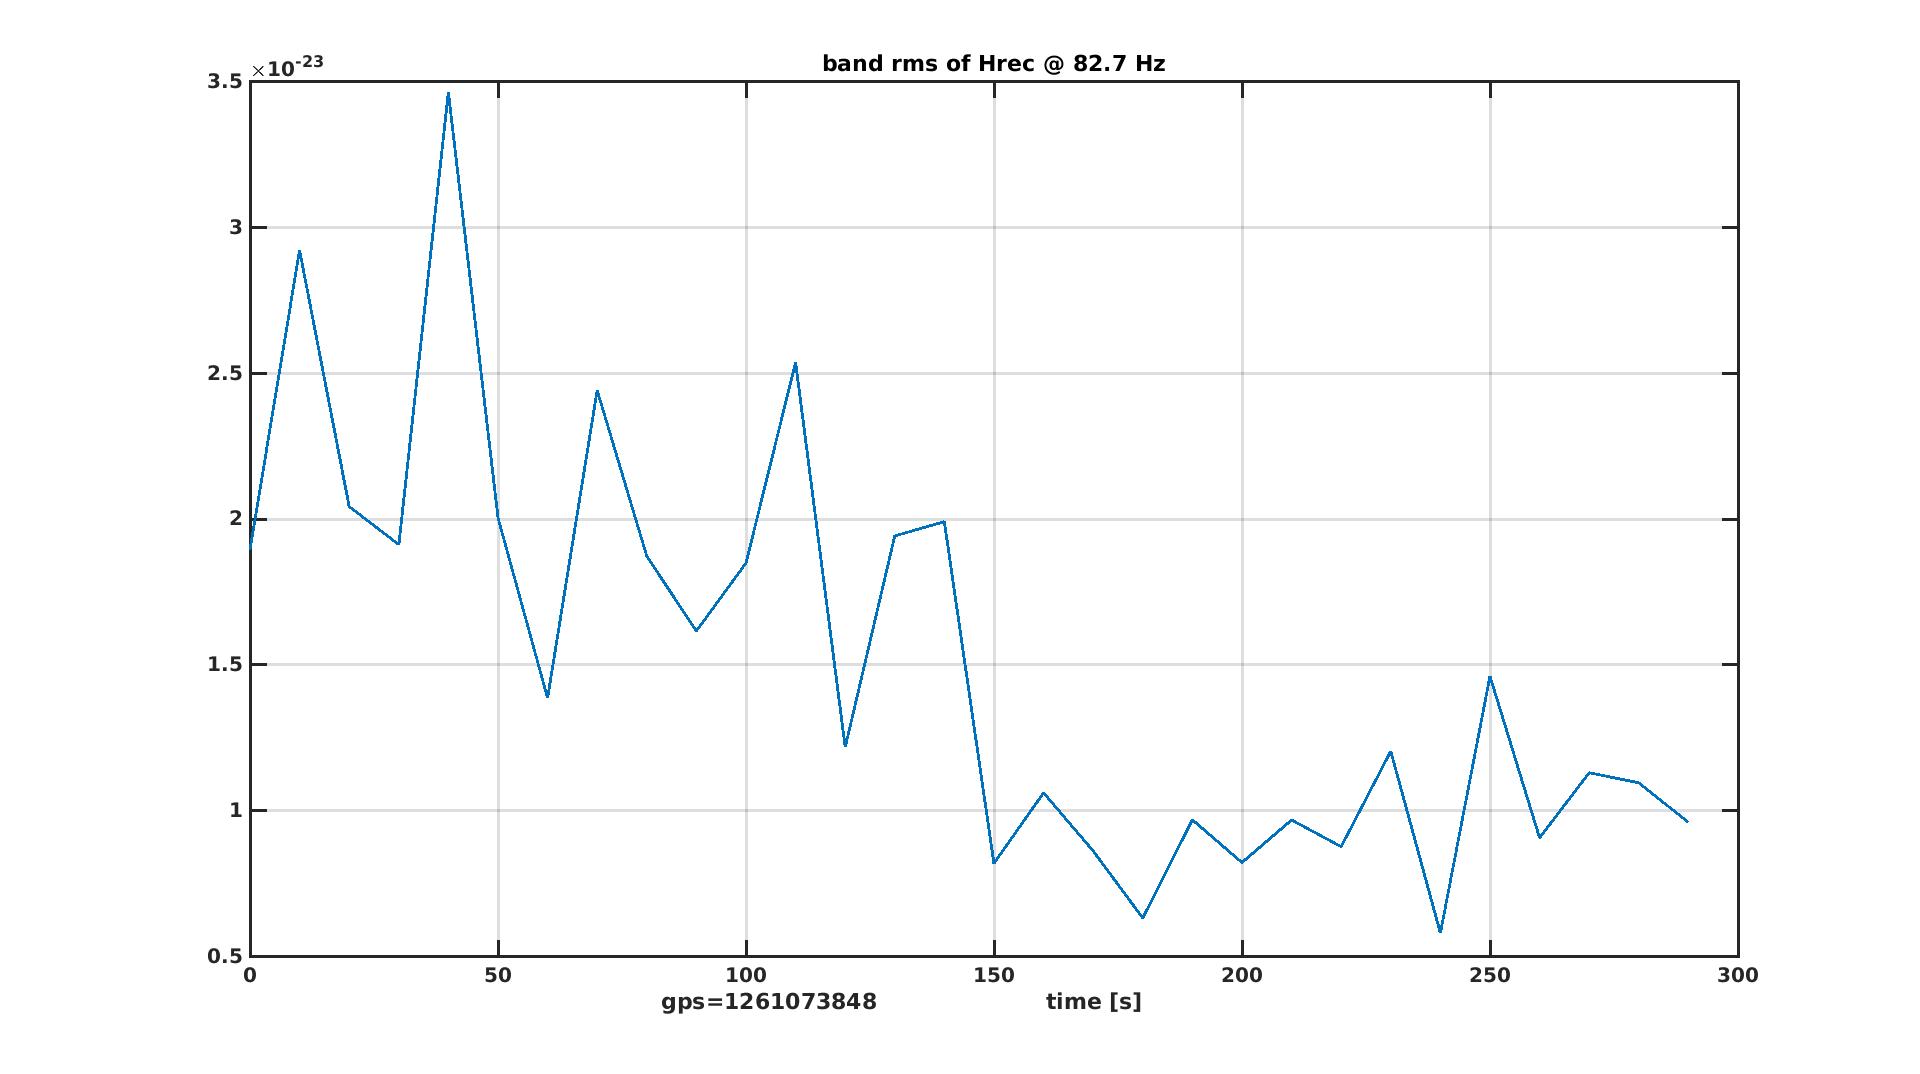
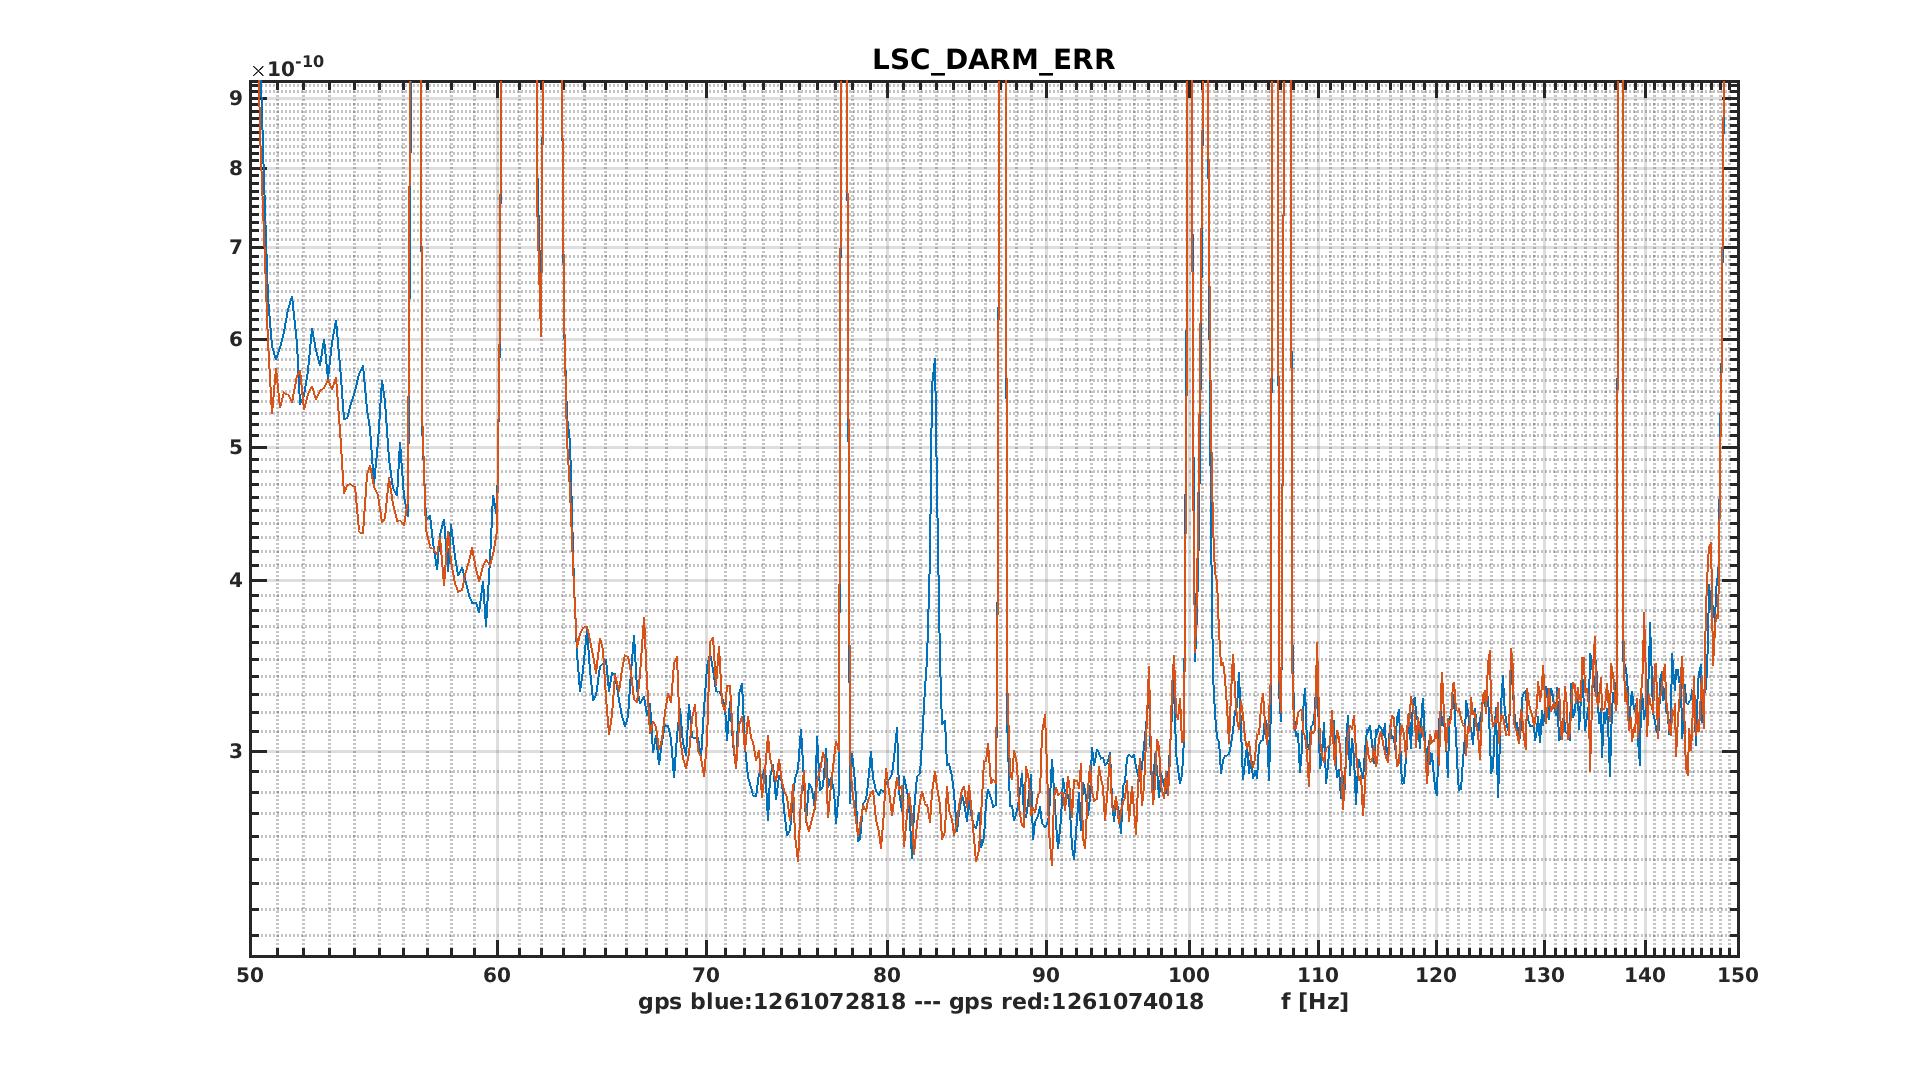
The spectrogram of Hrec shows a sudden change in the sensitivity on Sunday at 18:20 UTC: a line at 82.7 Hz has disappeared (fig 1, fig 2, fig 3). The same thing is visible in DARM (fig 4).
From figure 2 and 4, it is also possible that this line suddenly (with respect to the time resolution of the spectrogram) "jumped" to ~102 Hz, where it appears to wander (figure 2) and partially masked by the 100 Hz line bump. Its frequency instability also explains why it is not visible as a line in figure 4, but just as an increased bump to the right of the 100 Hz line.
Further investigations could be done with a spectrogram focussing on the time of the discontinuity, or spotting witness channels exhibiting a similar "jump".
These are the typical frequancies of an "old friend of us", therefore it is tempting to relate the two.