Reports 1-1 of 1 Clear search Modify search
Detector Characterisation (Spectral lines)
direnzo - 9:22 Wednesday 18 September 2019 (46952) Print this report
Wandering line jumping from 83.5 Hz to 108 Hz

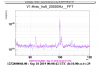
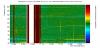
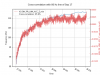
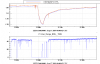
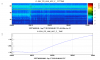
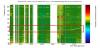
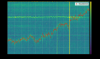
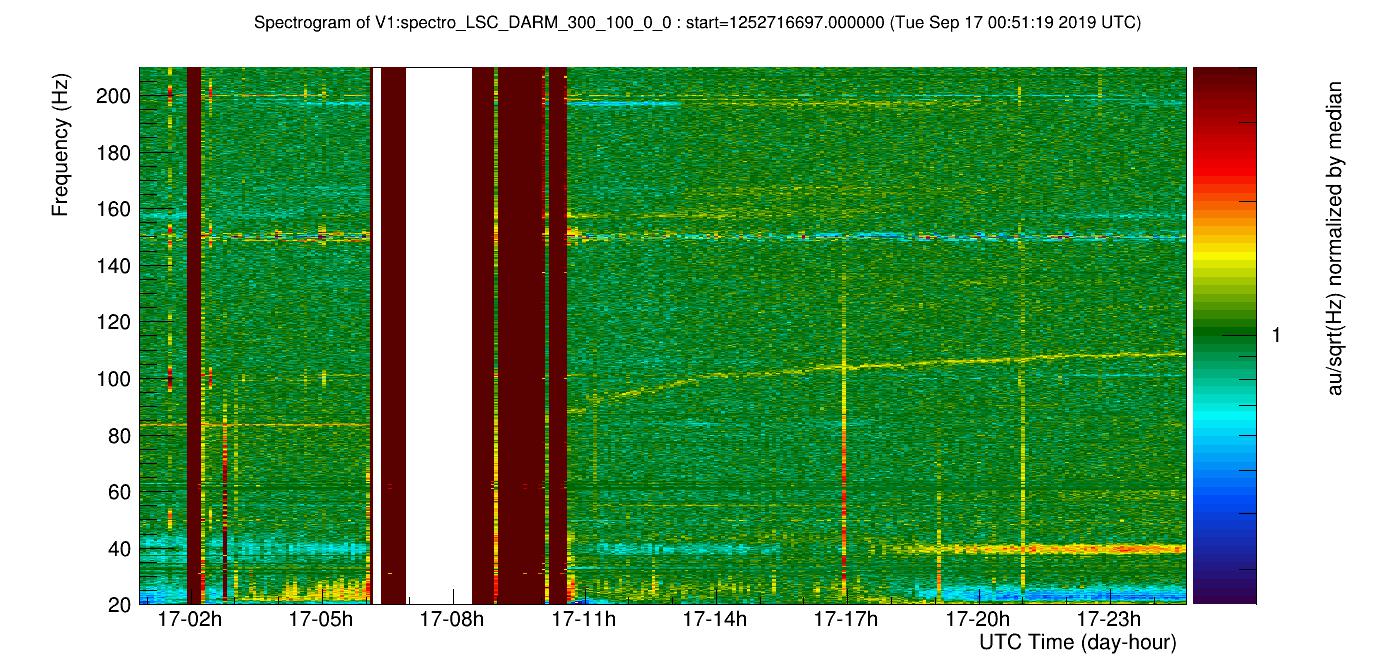
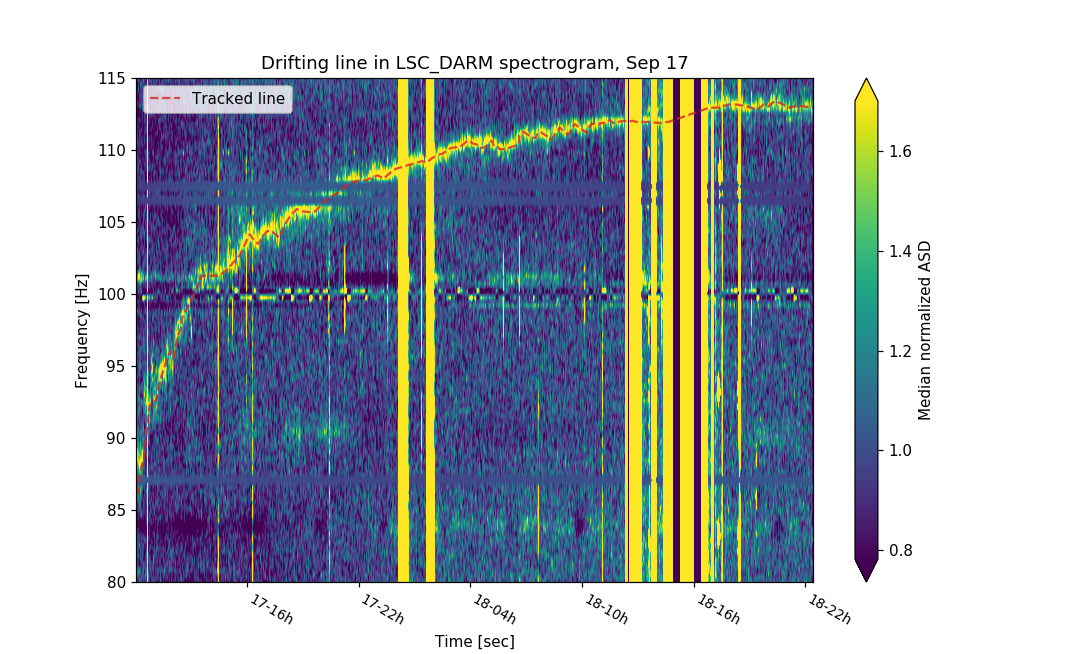
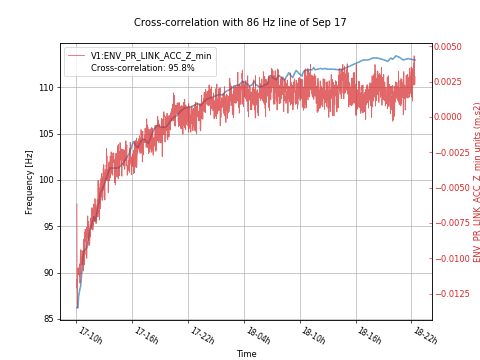
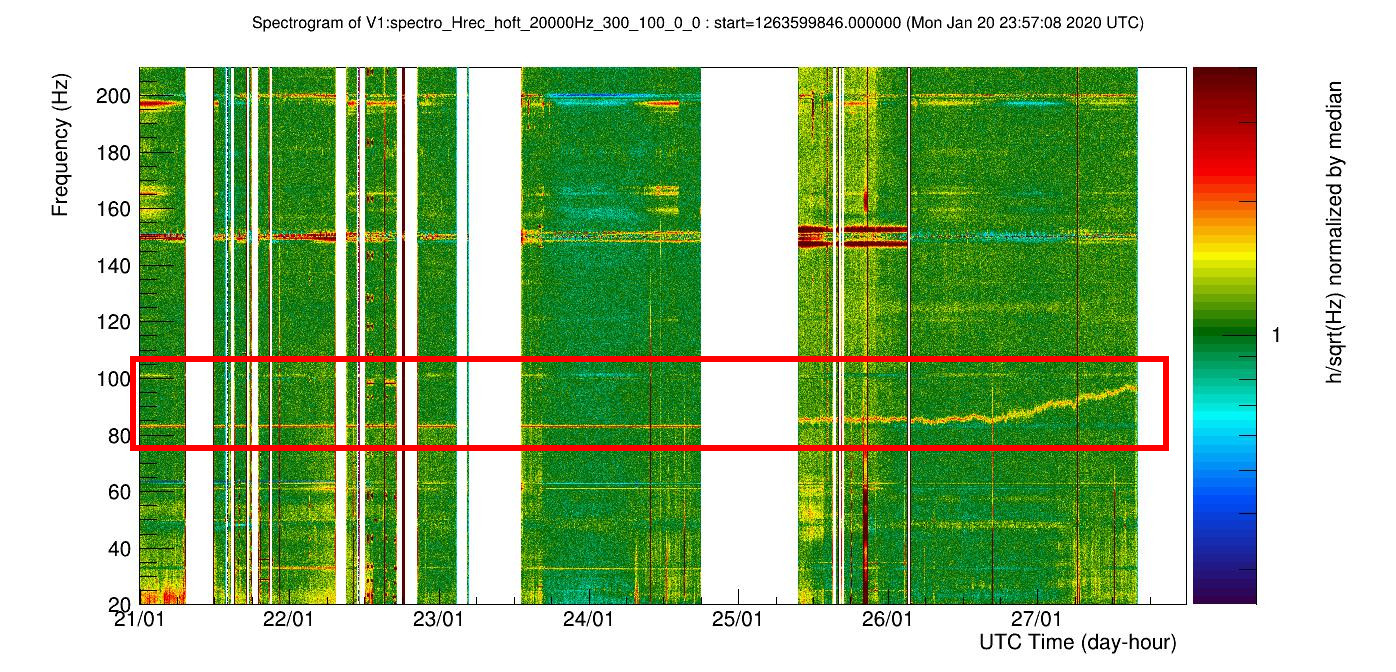
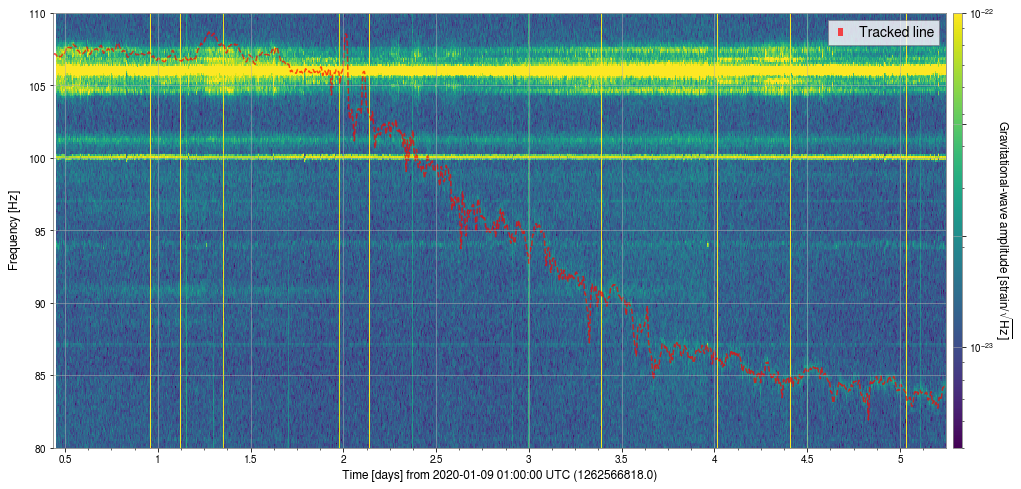
On September 17, after the maintenance break in the morning, a spectral line that use to stay stady at 83.5 Hz started moving in frequency, rising to 108 Hz. See the attached median normalized spectrogram of LSC_DARM and the ASD of Hrec_hoft_20000Hz.

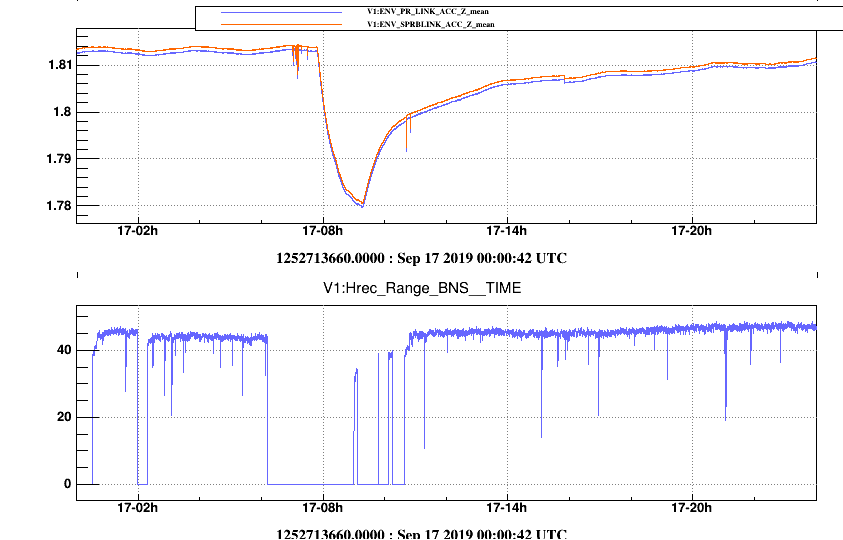
This is likely to be a well known friend of us; refer to this logbook entry. May it be related with some of the activities performed during the maintenance?
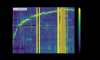
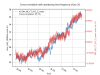
Images attached to this report
Comments to this report:
baird - 16:38 Wednesday 18 September 2019 (46959) Print this report
Wandering line is still growing in frequency but seems to wonder at a slower rate, tending to a limit. Seems to be around 110Hz still, will keep an eye on it.
direnzo - 22:40 Saturday 21 September 2019 (46988) Print this report

By means of the NonNA line tracker tool, I reconstructed the frequency evolution of the wandering line between September 17 and September 18: refer to the attached median normalized spectrogram and the red dashed line on it. Then I correleted the corresponding frequencies time series with all the ENVironmental channels. A very high value (~98%) of the Pearson correlation coefficient has been found with some accelerometers of the PR and SPRBLINK.

Here the NonNA report with the plots of the 10 most correlated channels.  Take also a look at the log file with a longer list of correlated channels.

Images attached to this comment
fiori - 15:22 Monday 23 September 2019 (46995) Print this report

The two accelerometers are nearby (1m or so apart), one on the link pipe between SPRB vacuum chamber and PR chamber and one on the link pipe between PR chamber and BS. They share the same power supply box. The observed drift is a drift of the DC offset (see Figure 1). The offset drift is the same for both and likely could be related to the power supply box. At the time of the two changes of slope of the offset (around 7:43 UTC and 9:14 UTC) there is seismic activity around both mini-cryotraps but the INJ seems most related (see Figure 3 and Figure 4, amplitude color scale is set the same for all accelerometers in CEB). This seems reasonable since it was TUE maintenance and this can correspond to cryotrap refills. It is still misterious how the activity coud have affected the accelerometers DC offset, and the relationship with the frequency drift of the "infamous" 83Hz line....

To be checked if a similar drift of the accelerometers is seen also during other refill operations. Also to be checked the coherence of the Hrec line with accelerometers on the cryotrap (ENV_IB_CT*) and the SPRB and PR LINK accelerometers ... usually there is not, but it might have changed after the events.

Images attached to this comment
swinkels - 11:56 Wednesday 29 January 2020 (48282) Print this report
The ~80 Hz line has started to move up in frequency again since the half-day period the interferometer was not locked between 24 and 25 January. This was a night of intense troubleshooting, during which many actions have been performed (drift of SPRB, DAQ box reset, tuning of phases, ...). The moving line might be associated with one of these, but it might be a pure coincidence.
Images attached to this comment
direnzo - 11:20 Thursday 30 January 2020 (48296) Print this report

I tracked the line frequency evolution with the NonNA Line Tracker tool. In the attached spectrogram, you can see the detail of the band [80,100] Hz of Jan 26-27, with the line highlighted by the dashed red line. For convenience, I also attached the txt (which is actually a "csv" file: change the format and import it as you prefer, like by `np.genfromtxt('filepath', delimiter=',')` ) with the gps times and frequencies of this wandering line.

I will follow up with further analysis on it momentarily.

I also tried to track the same line during January 1-6, but with less succes. I will retry later with more accurate "fine tuning" of the parameters for performing the frequency reconstruction.

Images attached to this comment
Non-image files attached to this comment
direnzo - 16:07 Thursday 30 January 2020 (48303) Print this report

I attempted to ``brute-force'' correlate the frequencies time series corresponding to the wandering line with a quite comprehensive set of auxiliary channels with NonNA corre tool:

  • All the Environmental channels ([ENV_*]): link to the results;
  • All the Environmental channels, excluded the Thermometers, since from the previous test it appears that the wandering line has approximately the behavior of a constant trend (=> high correlation with anything ``trending''): link to the results;
  • All: still running...

Very high correlation has been found between the wandering line frequencies and ENV_NE_CT_ACC_Z: plot. Take a look also at the other channels listed in the tables at the previous links, and the corresponding plots.

Ongoing investigations:

  • Extract the time series corresponding to other periods of this line;
  • Perform correlation analysis and examine the list of most correlated: is this just by chance or are there recurrent channels in these lists?
  • Understand why sometimes this line is stuck at ~83 Hz, sometimes at ~100 Hz (possibly hidden in the 50 Hz harmonic bump), or 108 Hz, and somother times it changes frequency. Correlate it with other status flags.


Images attached to this comment
direnzo - 21:42 Friday 31 January 2020 (48312) Print this report

The chase for the wandering line causes is still ongoing. I tracked its evolution between Jan 9 and Jan 14. You can find attached the spectrogram of the region [80,110] Hz and its median normalised version, where the wandering line is marked by the dashed line (respectively in red and black color). I also attached a csv file (txt extension, comma separated data) with the gps times and frequencies of the line time series. For convenience, the sampling frequency is 1/32 Hz, as in the previous example.

Again, I tried to correlate it with all the environmental channels (ENV_*), excluded the thermometres, with NonNA corre: results at this link. Unfortunately,  the list of the most correlated channels is  different from that obtained during the period of Jan 26 (although the most correlated one is still an accelerometre in the NE). This suggests the fact that the correlations found are just due by the chance!!

Next steps:

  • Examine the lists of most correlated channels and the log-file more carefoully, in search for same high rank channels;
  • Extract other periods of evolution of this line (new attempt on Jan 1 and before);
  • Following Bas' suggestion, I will jointly estimate the "brute force" correlation of several periods of evolution of this line;
  • Since the correlation of wandering line frequencies and intensity of other channels seems not to work, try to look for new strategies (every suggestion is welcome :-) ).

Bonus note:

Images attached to this comment
Non-image files attached to this comment
Search Help
×

Warning

×