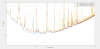
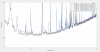
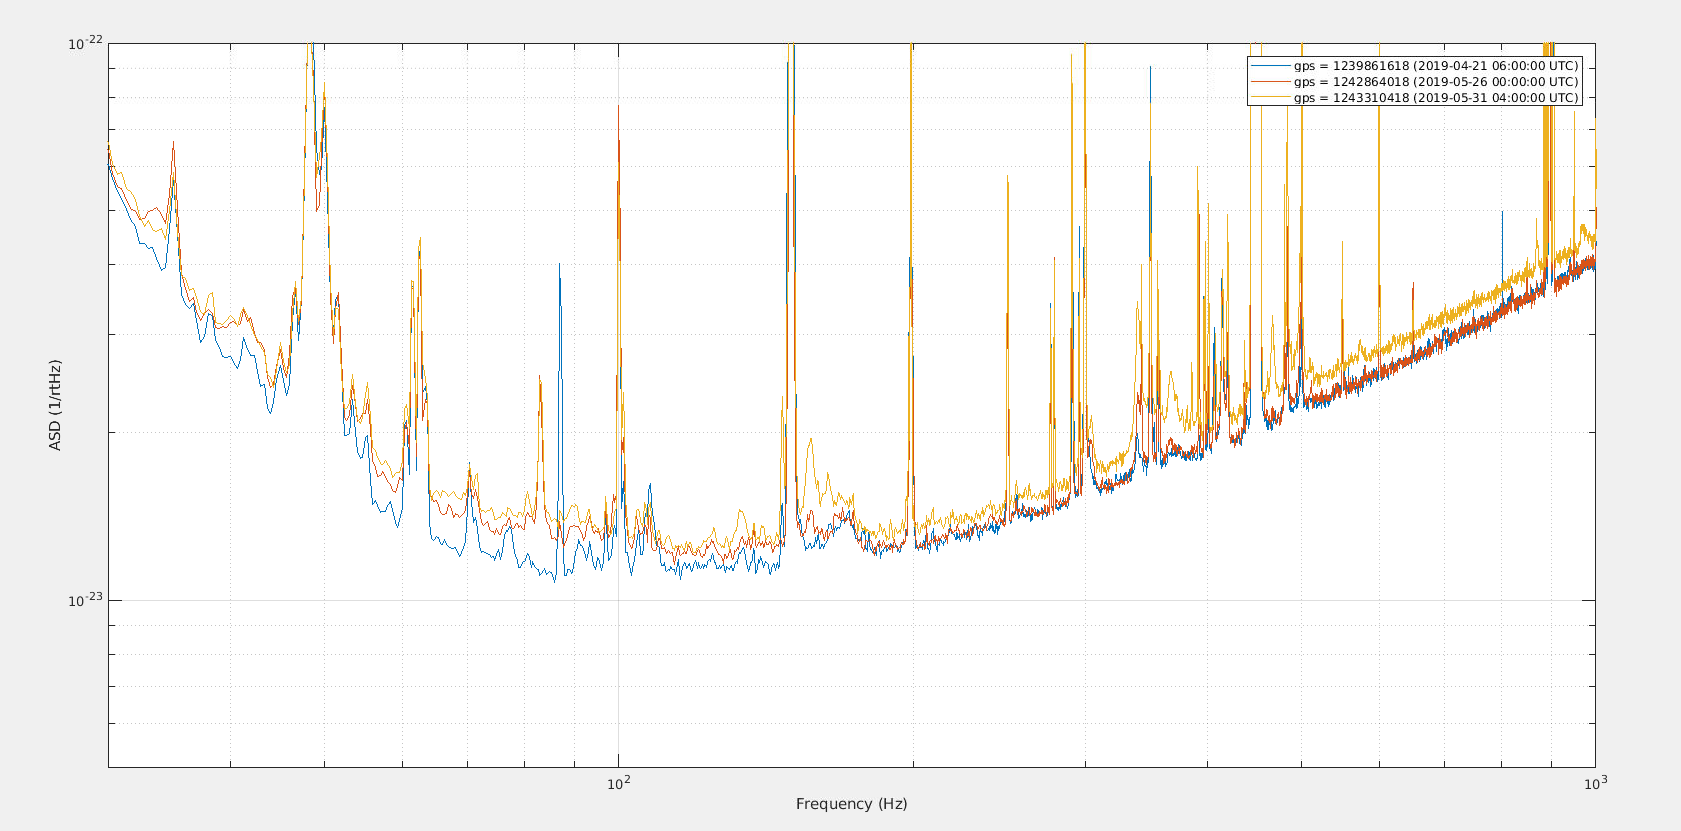
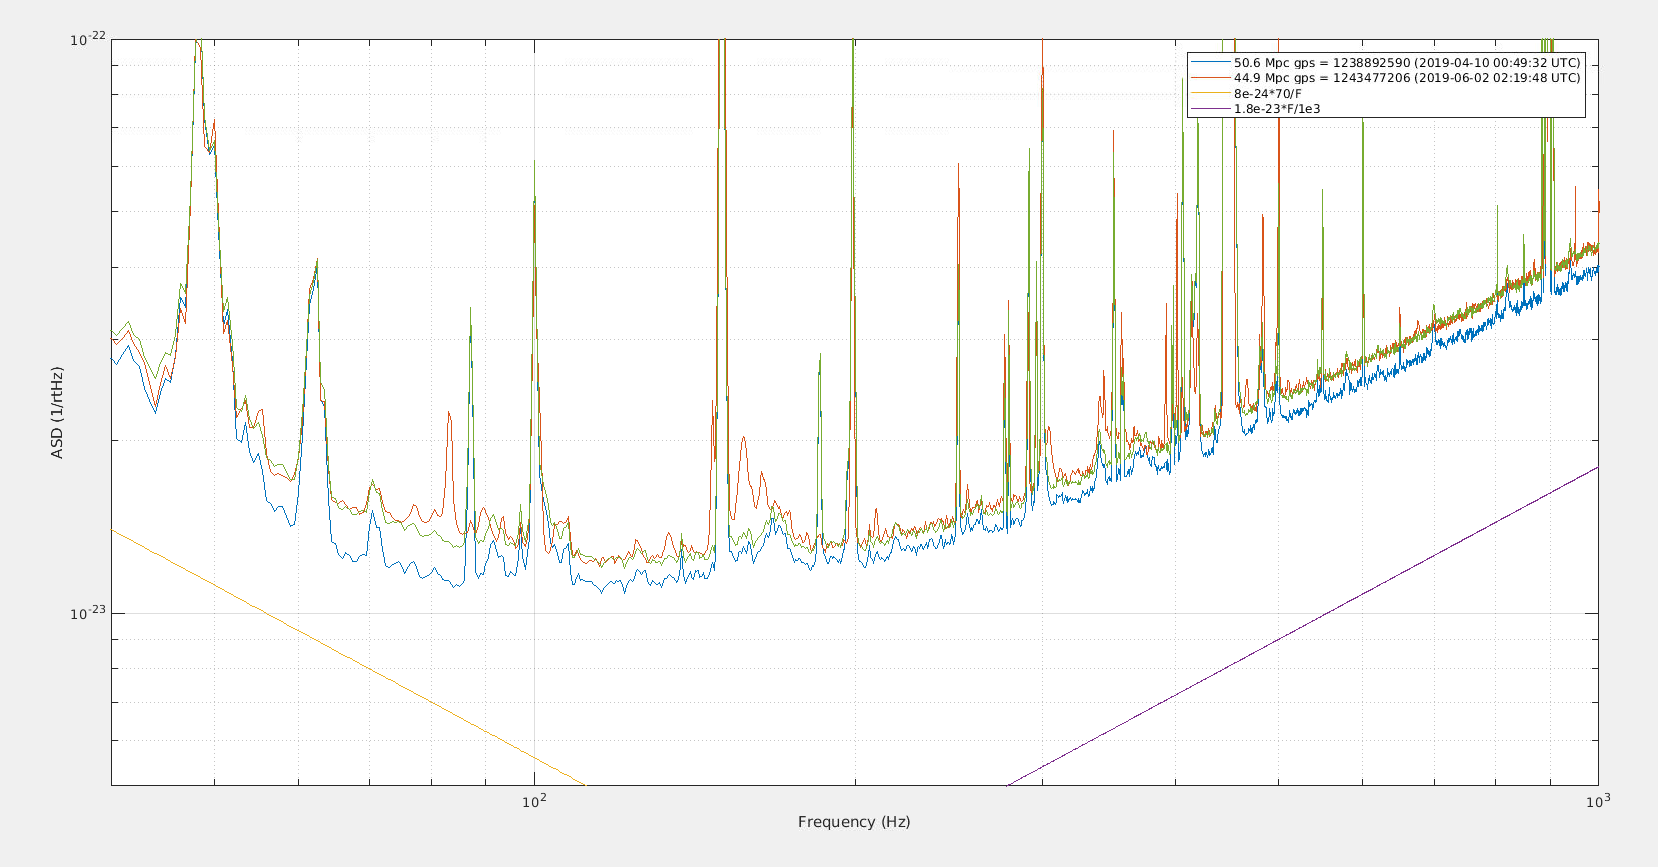
Figure 1. Shows the h(t) spectrum at 3 different times. On April 21 in blue, when the BNS range was at 50Mpc, on May 26 in red (before the earthquake), and on May 31 in yellow after the TCS/ISC work on the ITF working point. Between April 21 and May 26 the noise between 50Hz and 100Hz has increased. After the earthquake the shot noise has increased and several structures at a few hundred Hz have increased.
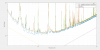
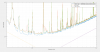
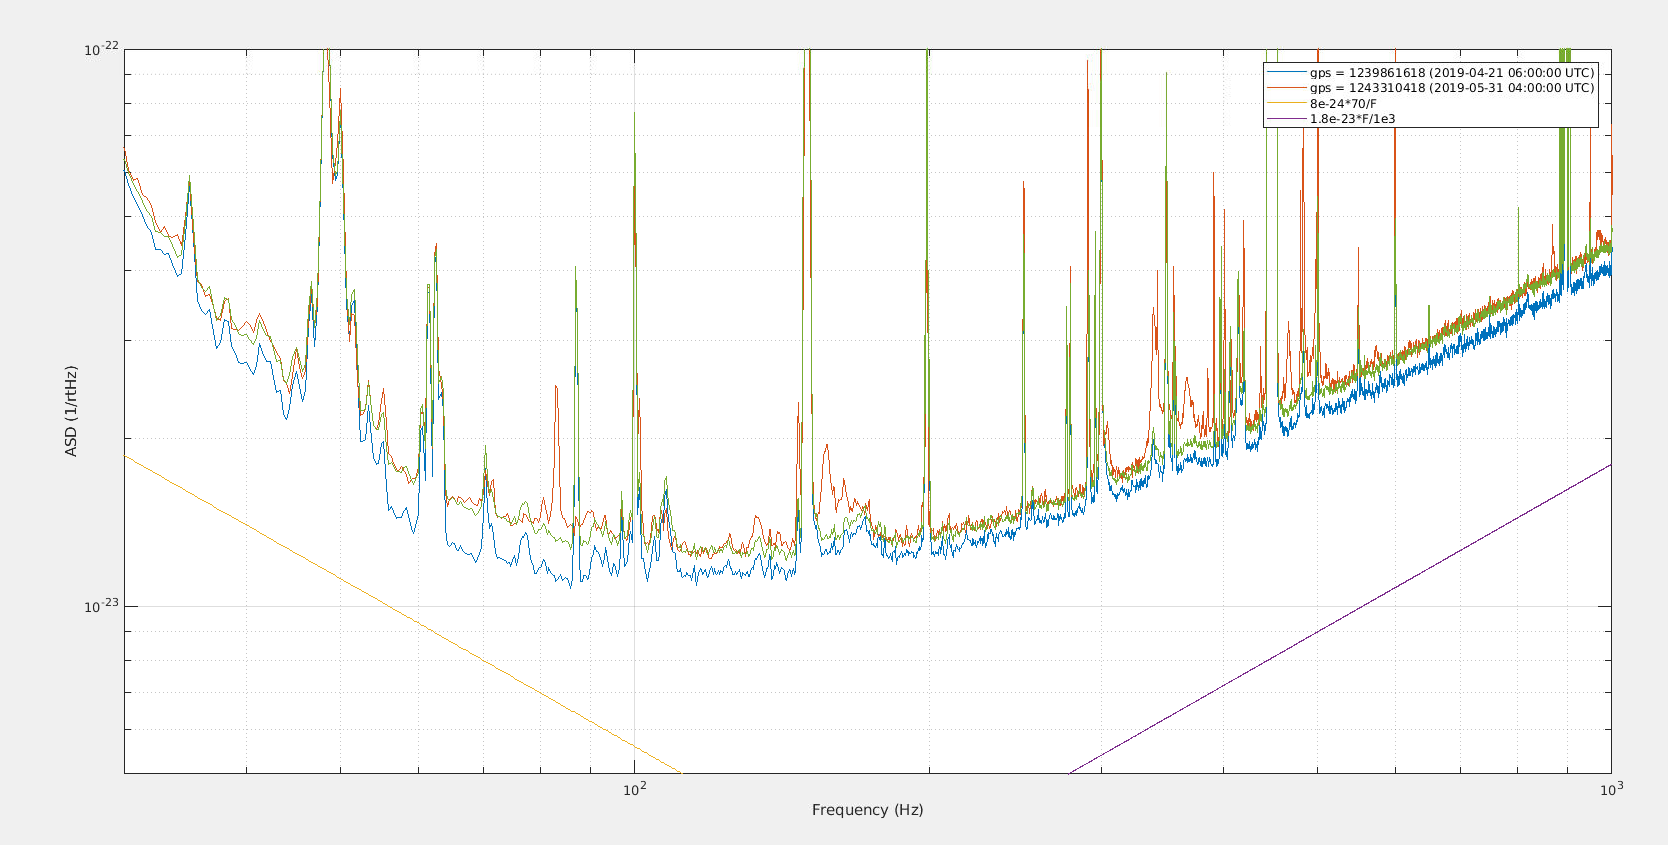
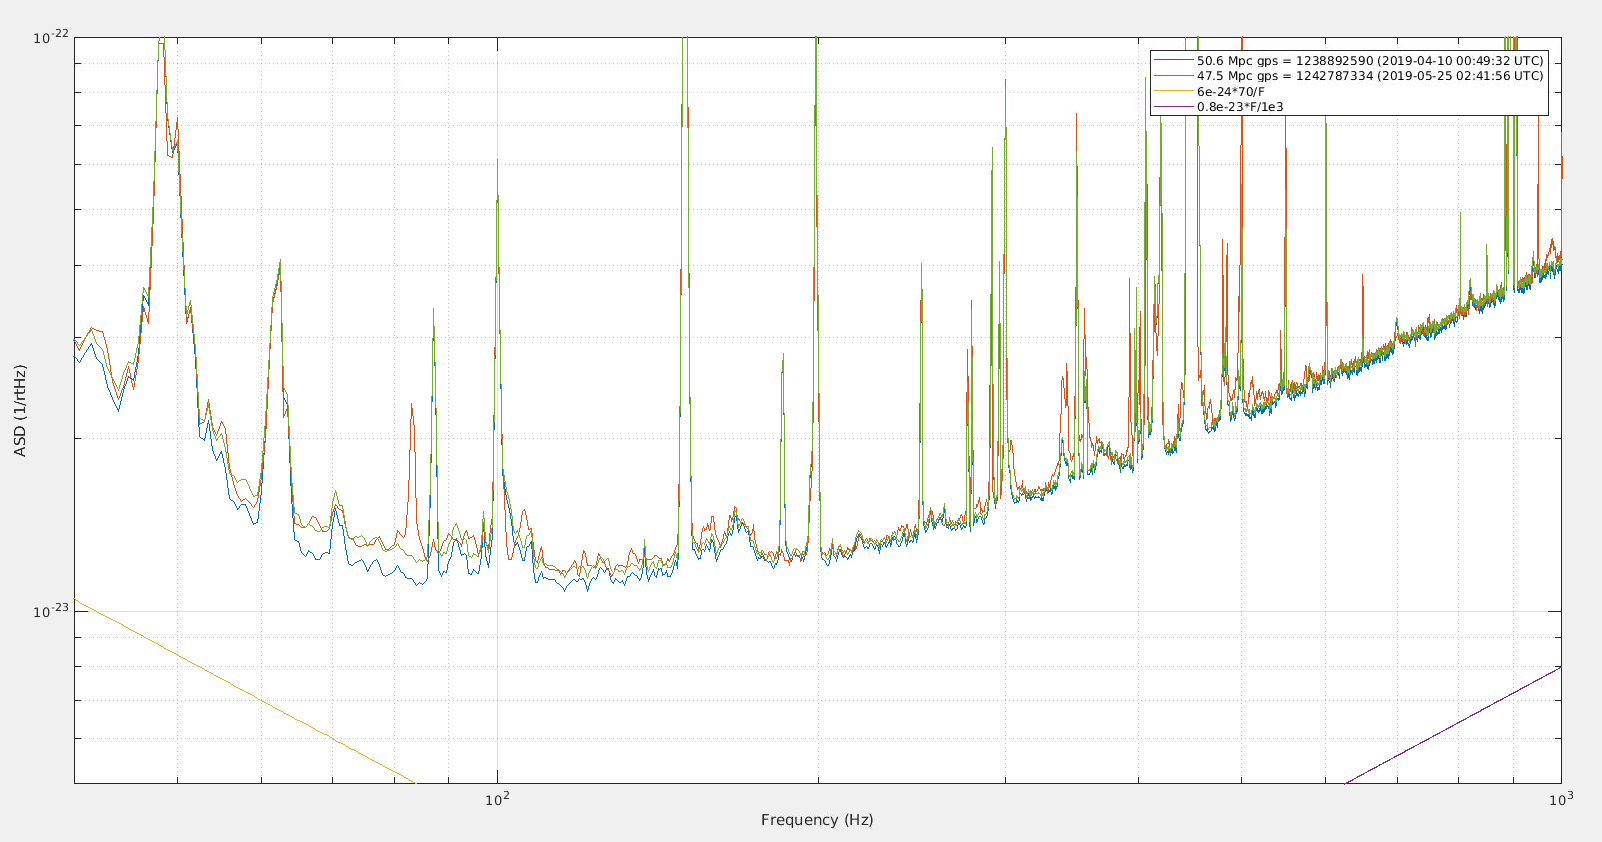
Figure 2 Shows the h(t) spectrum on April 21 in blue and on May 31 in red, adding to the Apr 21 data 1/f noise (yellow line) and a f noise (shot noise, in purple), yields the green curve which matches quite well the May 31 data. So it seems that since Apr 21 the flat noise has not changed, however an additoinal 1/f noise is present (and was present already before the May 26 earthquake) and the shot noise increased after the earthquake. The shot noise increase might be cured by realigning the OMC and/or squeezing alignment and phase tuning. The origin of the 1/f is to be found.
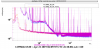
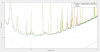
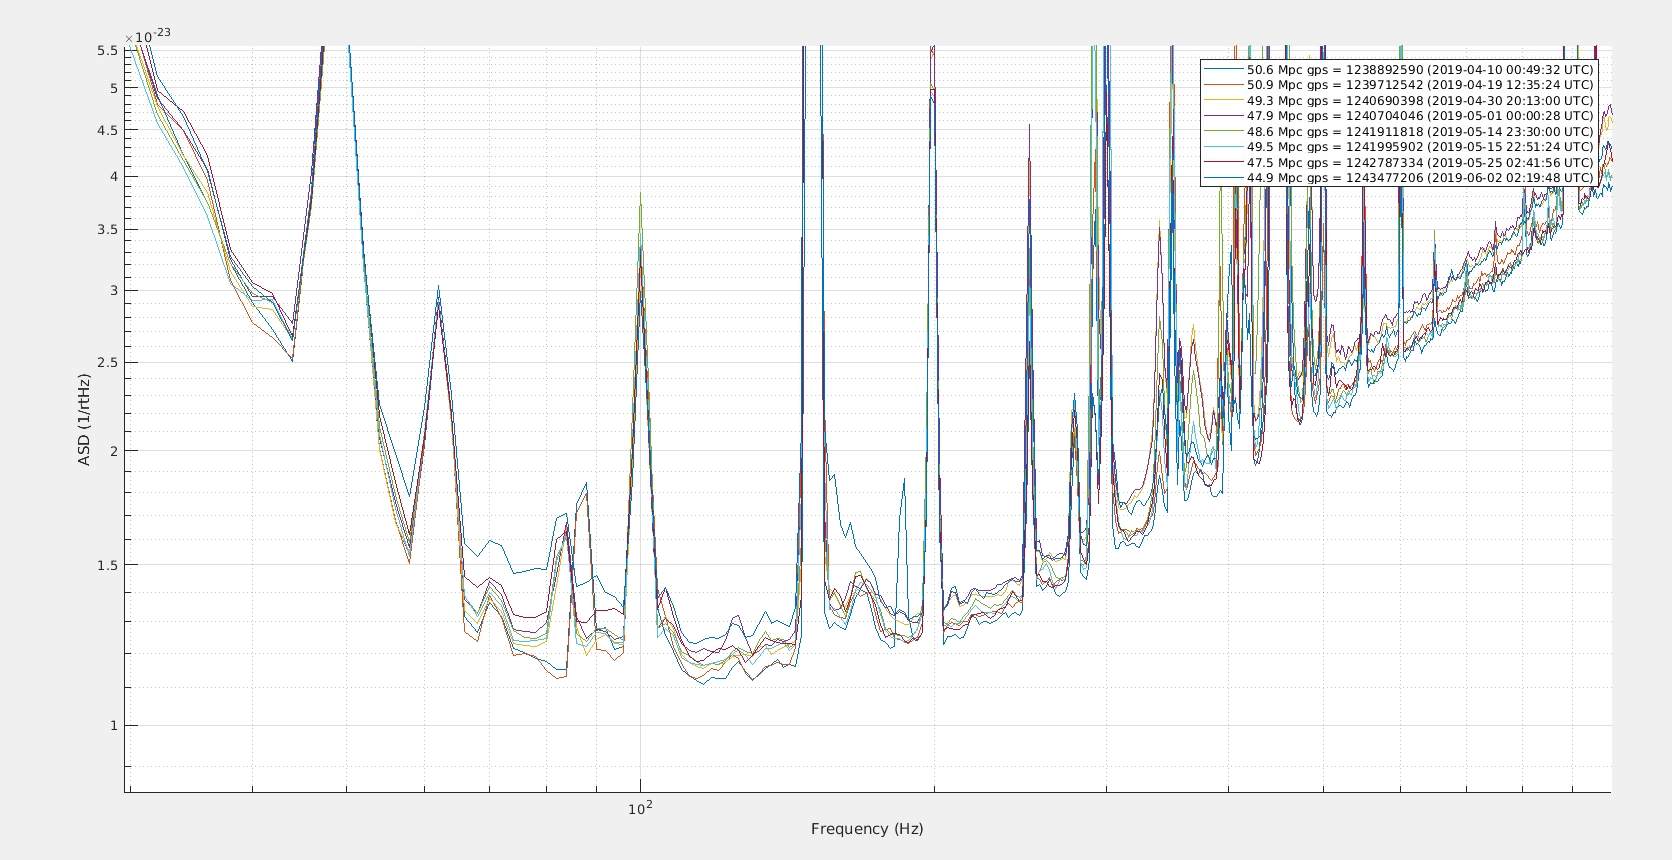
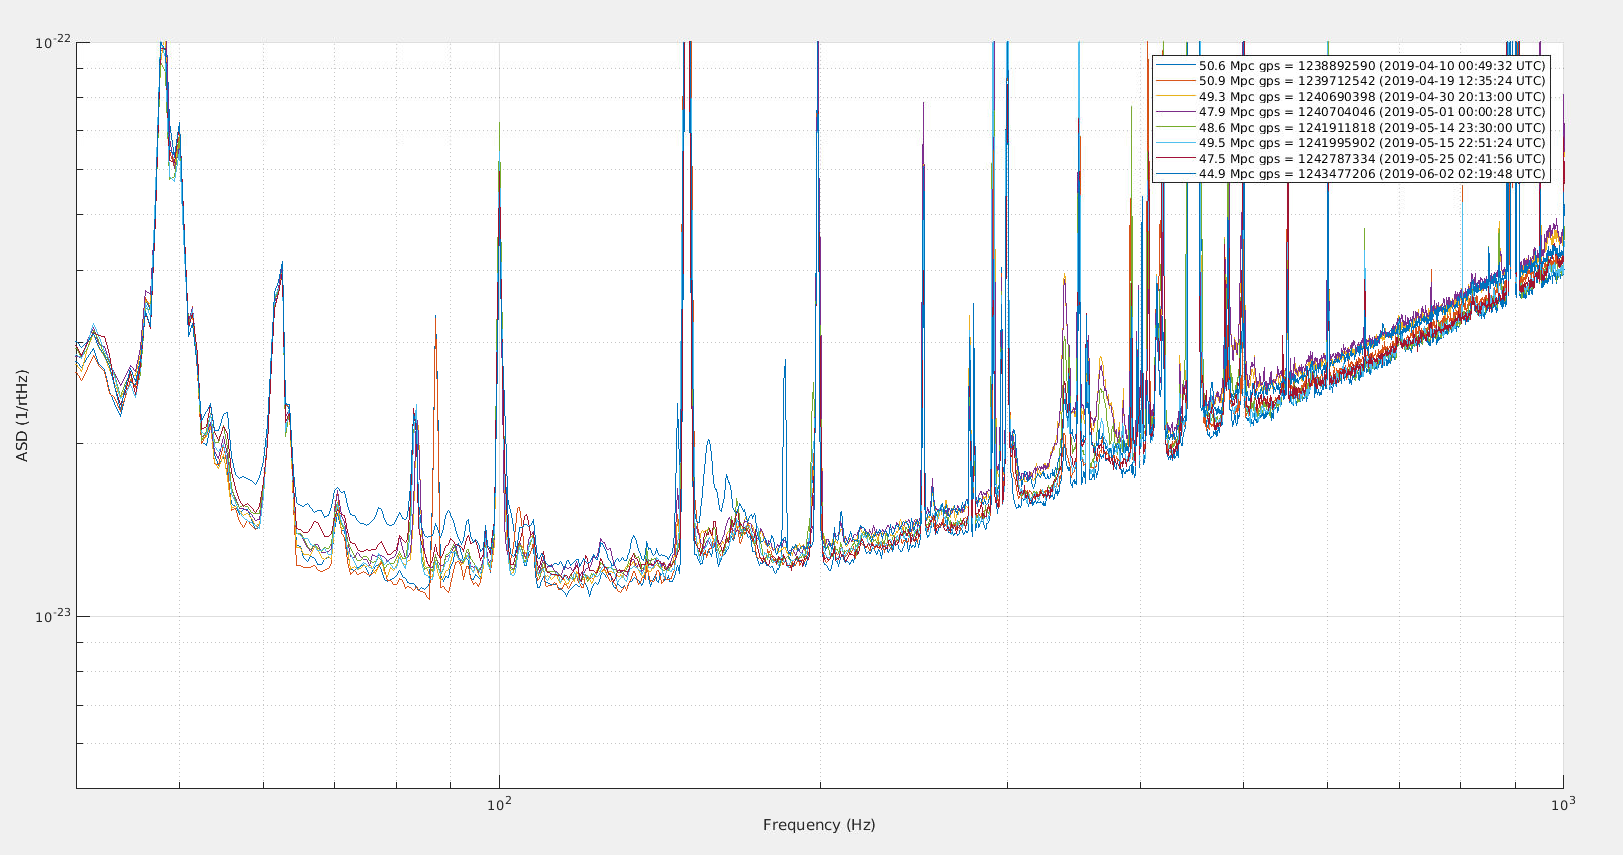
Figure 3. Compares the B1_PD1+B1_PD2 spectrum, and the B1_PD1-B1_PD2 (NULL) spectrum. The NULL spectrum has not changed between Apr 21 and May 31, so the new 1/f noise is not coming from an issue with the B1 photodiodes, as it is a noise that is common to both photodiodes.
