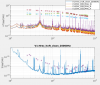
We compare results of FarField magnetic injections done at WEB (last Tuesday), NEB (today) and CEB (showing here the dataset of May 7).
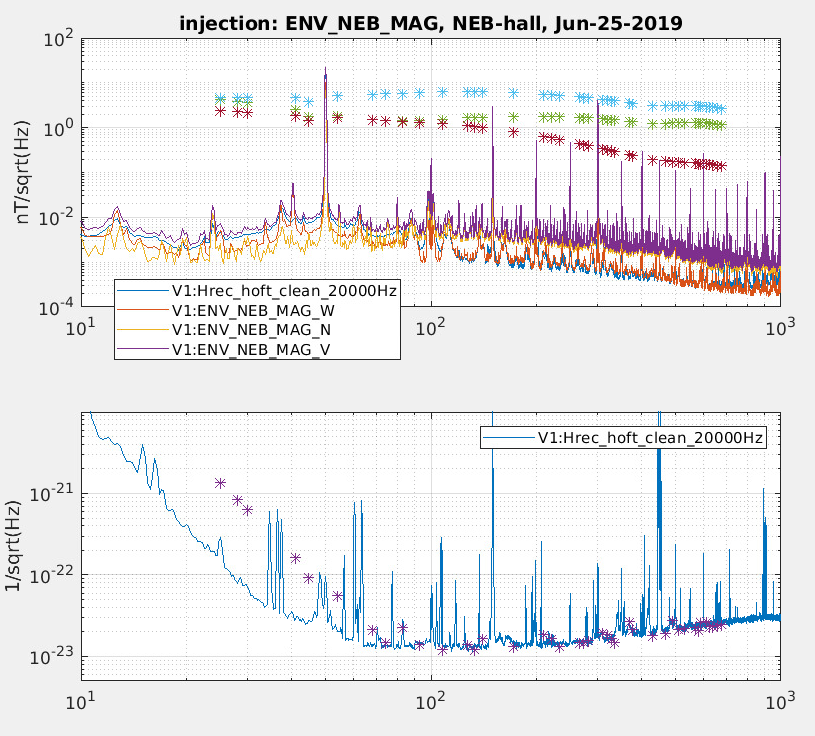
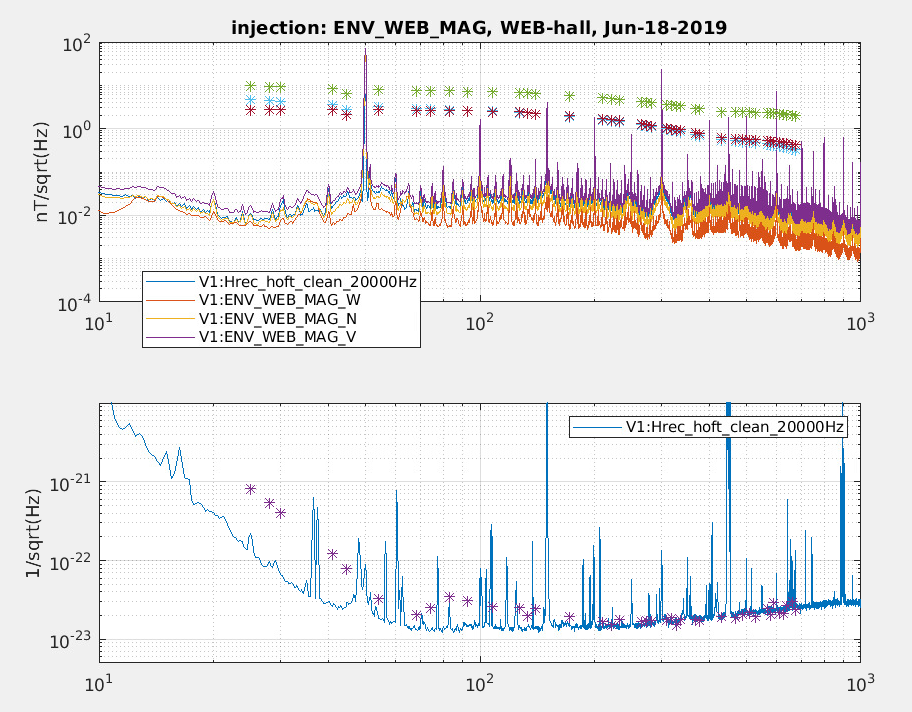
- Injected lines (40 lines between 25Hz and 700Hz) have similar intensity (order of some nT) in the building magnetometers: Figures 1,2,3 (NEB, WEB and CEB resp.)
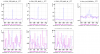
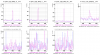
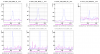
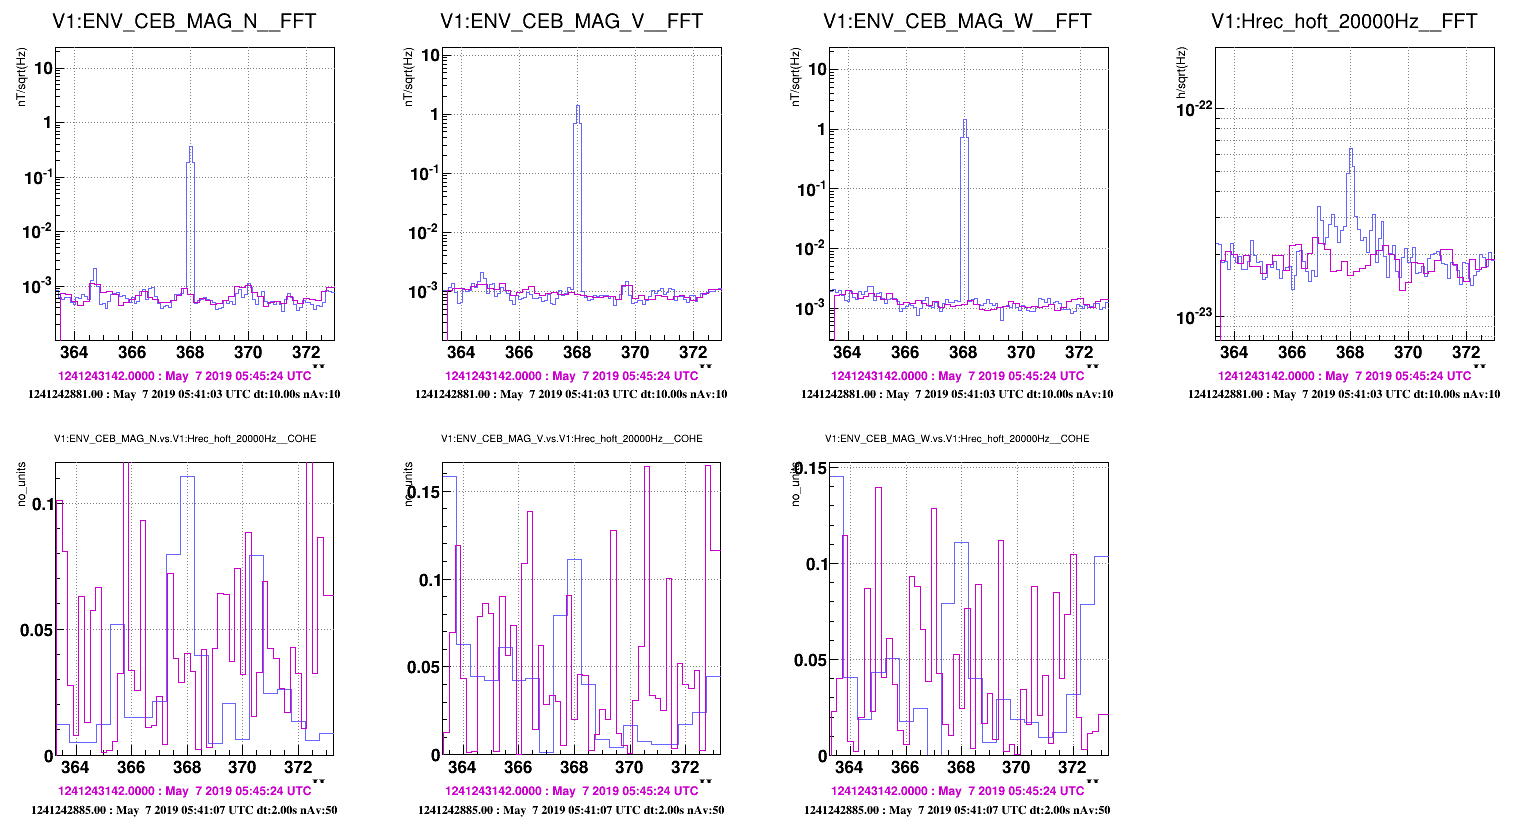
- In the case of CEB we notice that at some lines above 100Hz (i.e. 368Hz or 490Hz) the peak in Hrec is broad (seems to notice some sidebands) and the coherence with the magnetometers is very low or null: See Figures 4, 5 and 6. This suggests for some non linear coupling path.
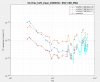
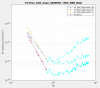
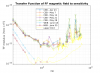
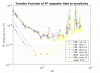
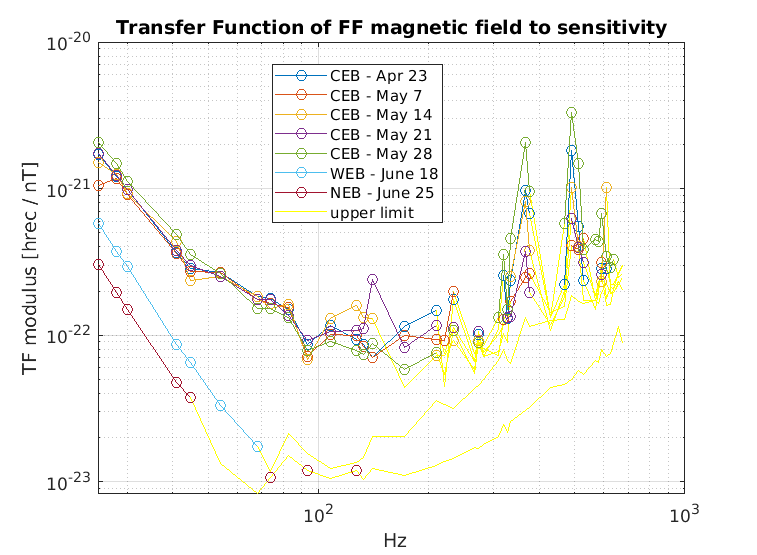
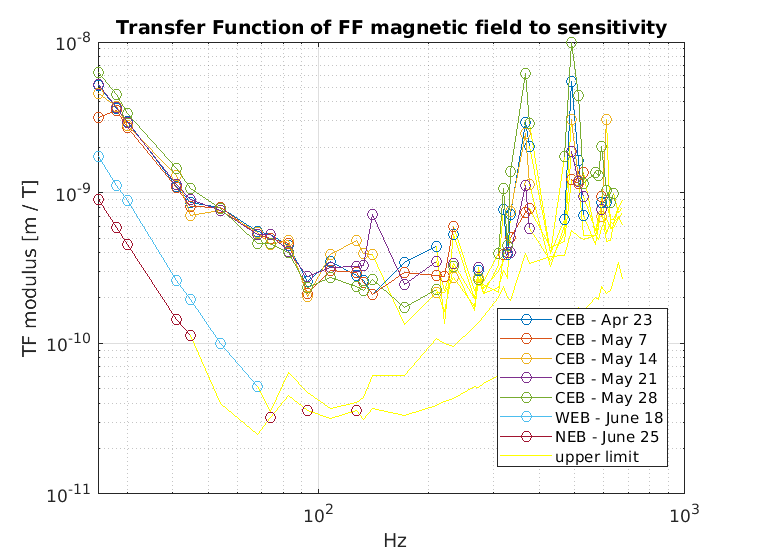
- Transfer Function of CEB is higher then NEB and WEB (see below) expecially above 100Hz (as already noticed). The TF slope is close to 1/f^2 below 100hz, flat between 100 and 300Hz, and then tends to increase roughly as f or even f^2: in Figure 7. This suggests for some other coupling path than just through TM magnets. (see also 45039 about NF injections at DET)
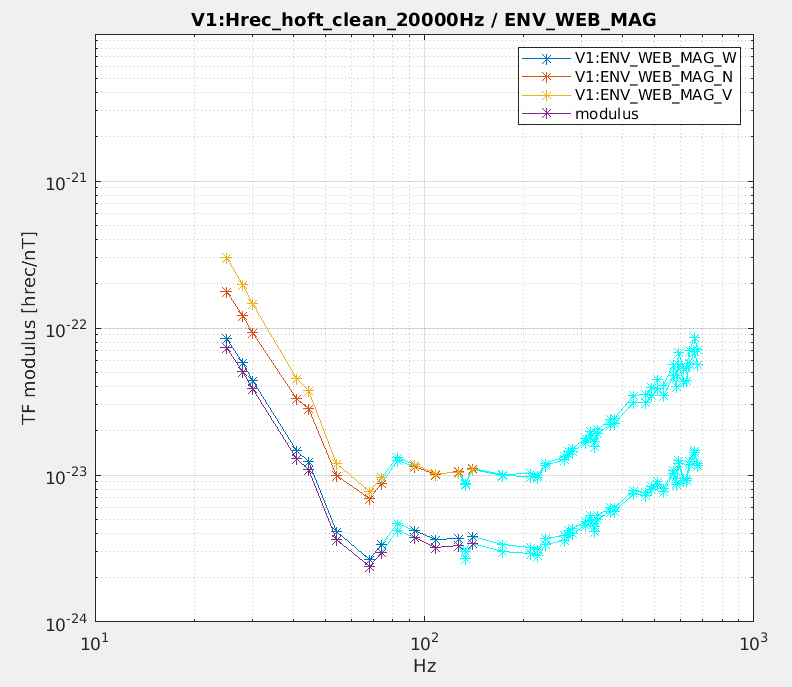
- At WEB and NEB we measure a transfer function which is has a 1/f^3 slope (even a bit steeper). This slope is consistent with a coupling through TM magnets. Above 60Hz we cannot measure (what shown is just upper limit) because the present setup cannot inject enough current in the coil. See Figures 8 and 9.
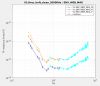
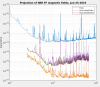
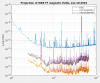
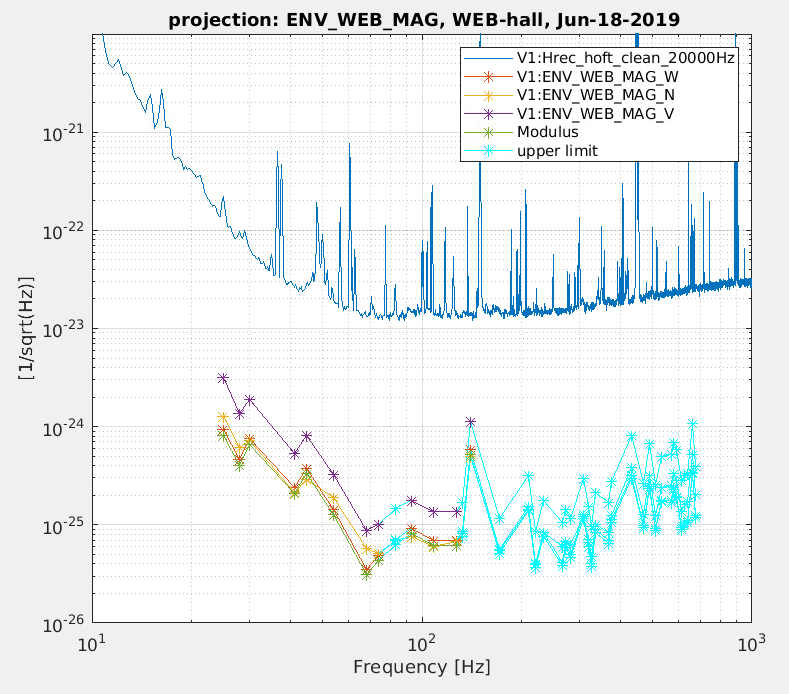
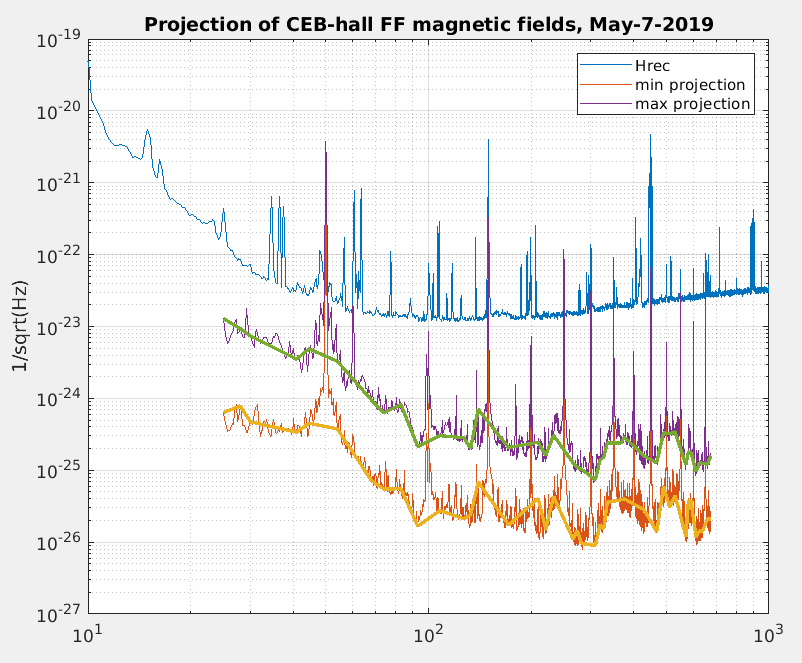
- Figures 10, 11, 12 show the projections to Hrec: all a factor at least 10 below present sensitivity. However these projections are only indicative at least for CEB where magnetometers are far from TM or other potential coupling spots. They make more sense for WEB and for the "V" channel of NEB since these magnetometers are presently close to the TM chamber.
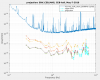
- Figures 13, 14 and 15 show a "projection" of magnetic spectrum, which, for the reason mentioned above, makes actuallly sense just for the WEB and NEB. We see that no projected spectral peak touches the sensitivity


