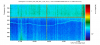
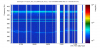
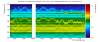
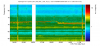
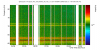
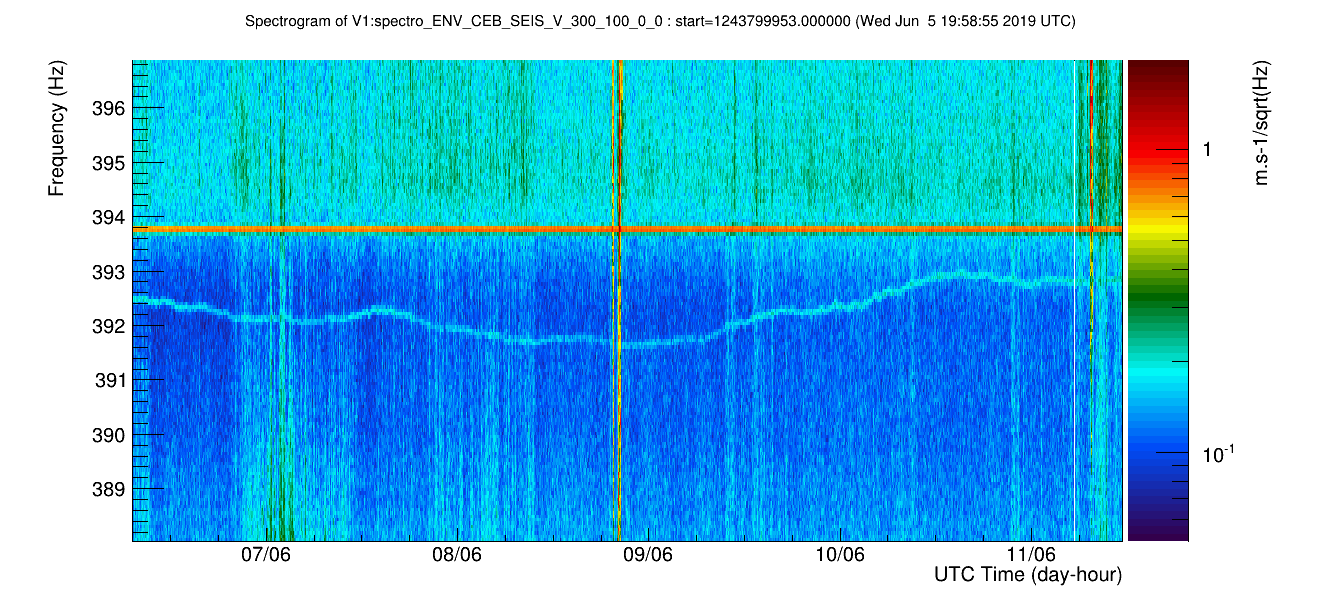
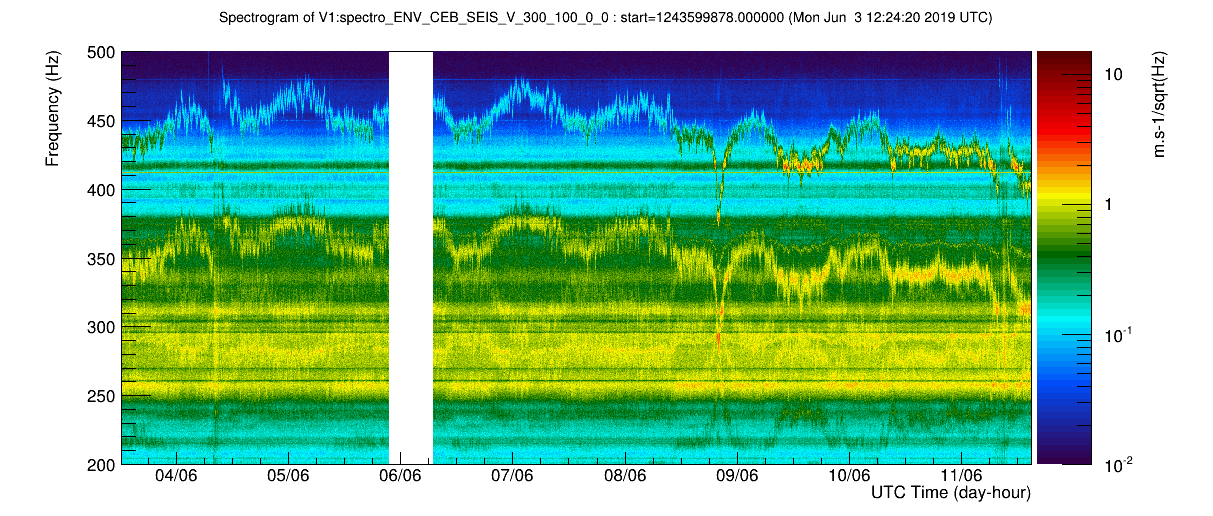
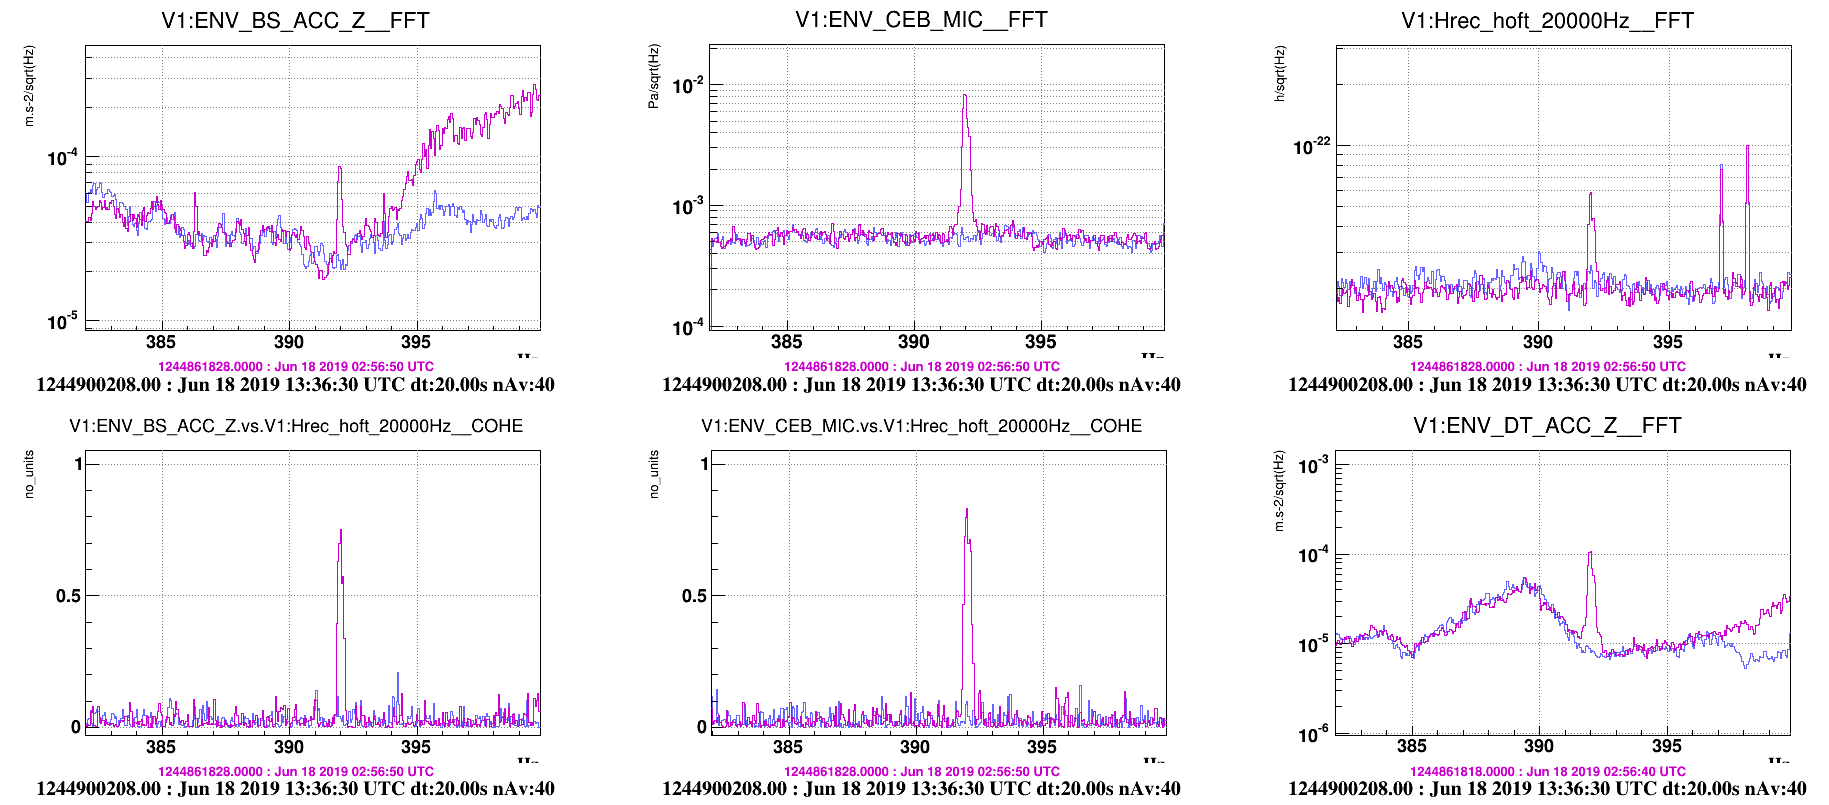
Investigating on some bumps or wandering lines in h(t), I focused on seismic probes. Plots 1 and 2 show, over several days, a wandering line around 392 Hz, visible in h(t) and in the central building seismic probe. As can be seen on plot 3, the seismic probe has much more and higher wandering lines, for instance around 350 Hz or 450 Hz that does not appear in h(t).
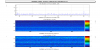
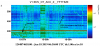
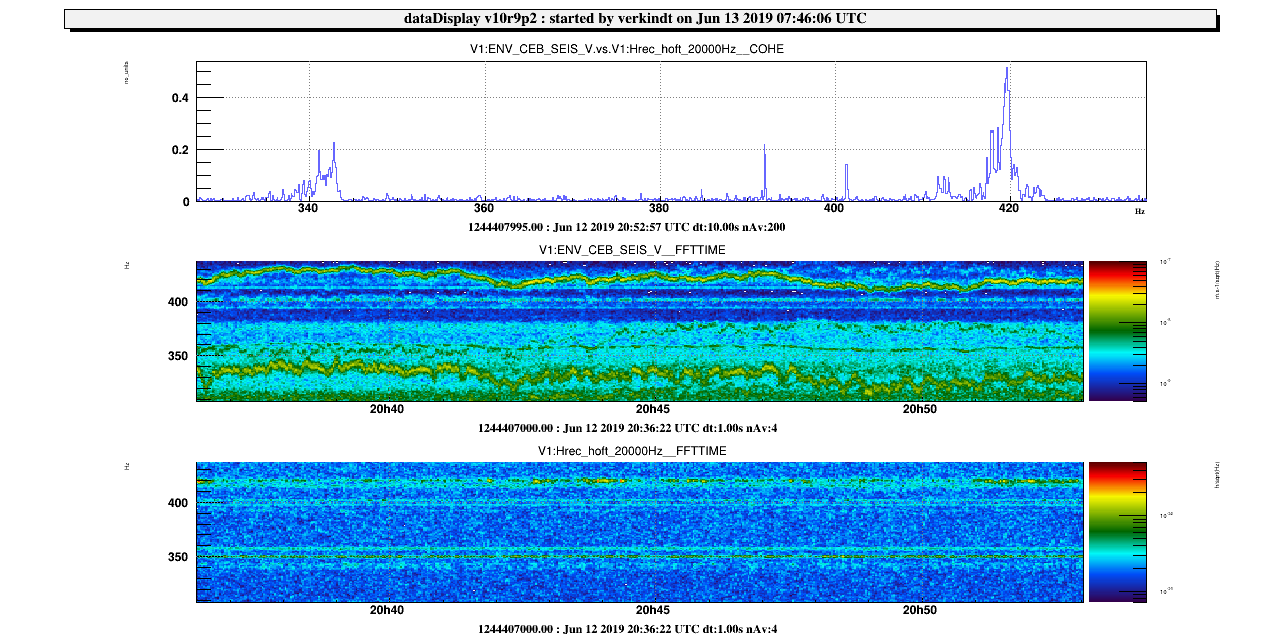
Plot 4 shows, on a shorter time scale, the spectrograms of ENV_CEB_SEIS_V and Hrec_hoft_20000Hz and their coherence, between 320 and 440 Hz. We can observe some coherence around 350 Hz, at 392 Hz, at 402 Hz and around 420 Hz. At those frequencies, we can suspect that the origin of those lines is either not seismic or is seismic motion going through a scattered light path (on detection bench?).
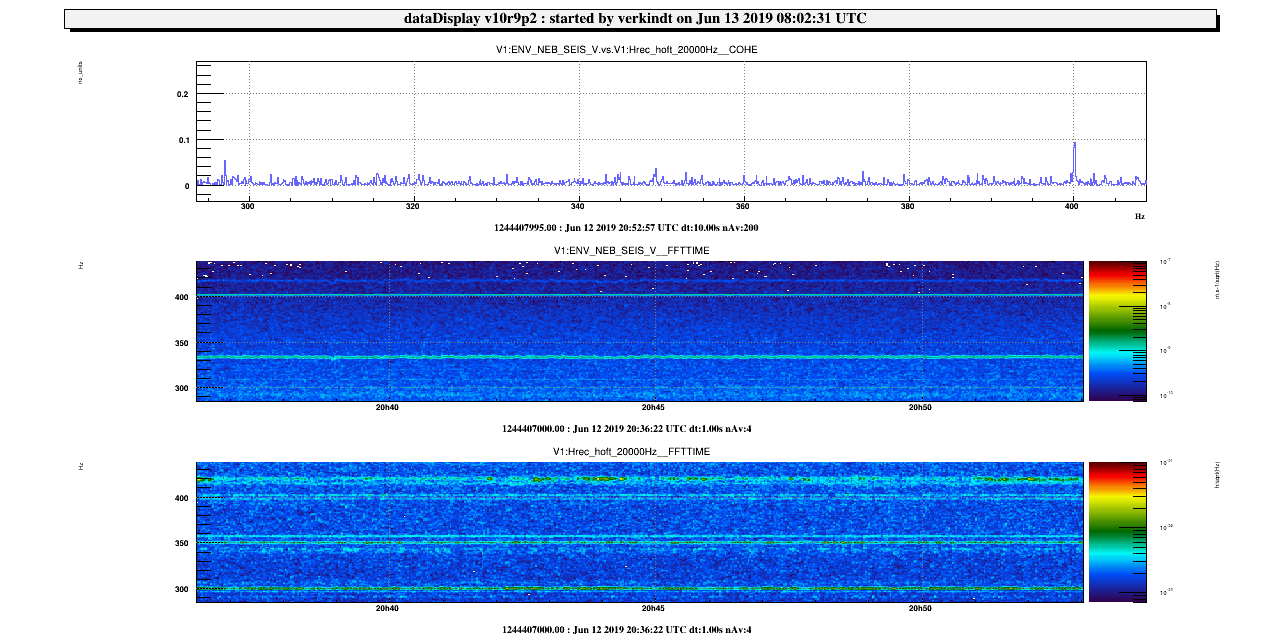
For comparison, plot 5 shows the same coherence plot, but for the NE seismic probe. In this case, no coherence is visible except for the 50 Hz even harmonics
(collateral remark: for the CEB seismic probe, no coherence was visible at the 50 Hz harmonic frequencies).
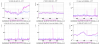
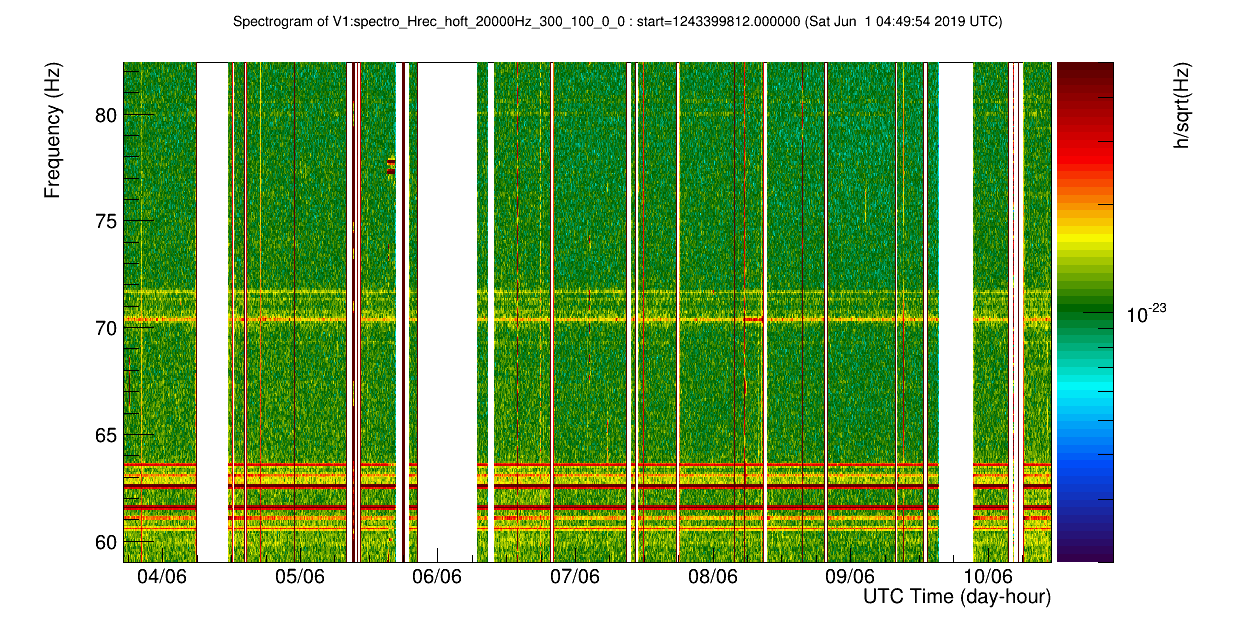
Plot 6 and 7 show a wandering line around 72 Hz, present in the CEB seismic probe but not in h(t).
