Today we wanted to investigate the effect of noise injection on the modulation index of the 56MHz sidebands. In order to do this, Federico arranged some hardware to inject noise downstream wrt the dedicated LNFS.
More details on the hardware will come in a dedicated entry.
The box used a DAC channel from the "ENVnoise" process to be powered, which also allowed us to inject noise (both a single line and shaped noise)
At beginning we realized a general attenuation of the modulation index was induced by Federico's box, so we compensated for it by increasing the modulation index by 2 dB throughout the lock acquisition steps. Also, we had to tune the longitudinal and angular phases and the offsets of the AA signals. Besides that, everything went smoothly and we reached easily Low Noise 3. The general sensitivity was worsened by the insertion of Federico's box, which was already known to be source of white noise.
The injections were made by sending lines at several frequencies, all with the same amplitude, and then by sending colored noise in two different bandwidths. We noticed a strong dependence of the antisymmetric port induced noise on the alignment set points, therefore we first optimized the alignment working point and then started the noise injections.
Below the list of GPS, duration 250 s
Single line
| GPS | Frequency [Hz] | Amplitude |
| 1232724039 | 22 | 5e-5 |
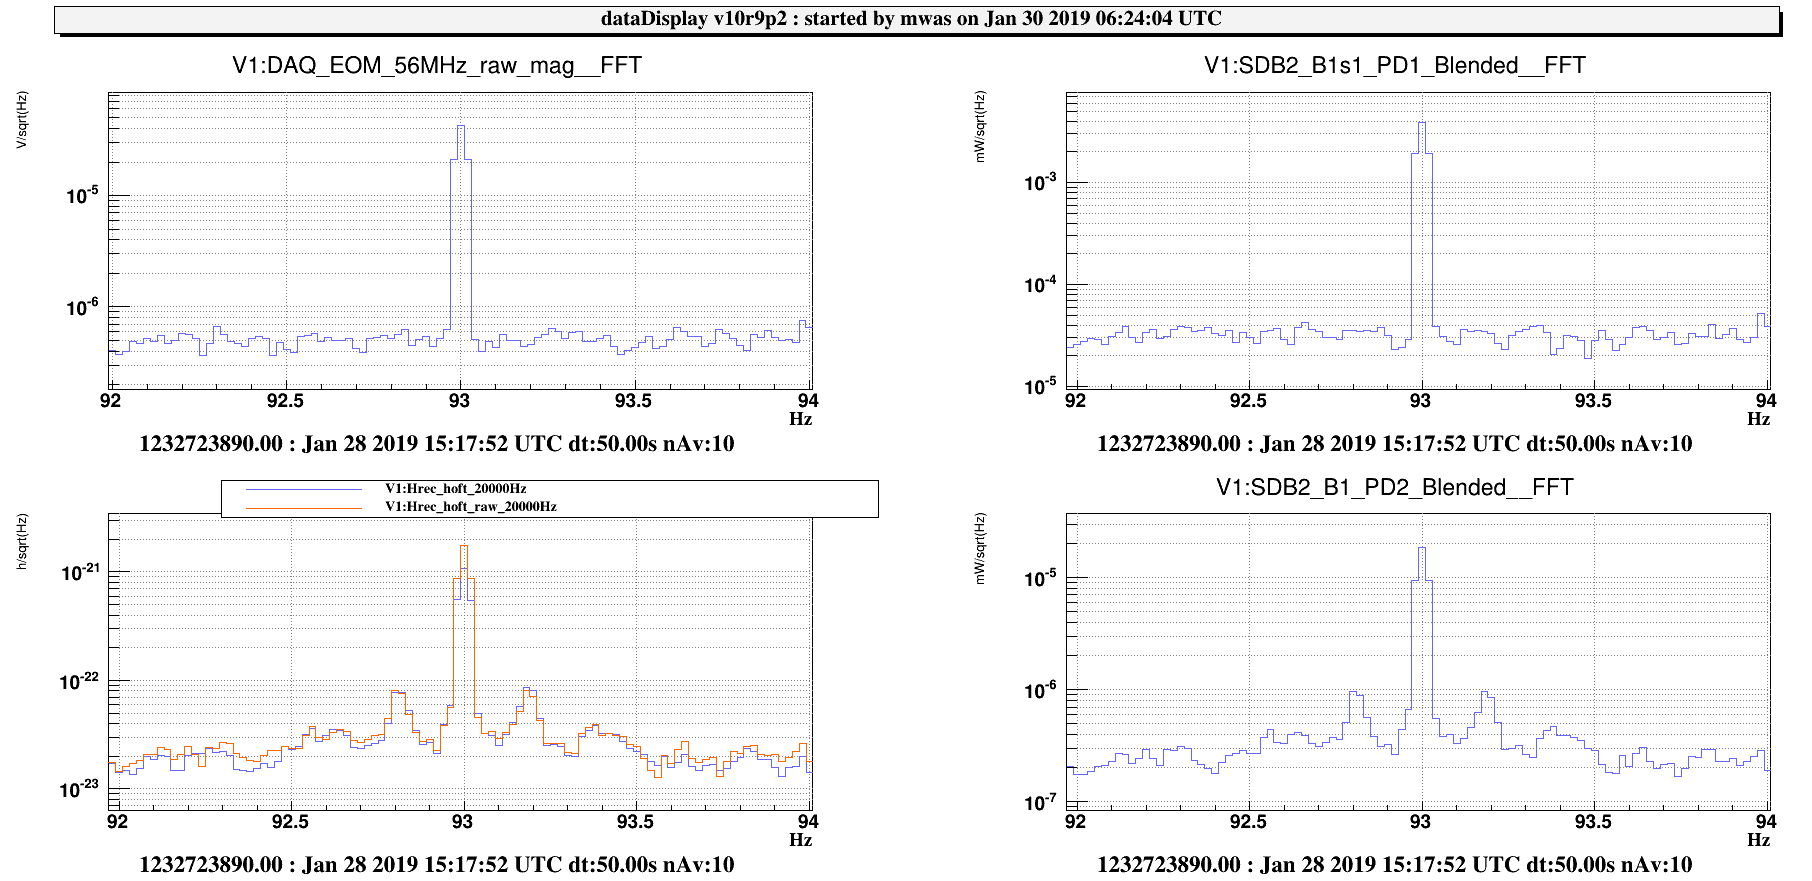
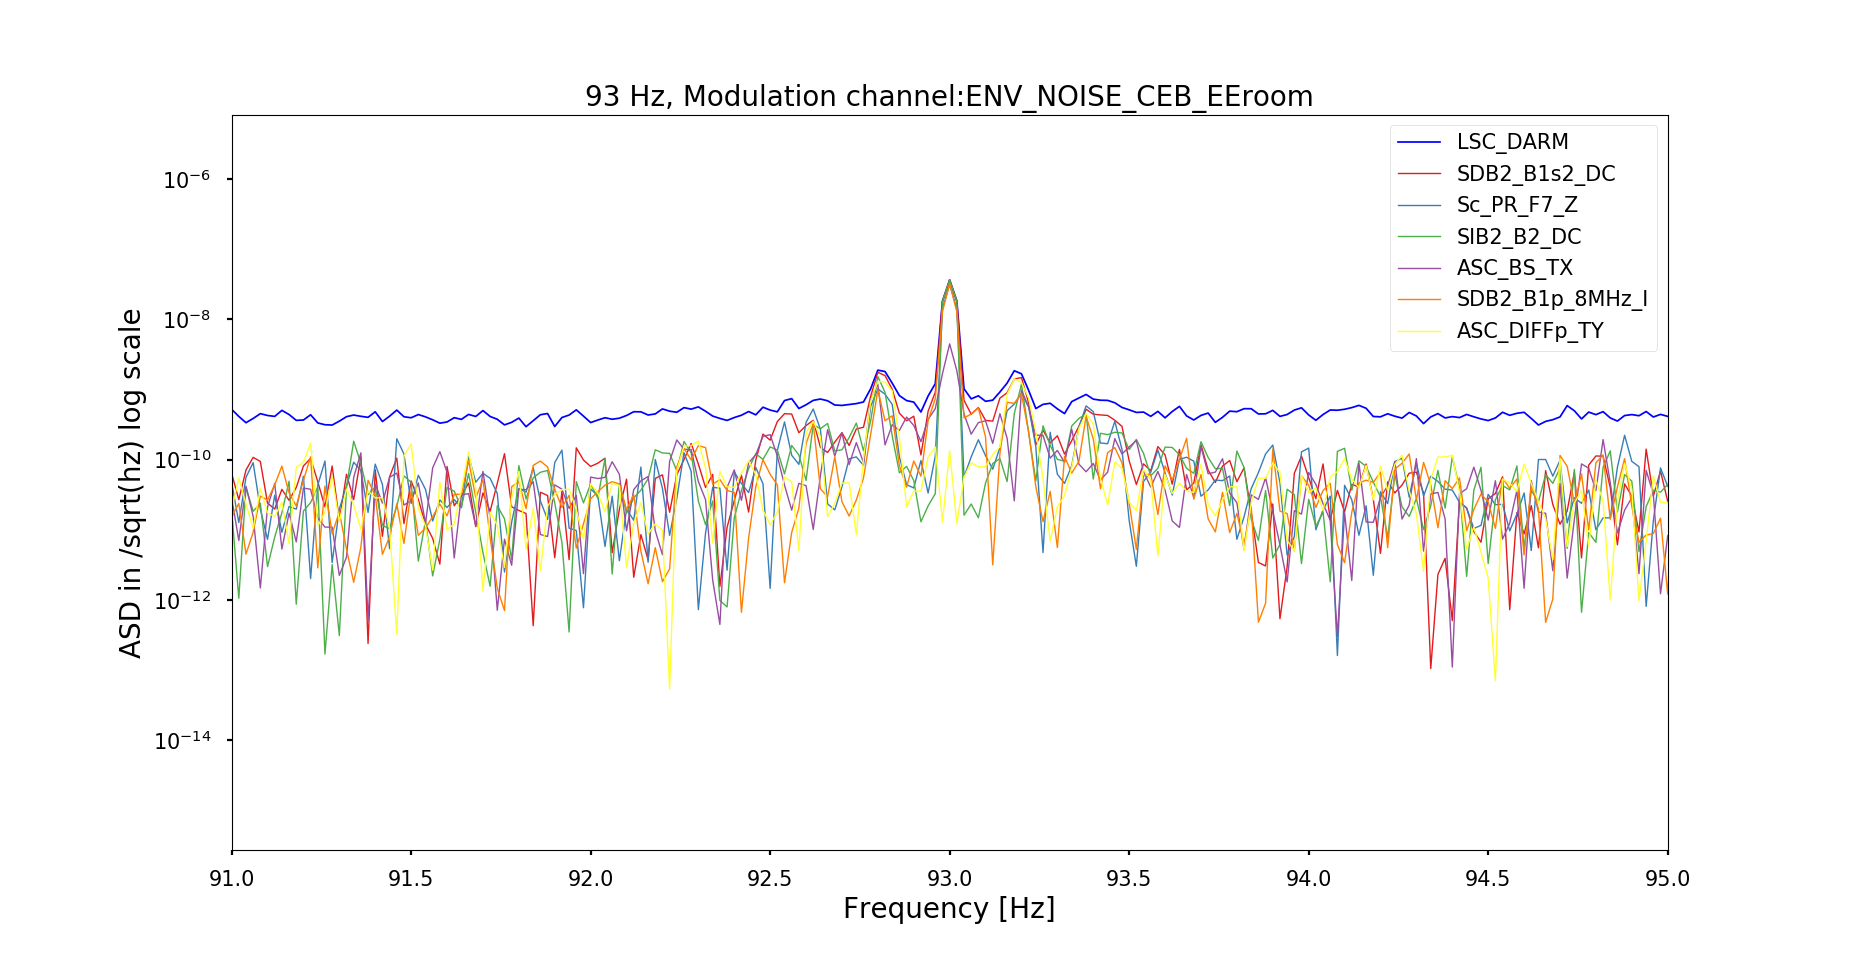
| 1232723665 | 93 | 5e-5 |
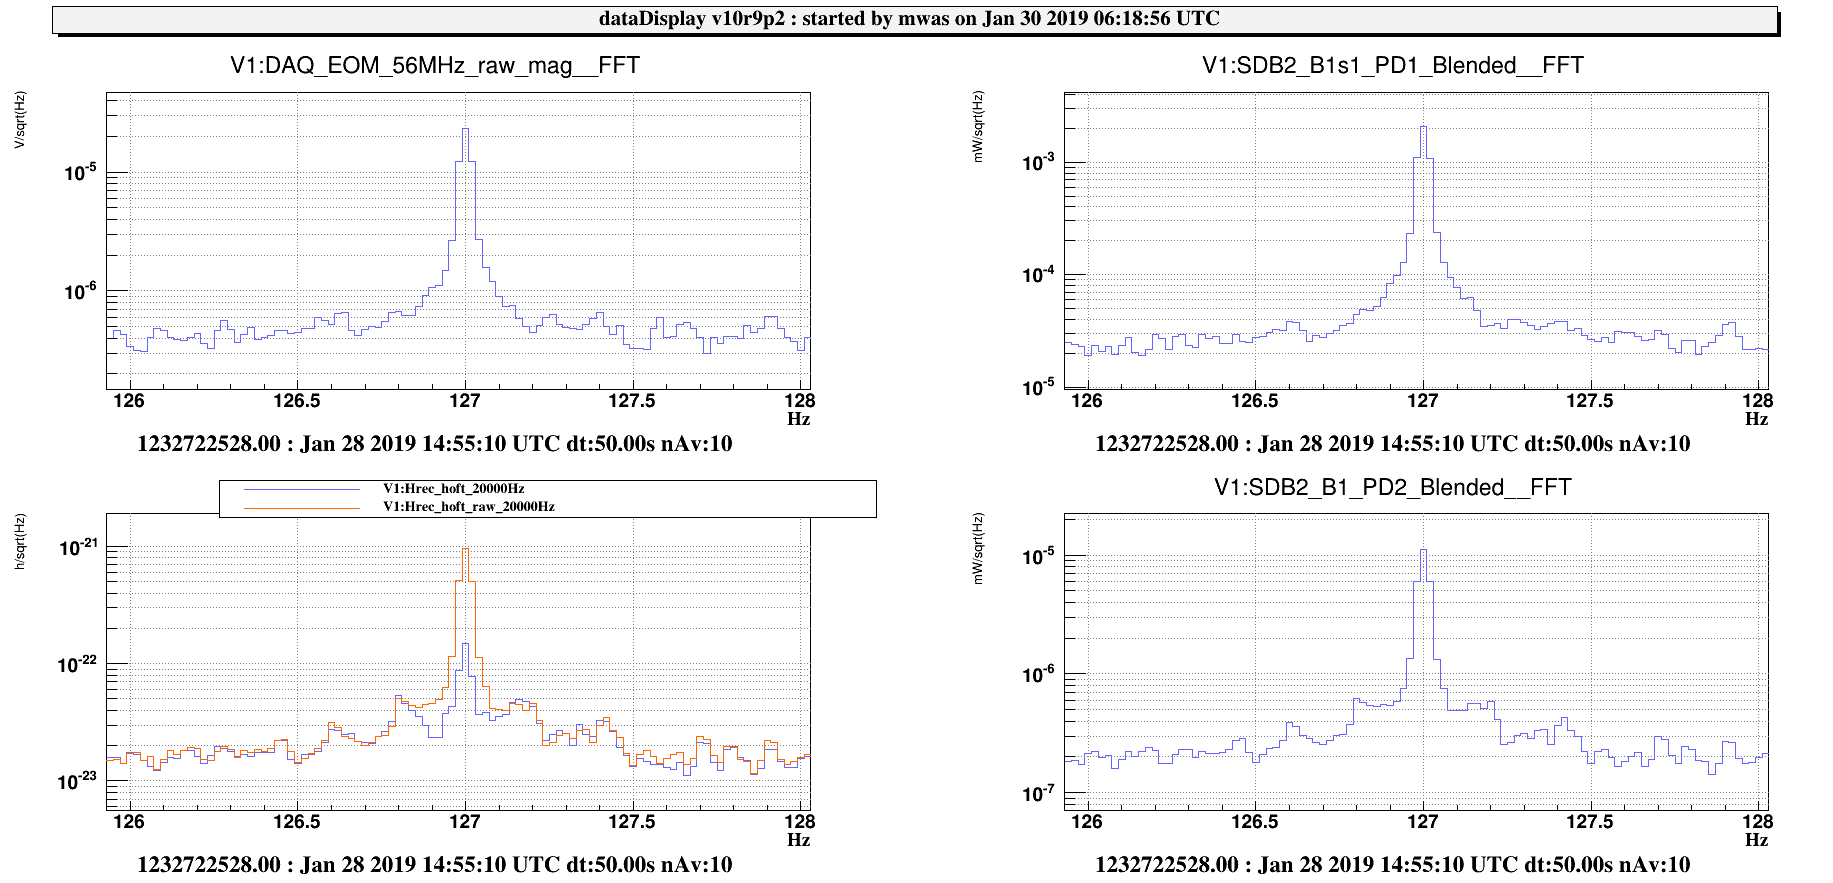
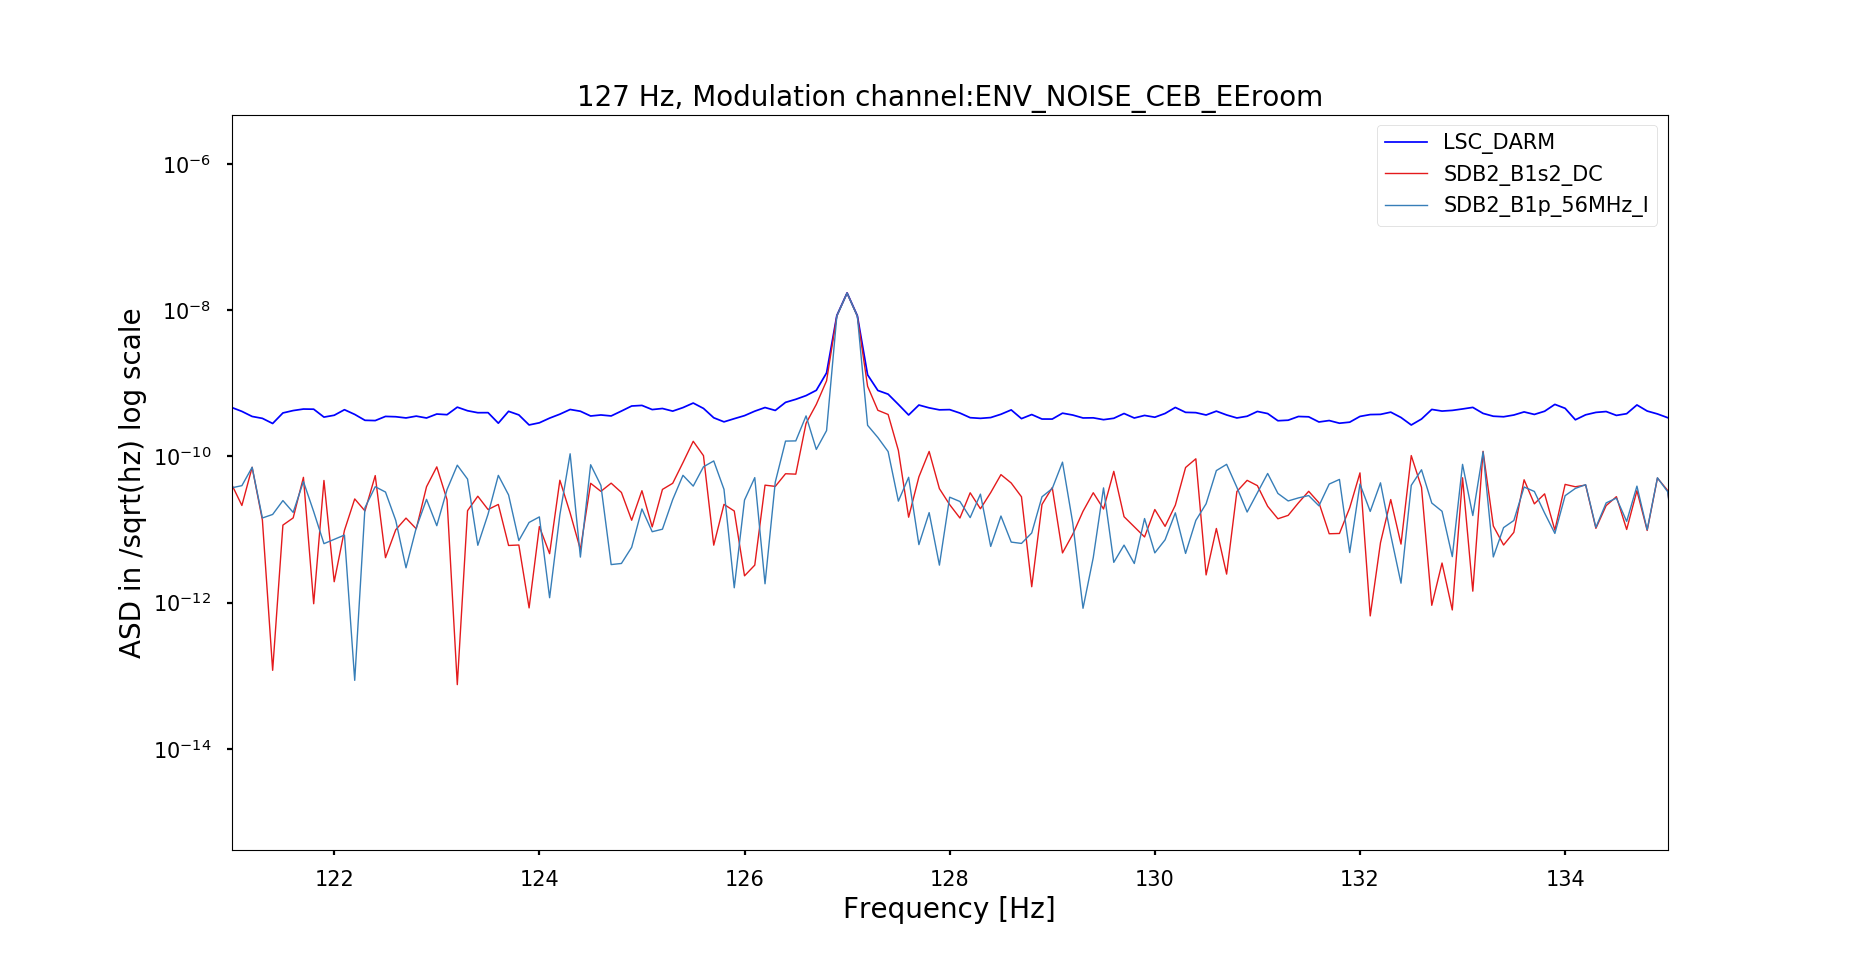
| 1232722303 | 127 | 5e-5 |
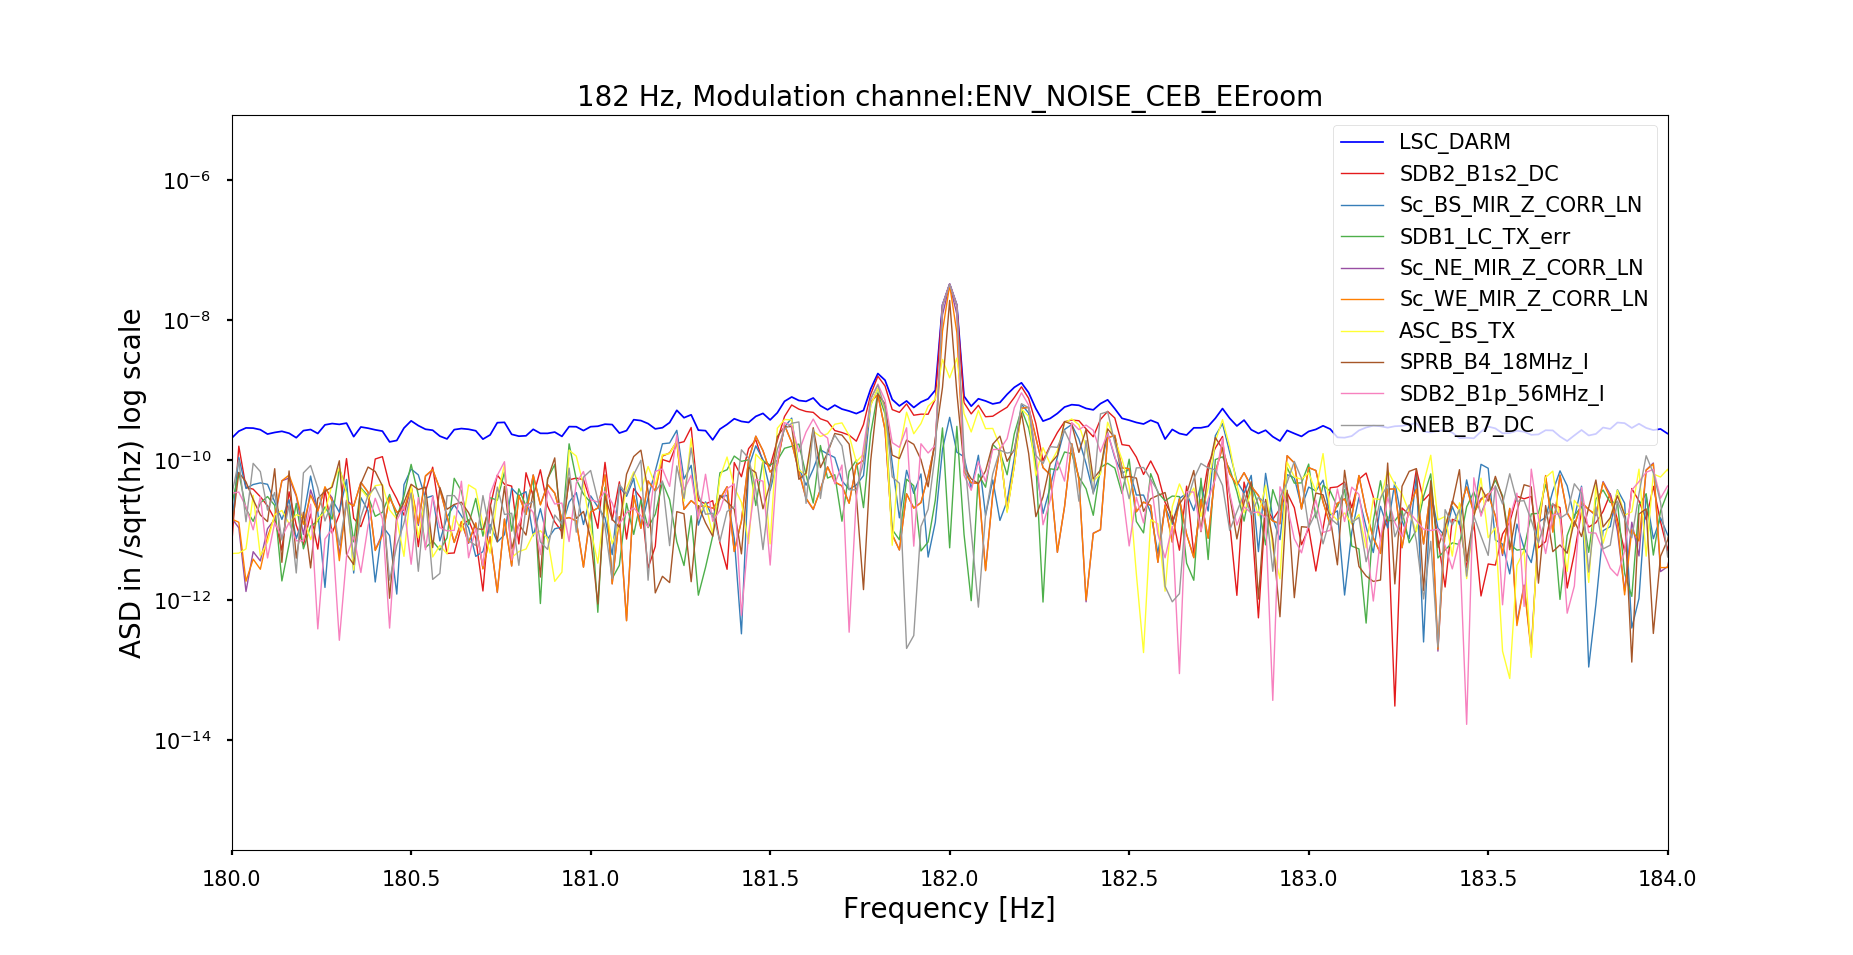
| 1232723313 | 182 | 5e-5 |
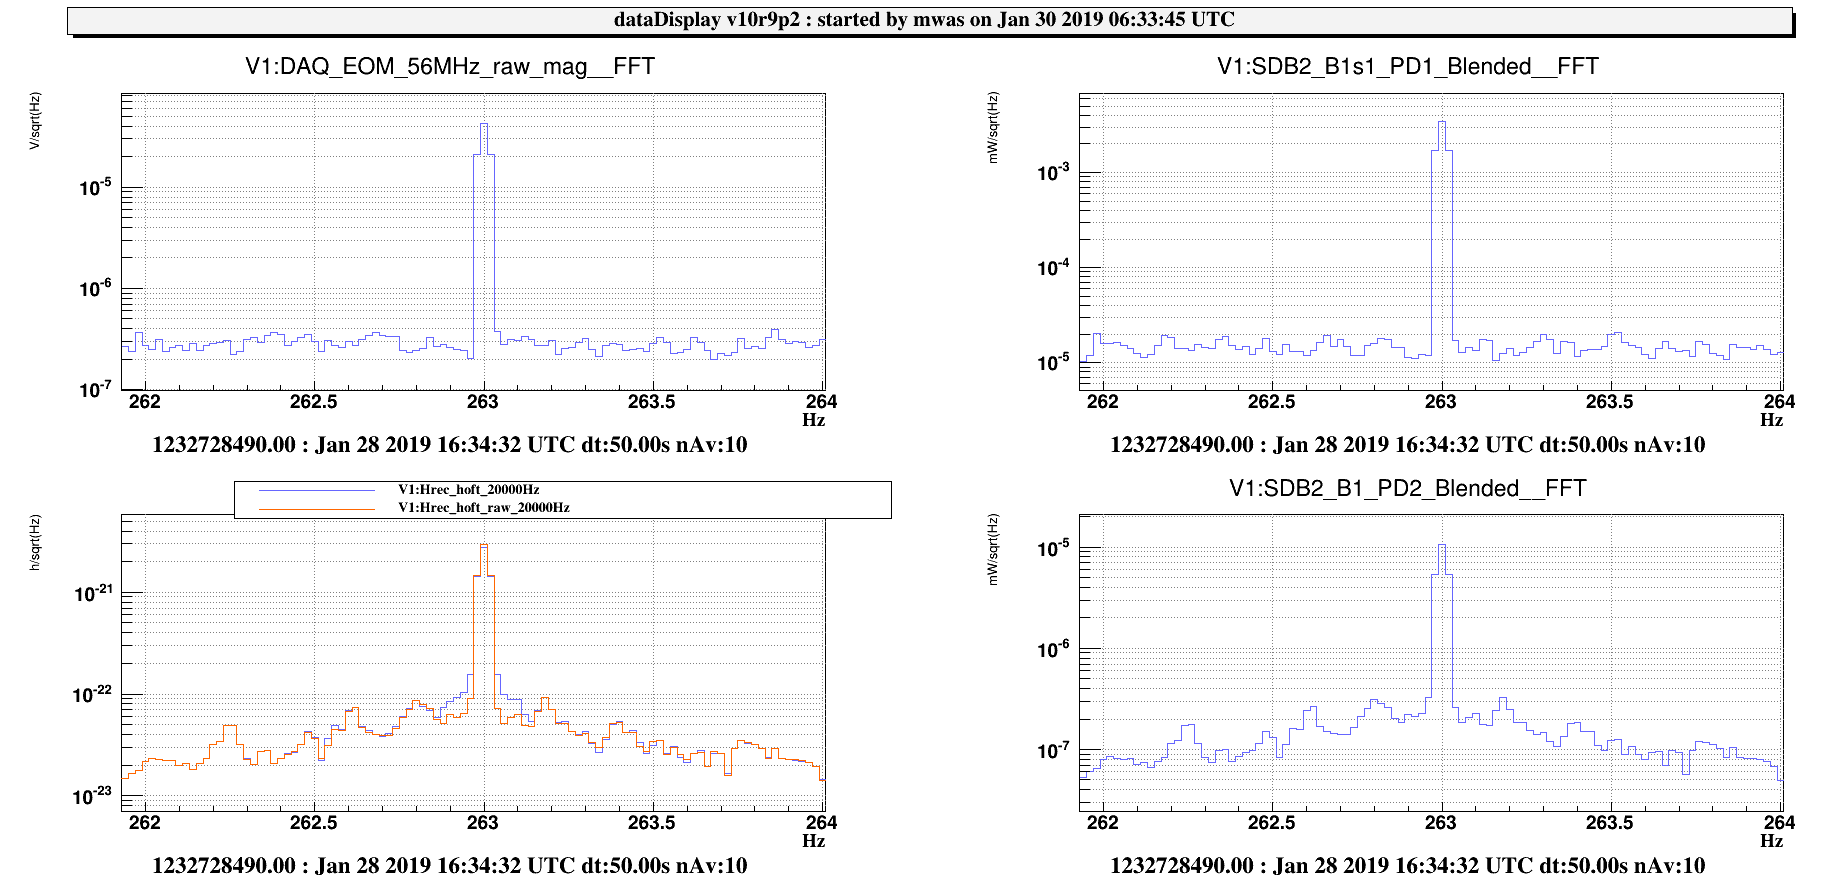
| 1232728265 | 263 | 5e-5 |
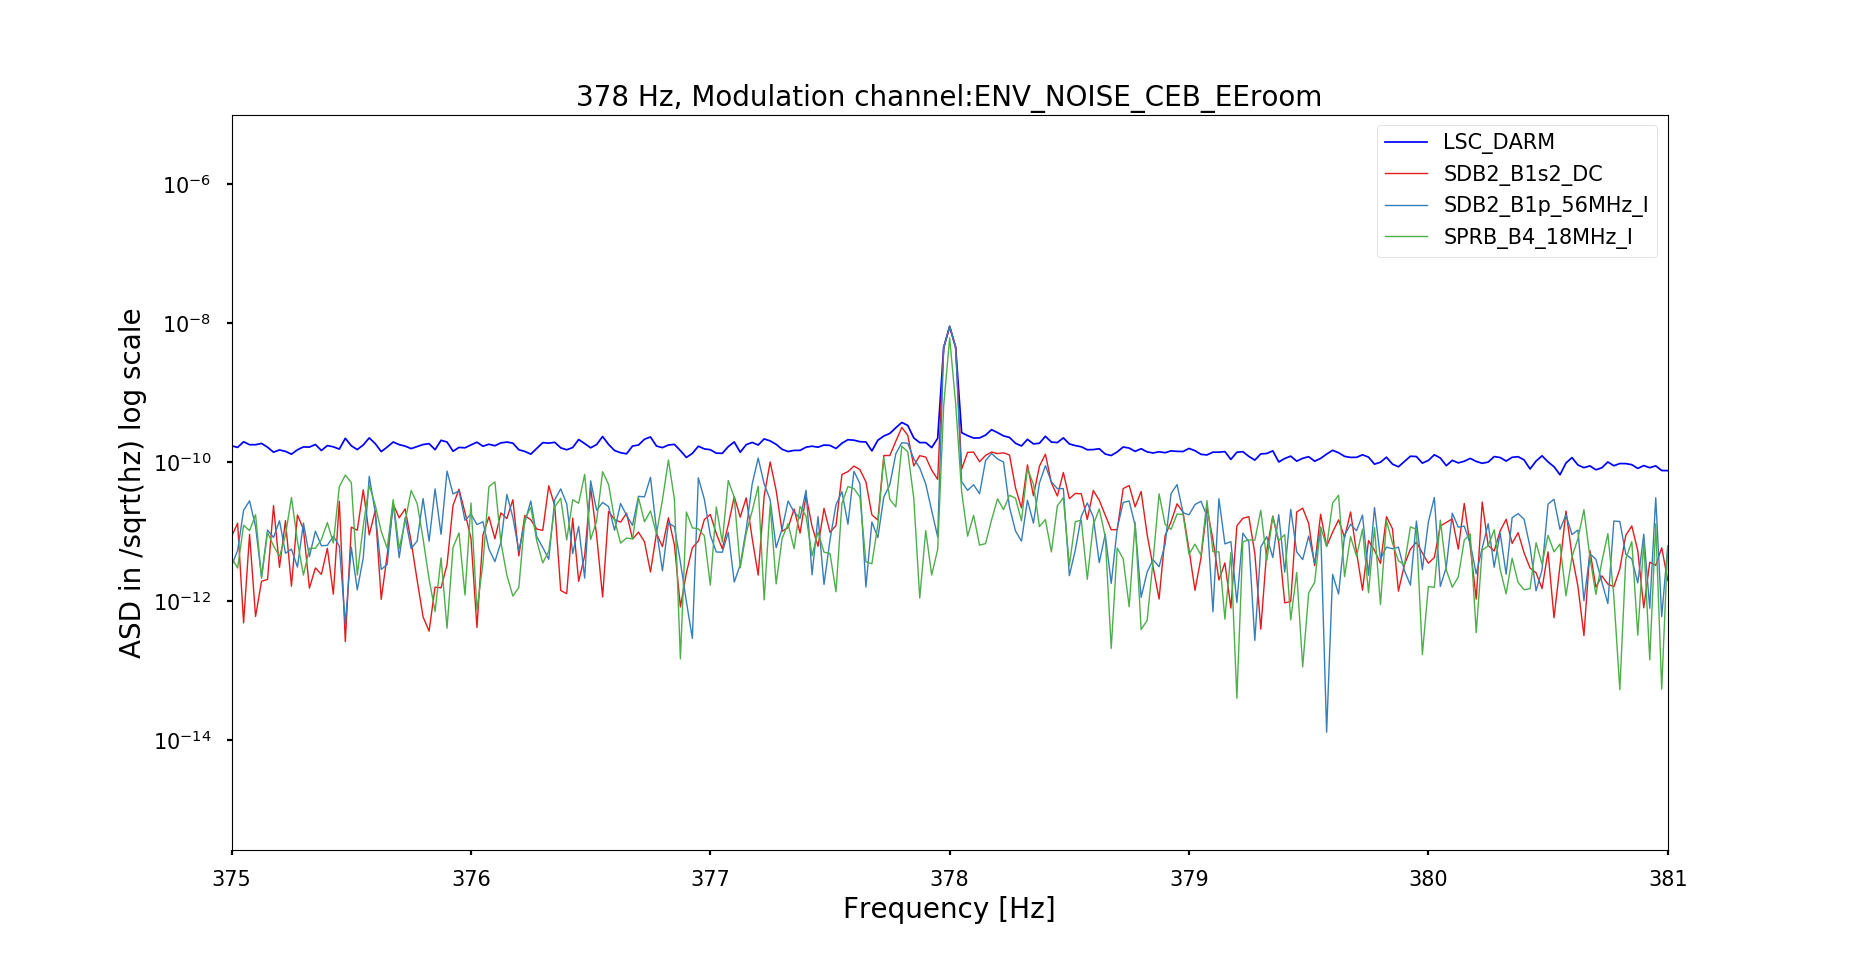
| 1232722778 | 378 | 5e-5 |
| 1232724369 | 576 | 5e-5 |
Broadband injections
| GPS | Band | Amplitude |
| 1232726609 | 50Hz - 750Hz | 1e-5 |
| 1232726932 | 50Hz - 750Hz | 2e-5 |
| 1232727297 | 20Hz - 980Hz | 2e-5 |
| 1232727673 | 20Hz - 980Hz | 5e-6 |
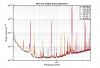
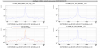
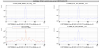
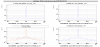
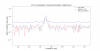
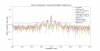
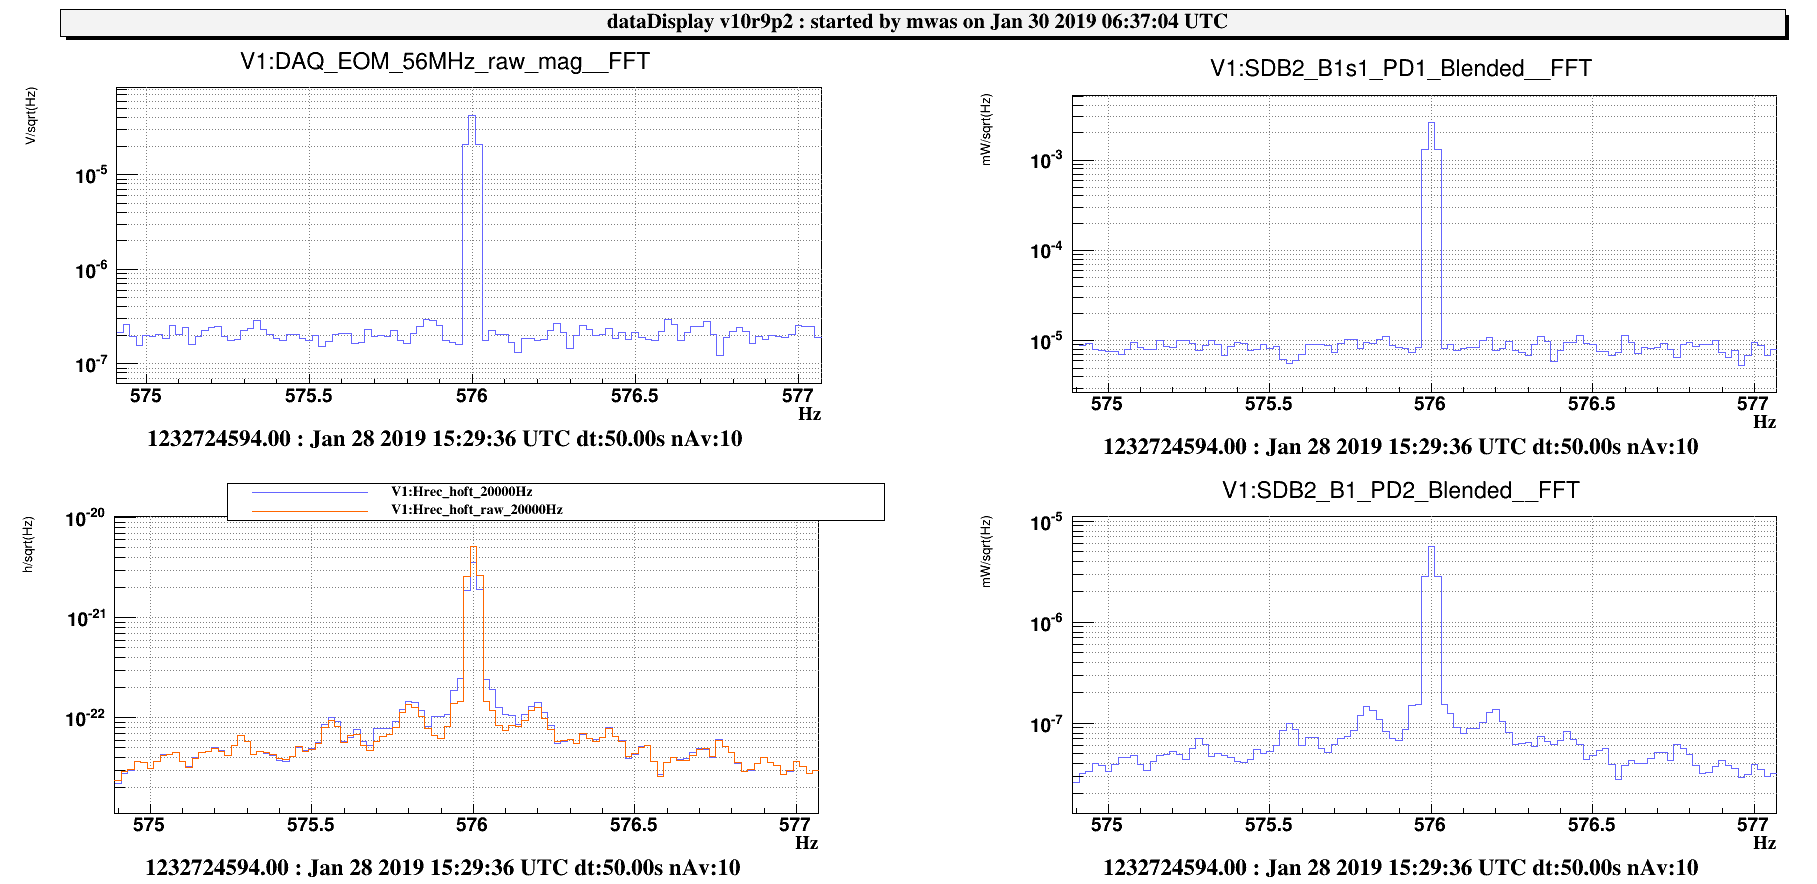
In figure 1, hrec at the different GPS times when the single line was injected is shown.
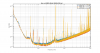
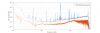
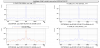
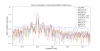
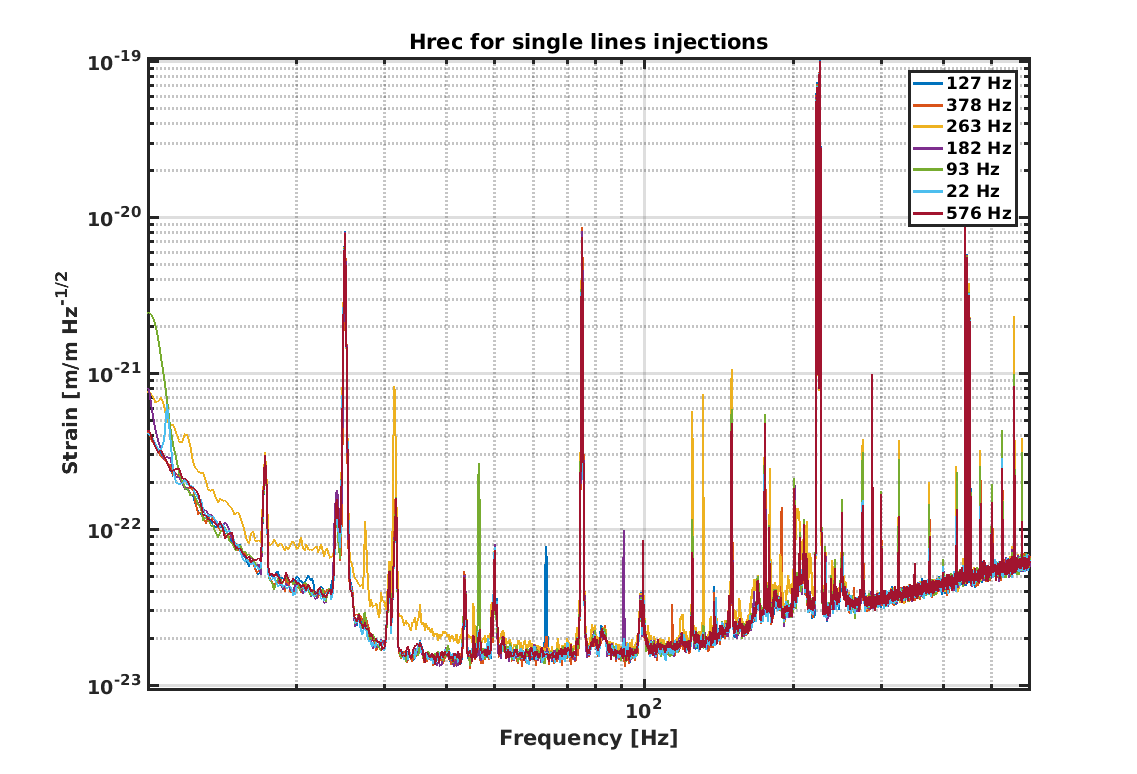
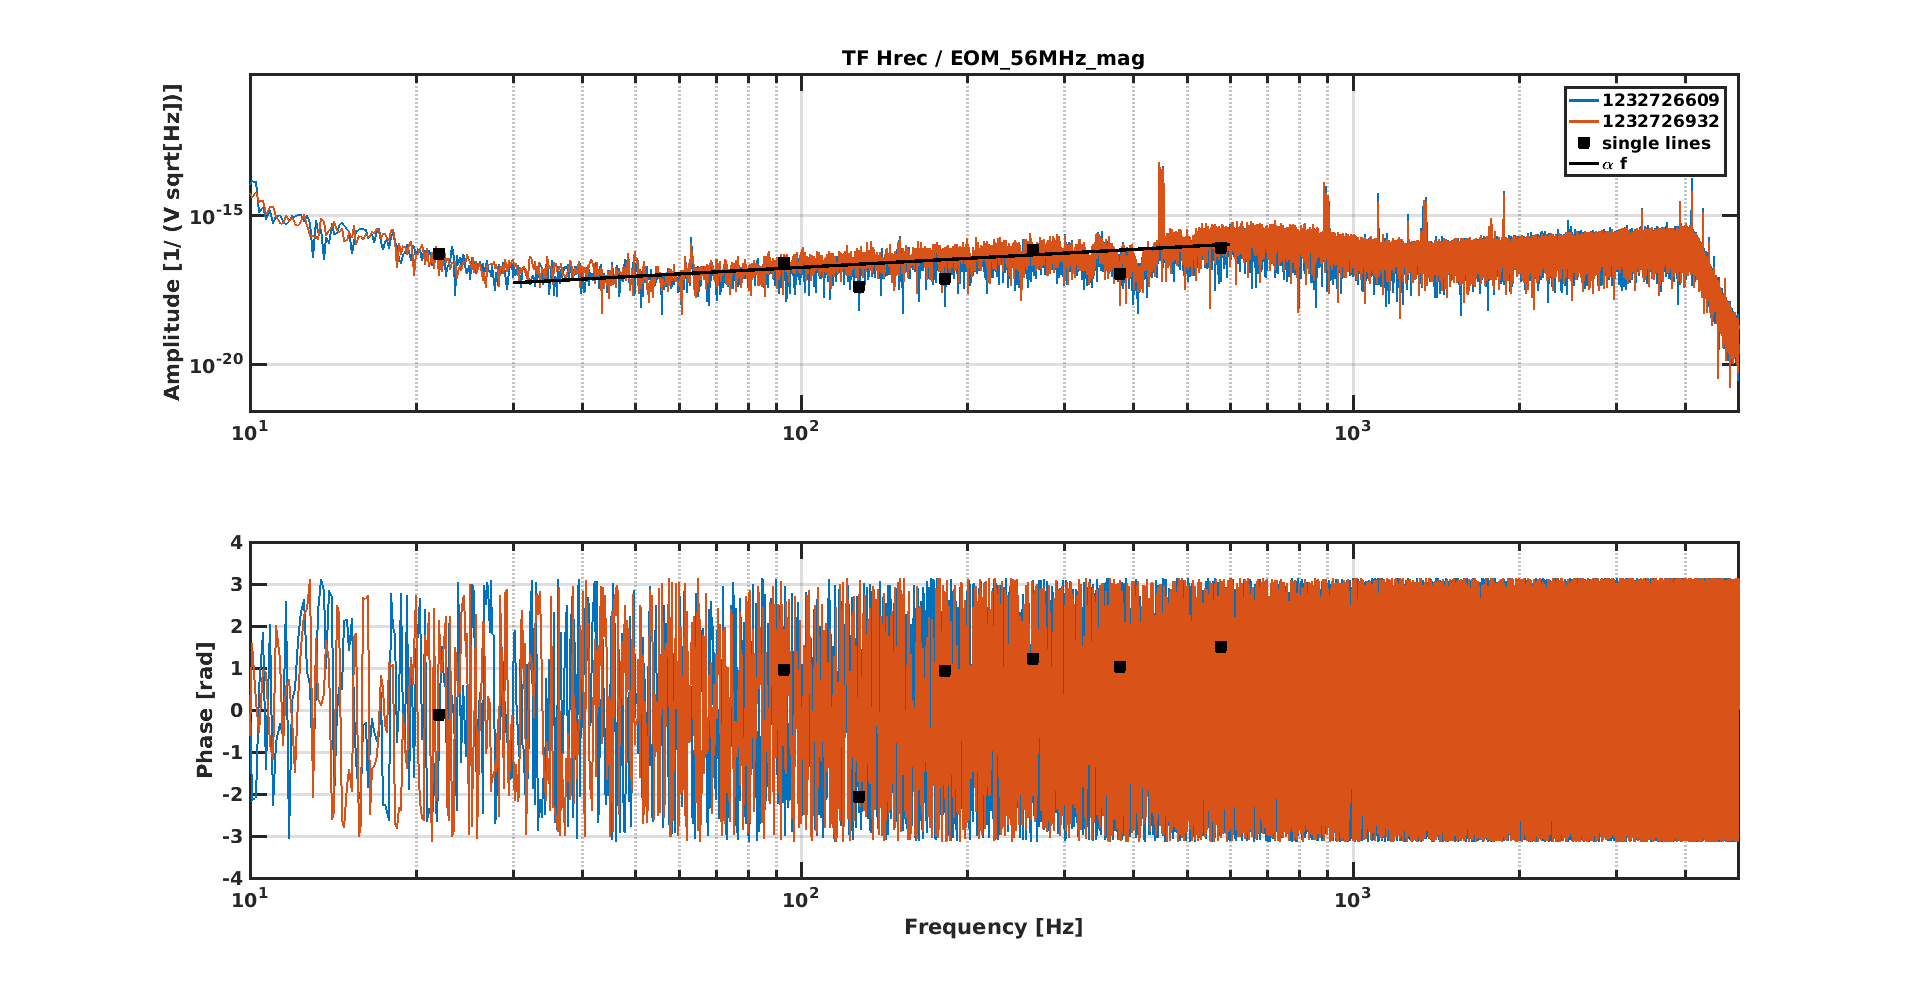
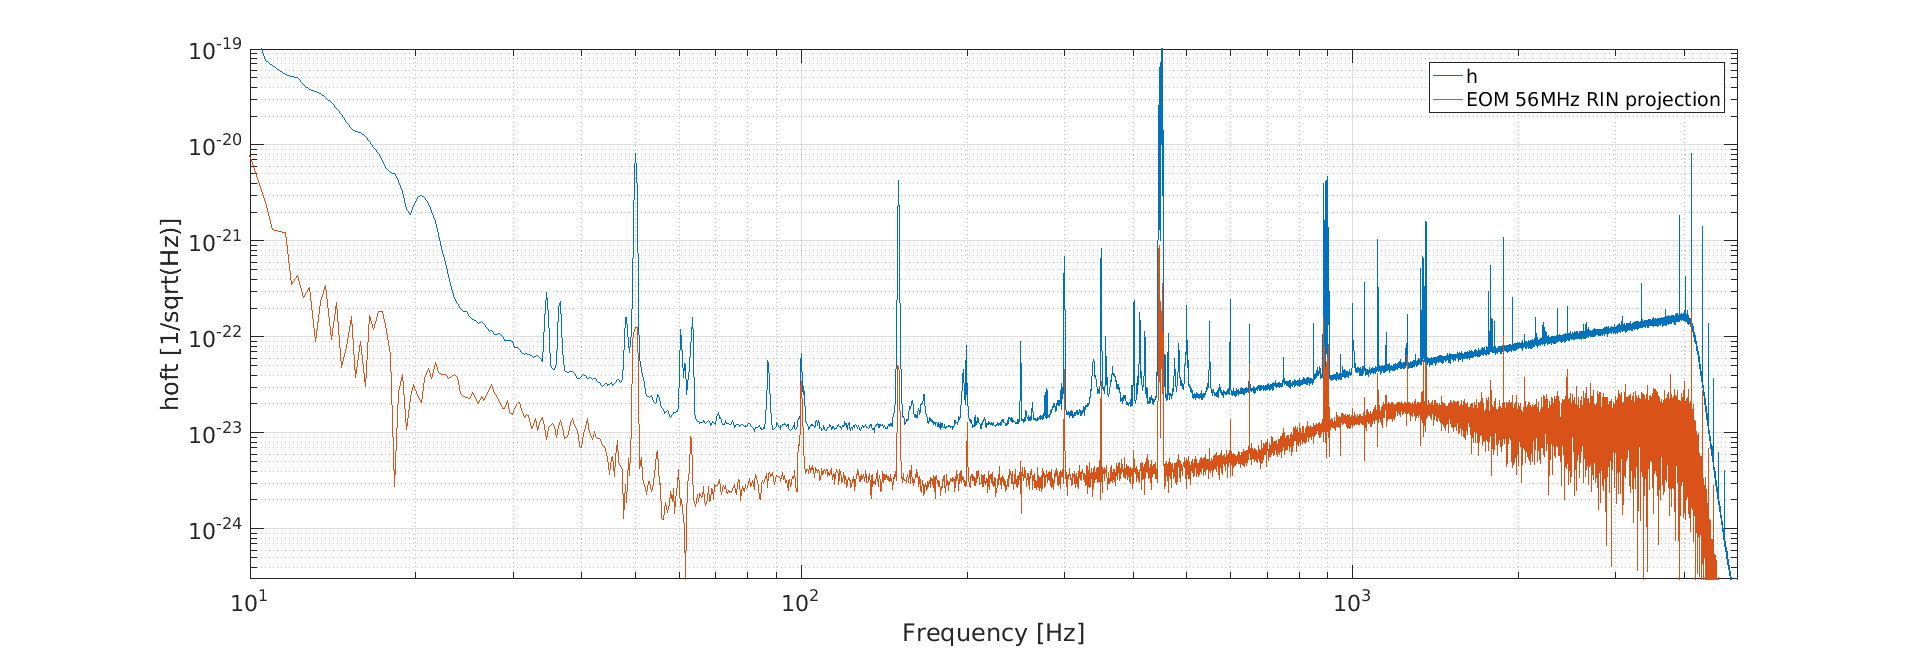
In figure 2 the transfer function between the channel DAQ_EOM_56MHz_mag_raw (which monitors the 56MHz amplitude and the injected noise) and Hrec is shown. The blue and the red curve correspond to the two broadband noise injections in the band 50Hz - 750Hz, while the black squares are the amplitude of the single injected lines. In the frequency range between ~30Hz and ~600Hz the curve can be fitted with a curve linearly proportional to f.
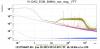
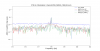
At the end of the shift we also tried to reduce the DARM offset in order to highlight any dependence of the coupling of the 56MHz RIN to the dark fringe:
| Darm set | GPS |
| 3e-4 | 1232728733 |
| 1.5e-4 | 1232728950 |
This was done with Federico's box still inserted in the chain, so there was a flat noise on the index of modulation. In figure 3, the hrec curves recorded at the different DARM_SETs. It looks like the coupling of this noise to the dark fringe depends on the darm offset, but deeper analysis is needed on this.
At the end of the shift, we rolled back the hardware, the longitudinal and angular phases and the alignment setpoints. We also tested the lock acquisition up to LN3 and found no problems.
A proper analysis will be done shortly.
| 5e-5 |
| 5e-5 |
| 5e-5 |
