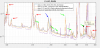
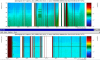
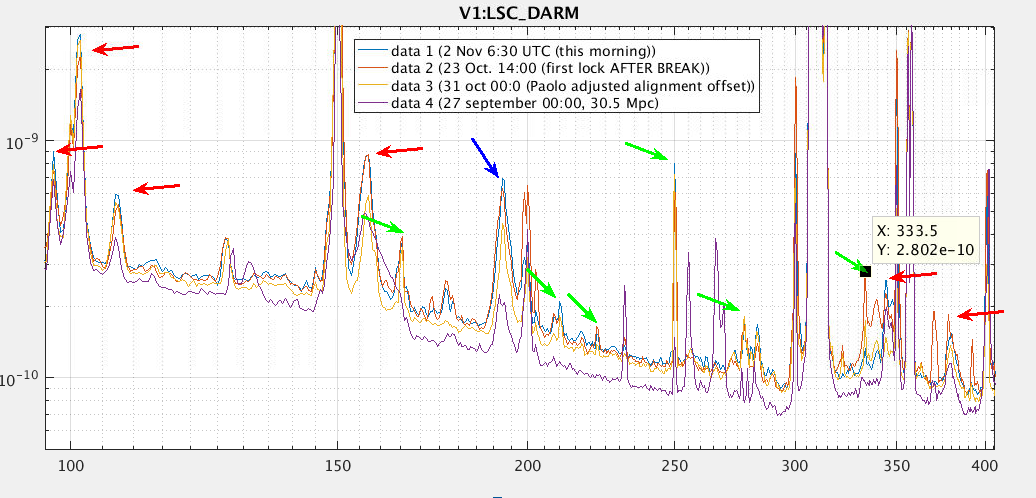
I had a look for old and new peaks and lines in Hrec in the 100 to 400Hz range. Figure 1 shows the examined peaks. As OLD time I am using Sept 27 midnight, 30.5MpC.
Old peaks: (indicated by a red or blue arrow in Figure 1)
| Old peaks in LSC_DARM (also in Sept 27, 30.5 Mpc) | |
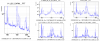
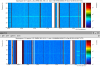
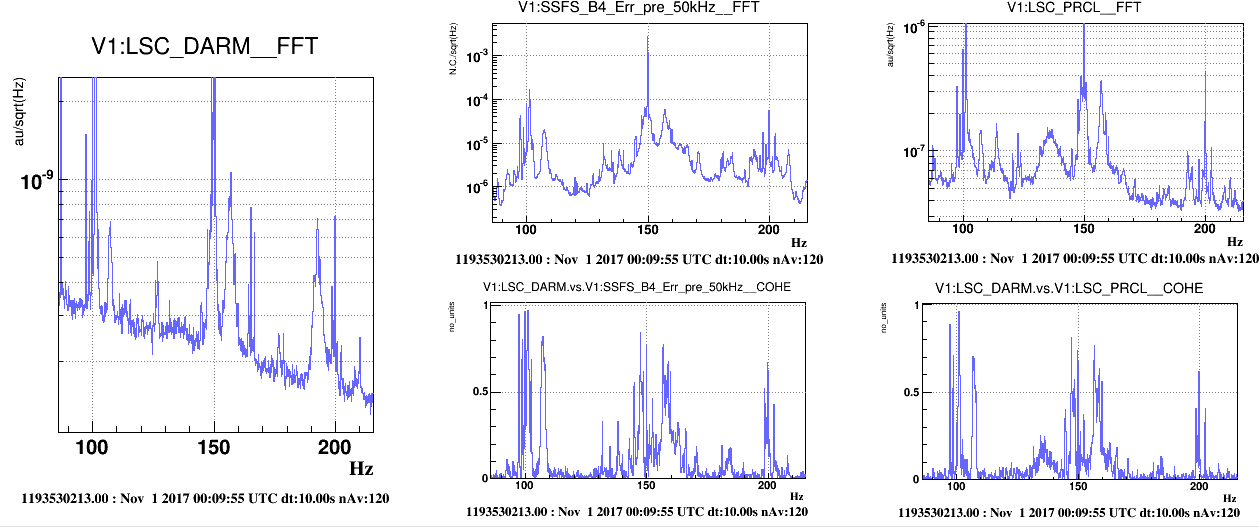
| 97.3 Hz | also in PRCL and SSFS, see Figure 2 |
| 101.5 Hz | also in PRCL and SSFS, see Figure 2 |
| 107 Hz | also in PRCL and SSFS, see Figure 2 |
| 156 Hz | also in PRCL and SSFS, see Figure 2 |
| 192.5 Hz | SDB1 |
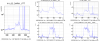
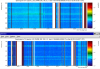
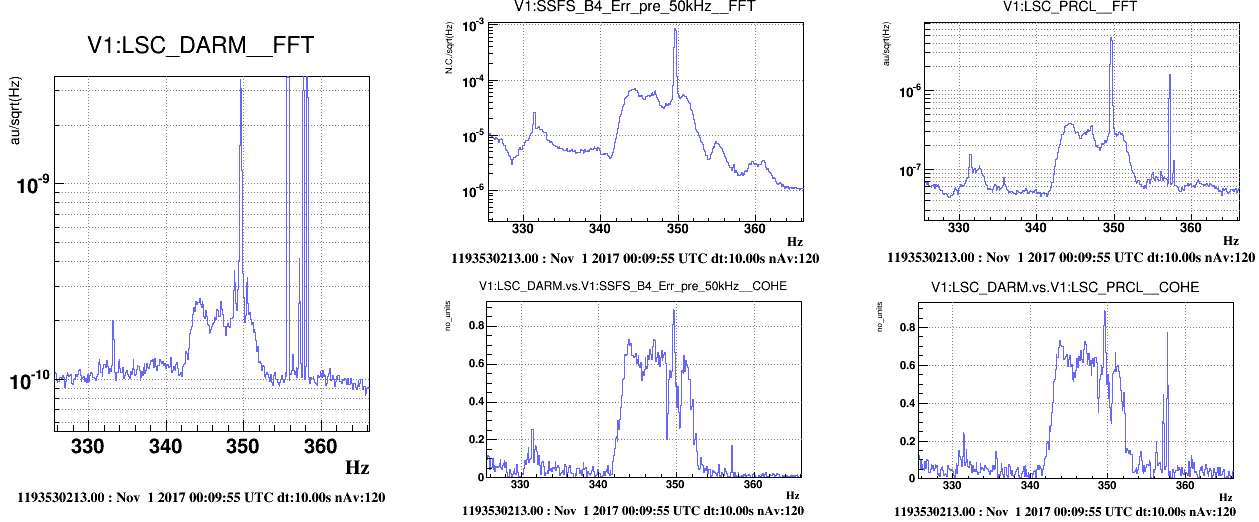
| 344 Hz | also in PRCL and SSFS, see Figure 3 |
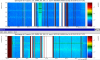
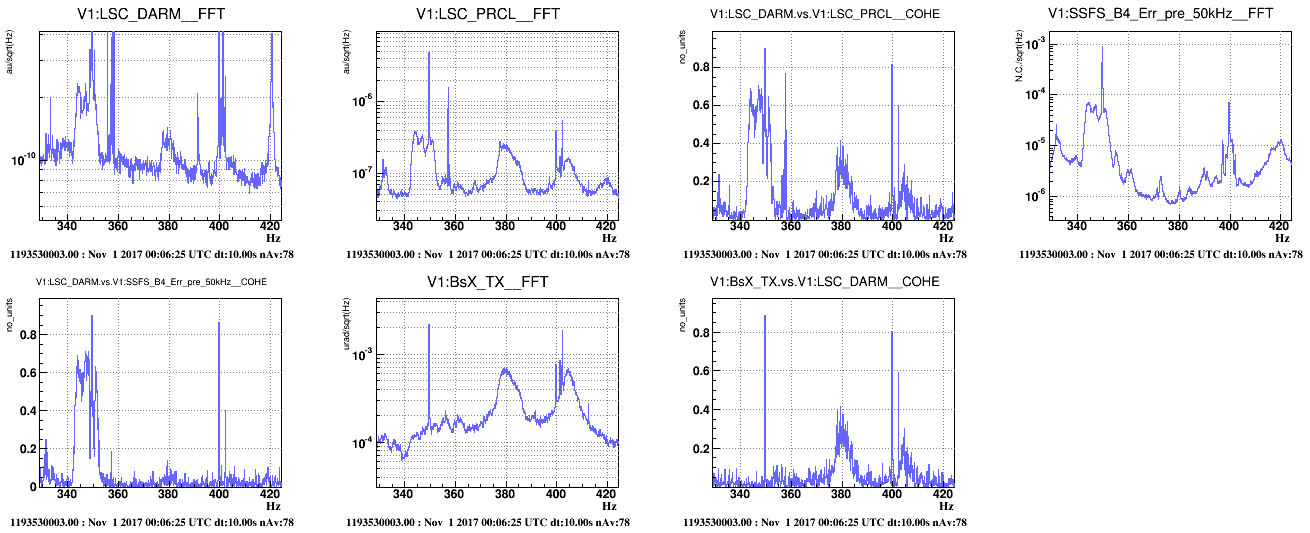
| 378.5 Hz | also in PRCL (not in SSFS, instead is in BsX_TX) see Figure 4 |
Note that most of these peaks are present (and coherent with) SSFS err and LSC_PRCL signals.
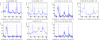
New stuff: since the first day after the break there are these few new narrow lines (indicated by GREEN arrows in Figure 1) and features:
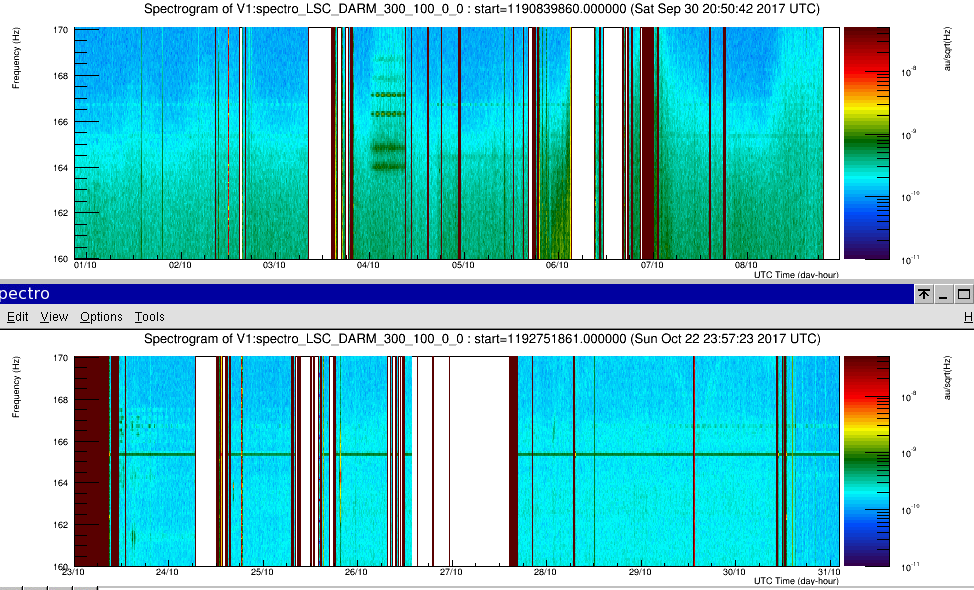
- since right after the break one narrow line at 165.3 Hz is on (or much stronger than before) see Figure 5. This might look like some calibration line, but I could not find it listed nowhere.
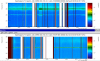
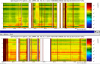
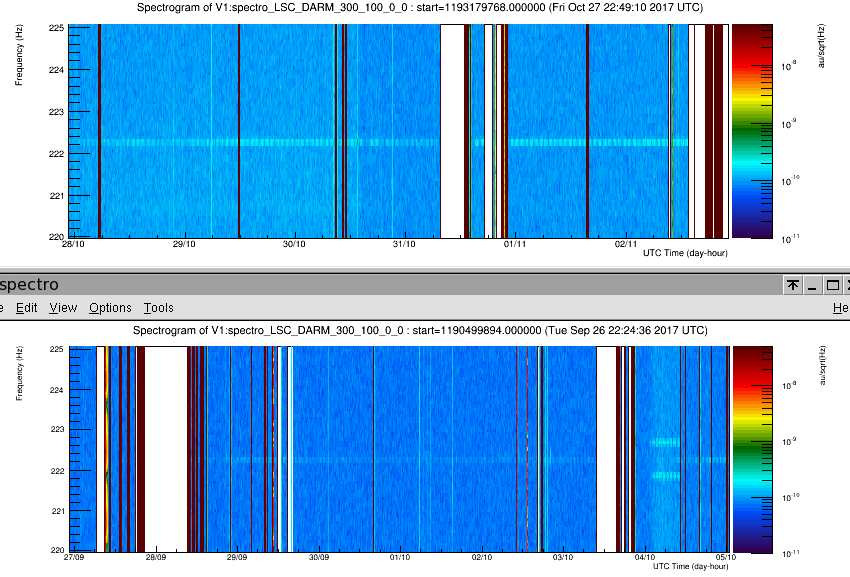
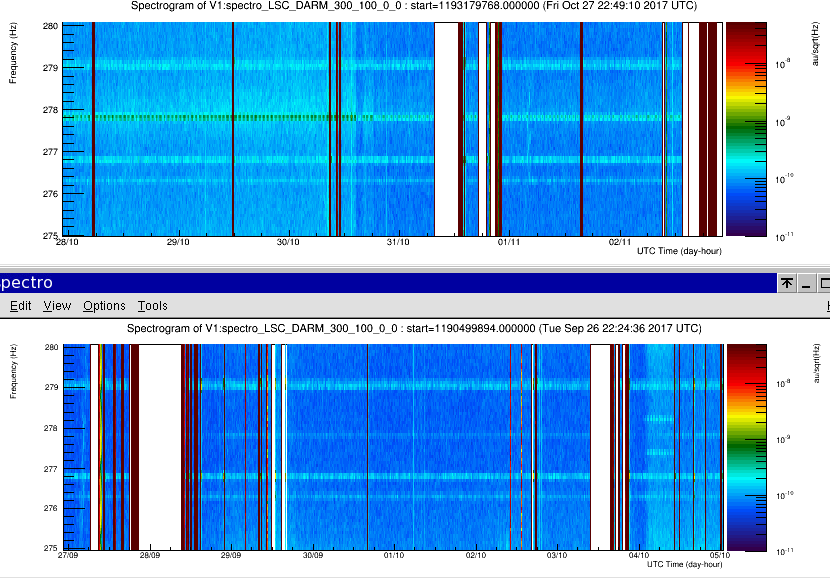
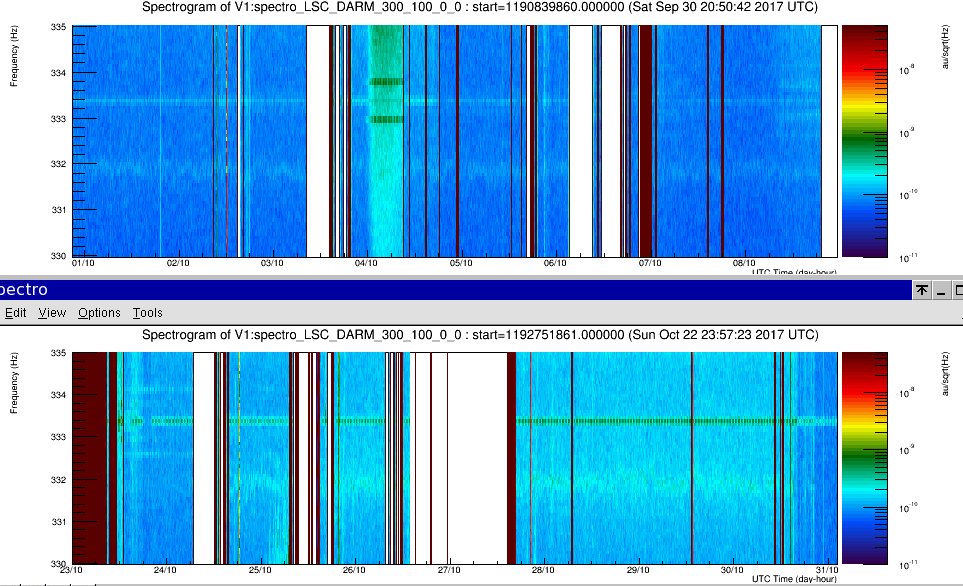
- narrow lines at 167, 222, 277, 333 Hz that are chopped or modulated with a periodicity of about 40mins. These lines were present ALSO BEFORE but generally they were less intense. More or less they look as multiples of some 55.x Hz. See Figures 6, 7, 8.
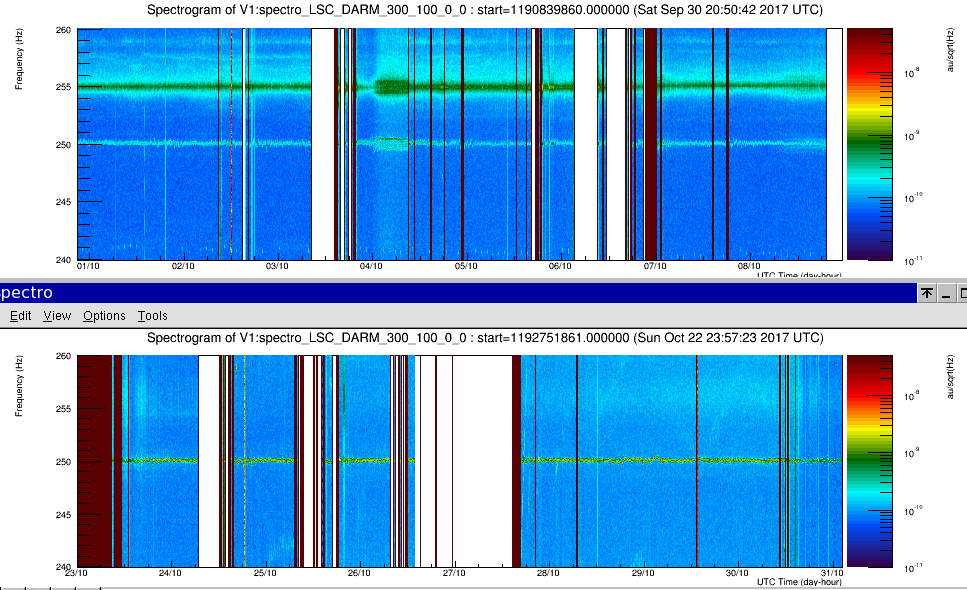
- since right after the break the 250Hz line is more intense, about a factor 10 more intense (see Figure 9)
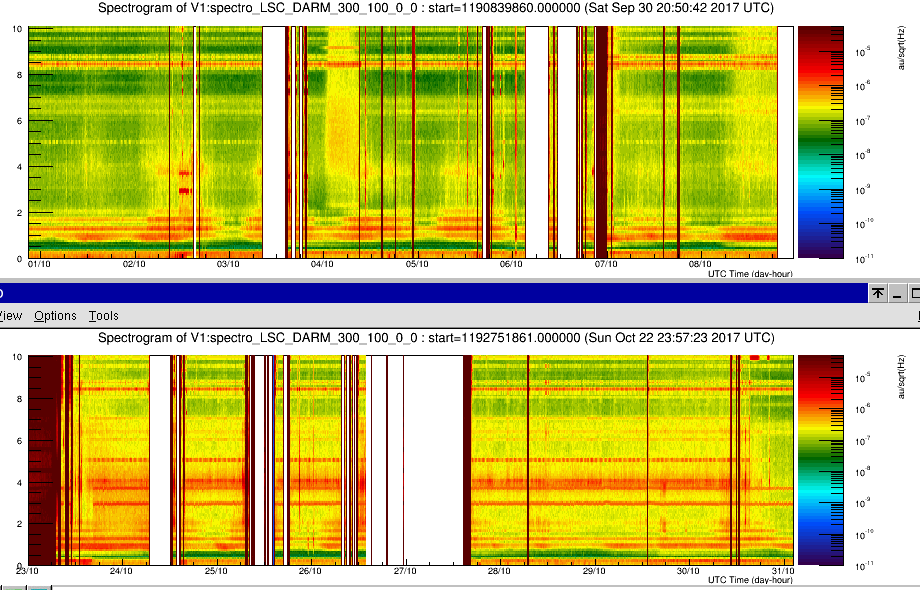
- since right after the break the low frequency noise, DARM below 10Hz, seems overall higher (Figure 10).