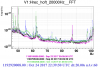
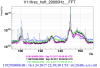
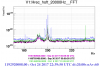
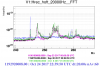
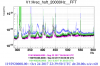
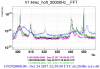
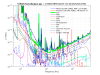
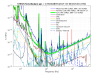
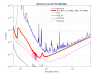
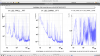
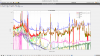
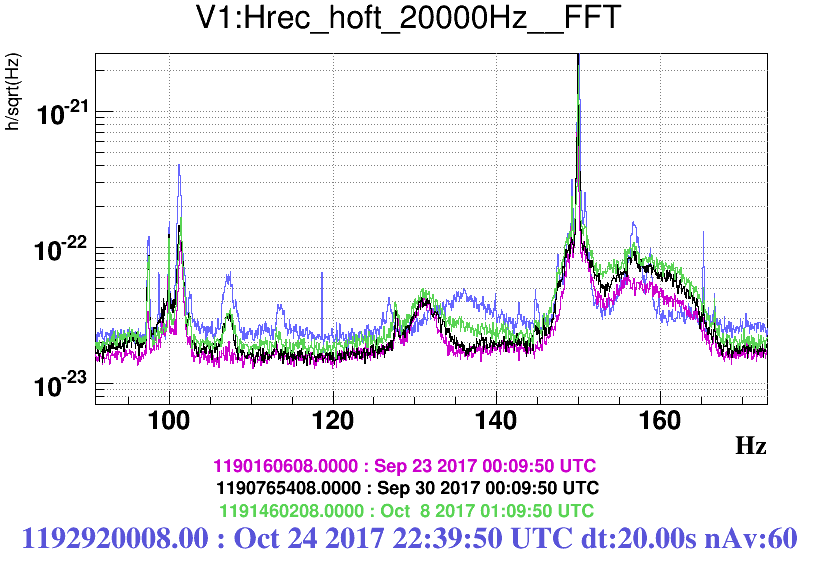
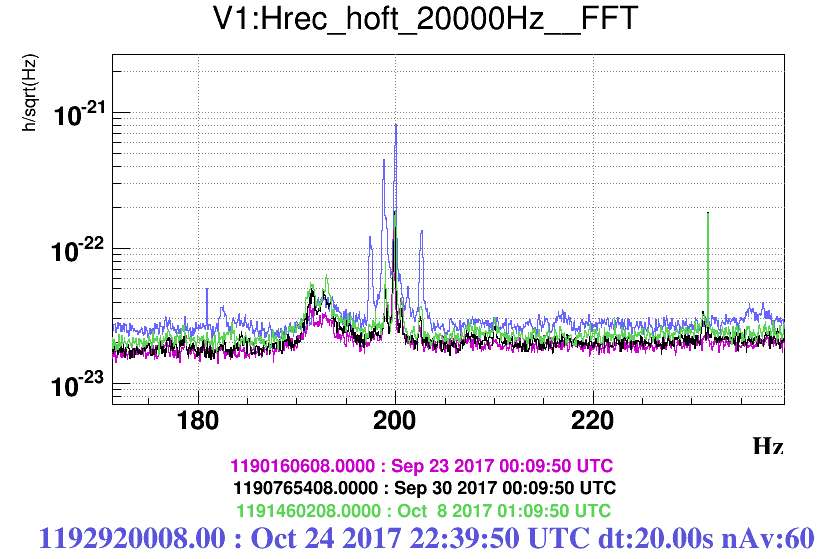
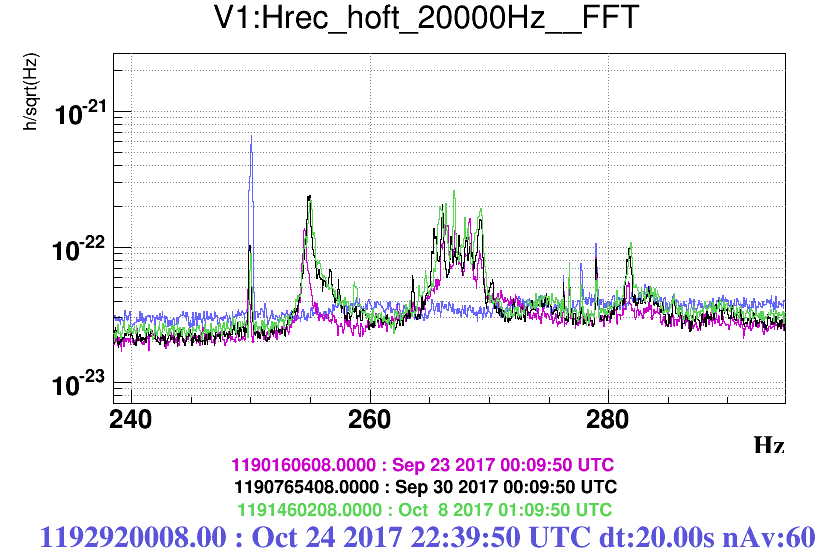
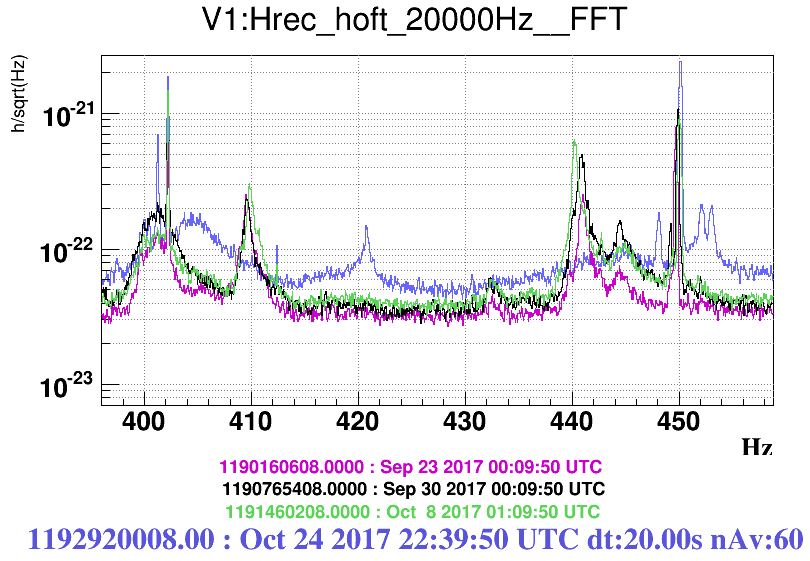
The following plots compare Hrec structures at four times: one time with good sensitivity sept 23 (30Mpc), two times with worsened sensitivity before the venting (sept 30 and Oct 8) and then last night (Oct 24 at 22:30).
Figure 1: 50-100Hz, Figure 2: 100-170Hz, Figure 3 (170-240) Figure 4 (240-290) Figure 5 (290-600) Figure 6 (zoom-in 400-450).
A few peaks disappeared with respect to before venting:
- peaks at 255Hz and around 260Hz and something around 280Hz disappeared (these peaks were coupling acoustically in CEB and at least some of them were found to be due cooling fans) - see it in Figure 4.
A few peaks disappeared or moved with respect to before venting:
- 410Hz and 440Hz disappeared, but new ones appeared at 401Hz, 420Hz, and around 450Hz. - see Figure 6
A few peaks appeared or enhanced with respect to before the venting:
- new peaks around 55Hz (Figure 1)
- new (and ehanced) peaks around 200Hz (Figure 3)
- several enhanced peaks but also new peaks between 300 and 600Hz (Figure 5).
