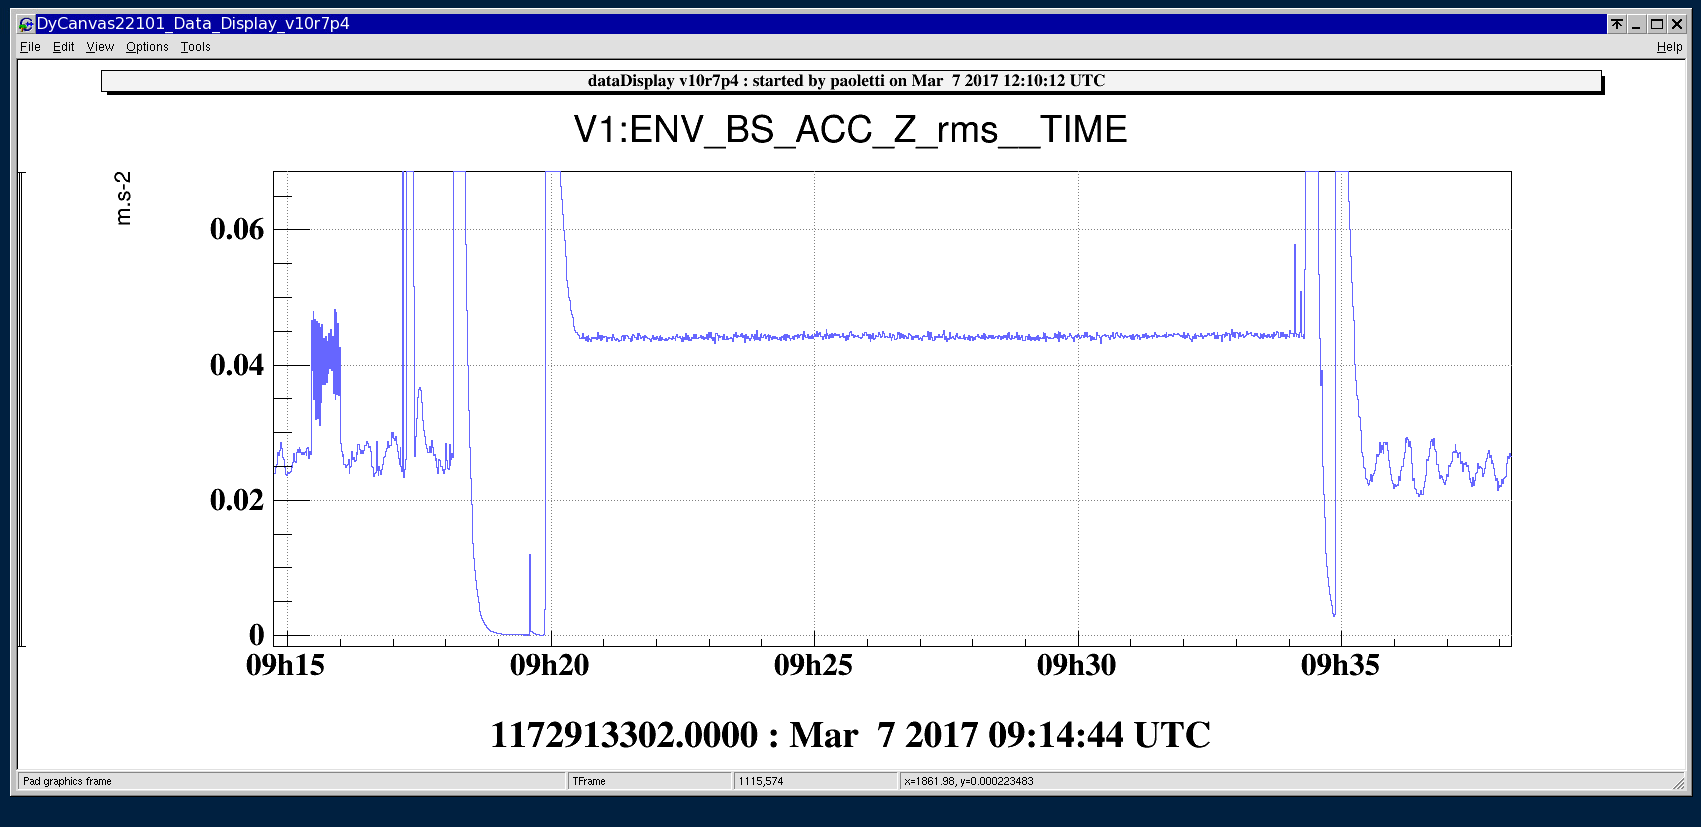
Time of good data stretch is from 9:21 to 9:33 UTC, while it has to considered "bad data" (by the point of view of its original location) from 9:15 to 9:35 UTC
The piezo-accelerometer has been used in its vertical position during the test, about 20cm far from the Guralp.
Analysis will follow in a dedicated entry.
Everything is now come back to the original configuration.
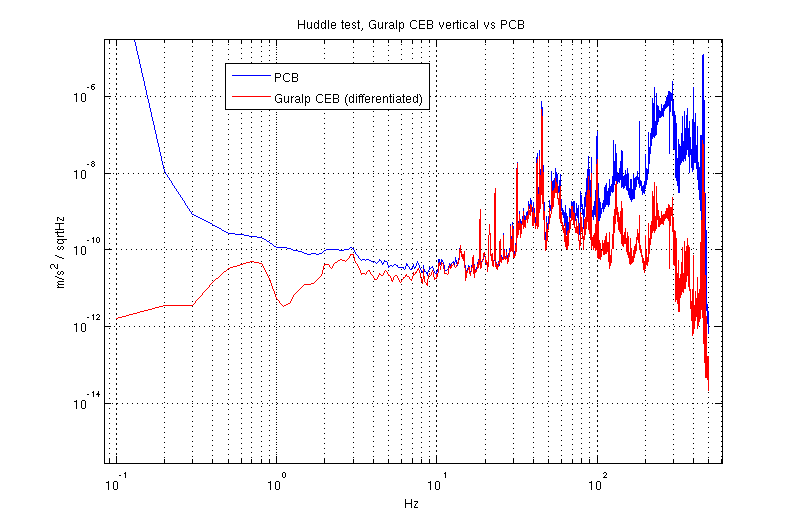
We used these data to perform a check of the response function of the CEB Guralp sensor above 10Hz. We did this to reassure us about the trulyness of some structures we noticed in the Guralp signal around 100Hz (see a dedicated entry).
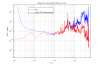
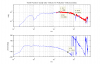
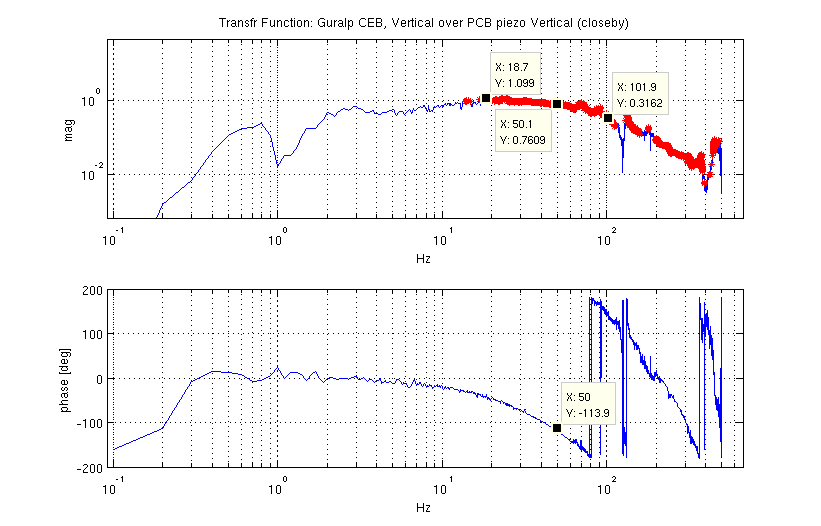
So, Fig. 1 compares spectra of Guralp vertical and the nearby PCB (Guralp signal has been differentiated) and Fig.2 shows the transfer function (in red we mark the frequency regions with coherence above 0.9). Assuming from specs that the PCB sensor unity response range is 0.15Hz to 1kHz (at %5), we find good agreement between our measurements and the Guralp specs, for both the mag and phase rotation: the Guralp response drops by about 25% (-2.5dB) at 50Hz with a phase rotation of -110°, drops by about 70% at 100Hz and by about a factor 10 at 200Hz.