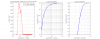
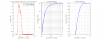
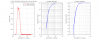
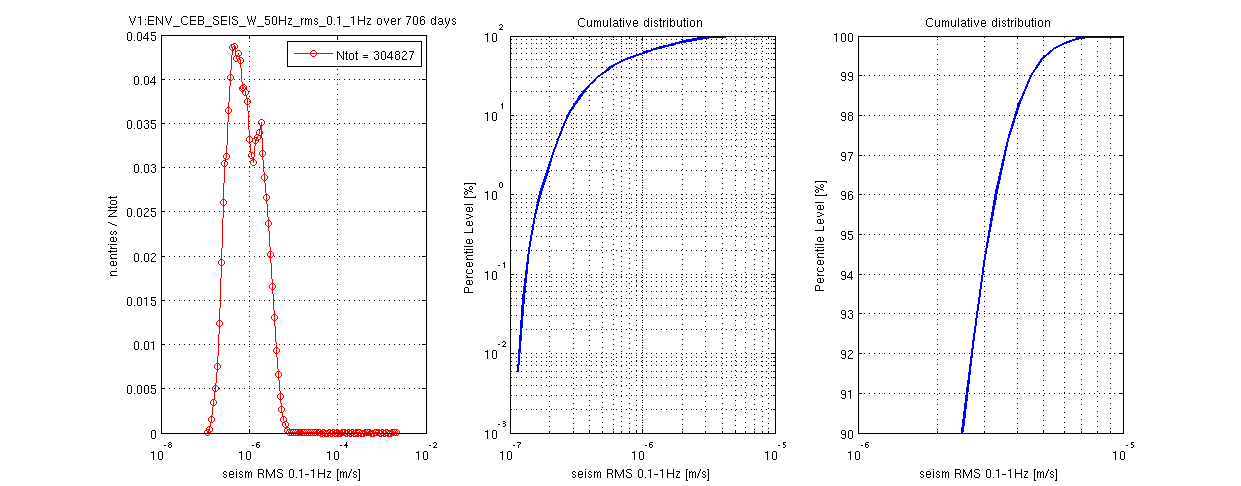
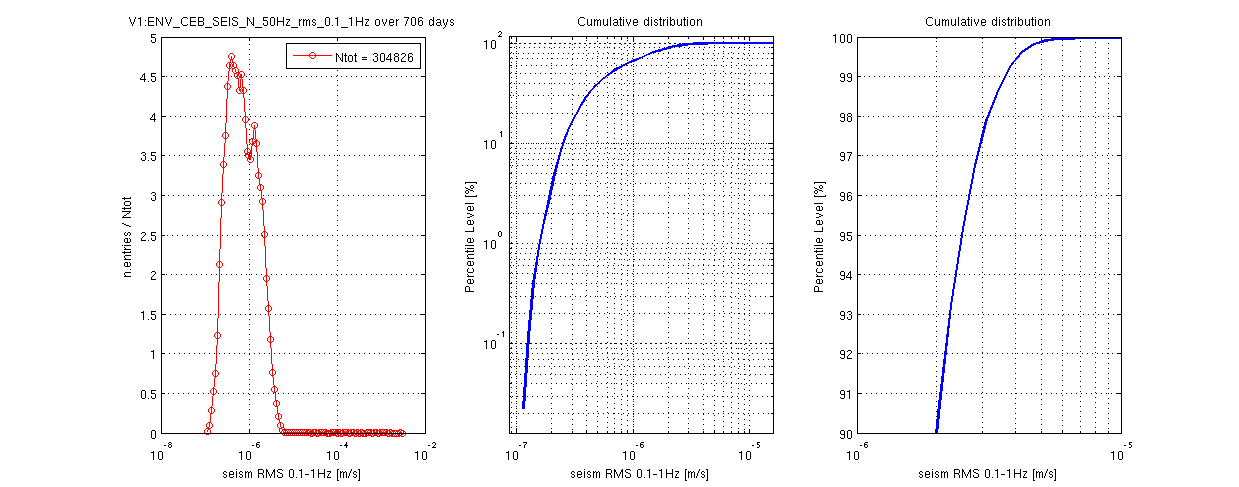
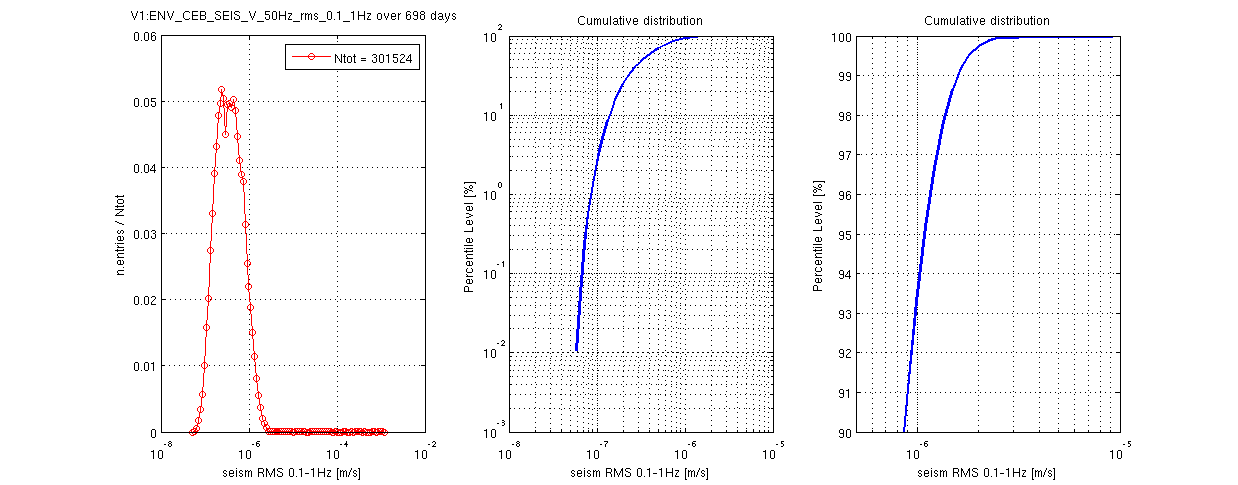
Attached plots show the percentile levels of CEB rms seismic noise velocity in the 0.1 - 1 Hz band monitoring the seismic activity associated to sea motion. The percentiles are computed over about 2 years of data (from Jan 2015 to Feb 2017).
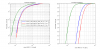
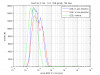
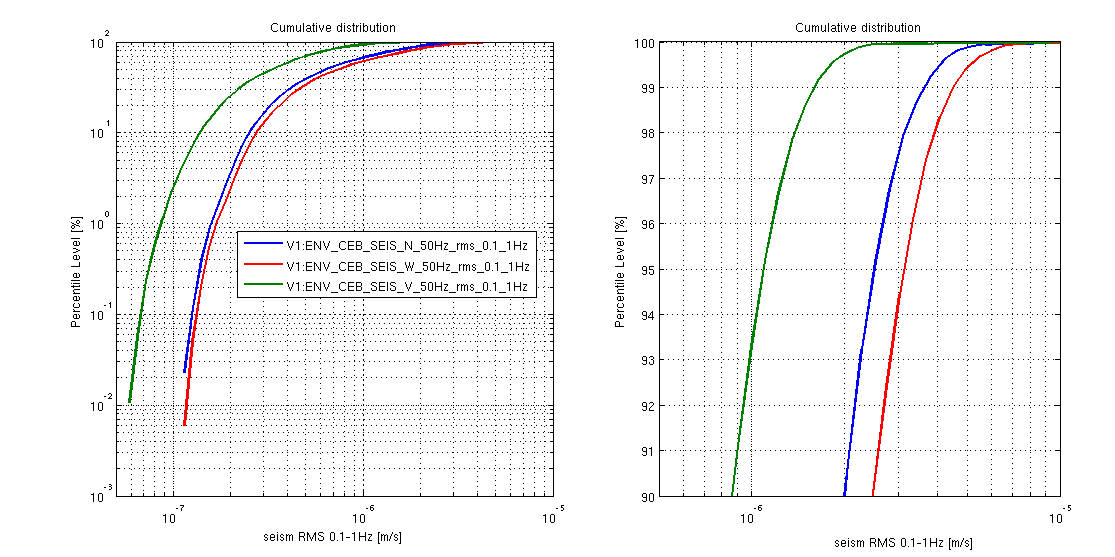
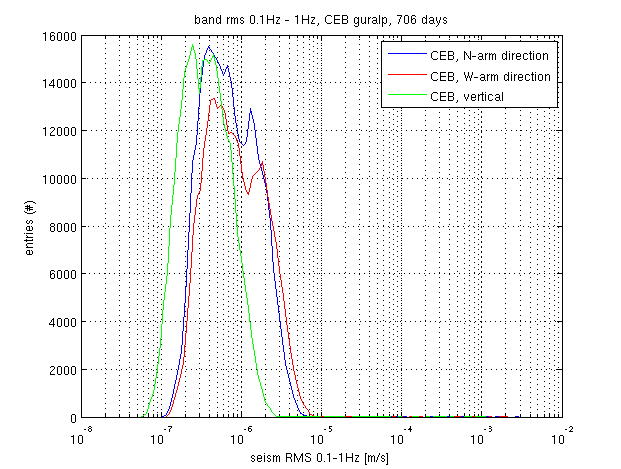
Plot 1 refers to W motion, Plot 2 refers to N motion and Plot 3 refers to Vertical motion. For convenience, Plot 4 compares percentiles of W, N and V motion.
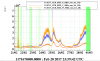
Figure 5 shows the rms noise during the past week. So, looking at Plot 4 we learn that last Friday and Saturday (24th and 25th) we experienced a sea microseism at the 94 PL, while today we are up to 98 PL (!)