Reports 1-1 of 1 Clear search Modify search
AdV-COM (AdV commissioning (1st part) )
Casanueva, Hoak, Allocca - 19:11 Monday 23 May 2016 (33856) Print this report
Calibration factor for Guided Locking

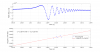
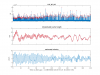
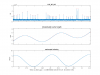
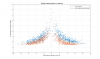
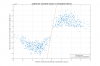
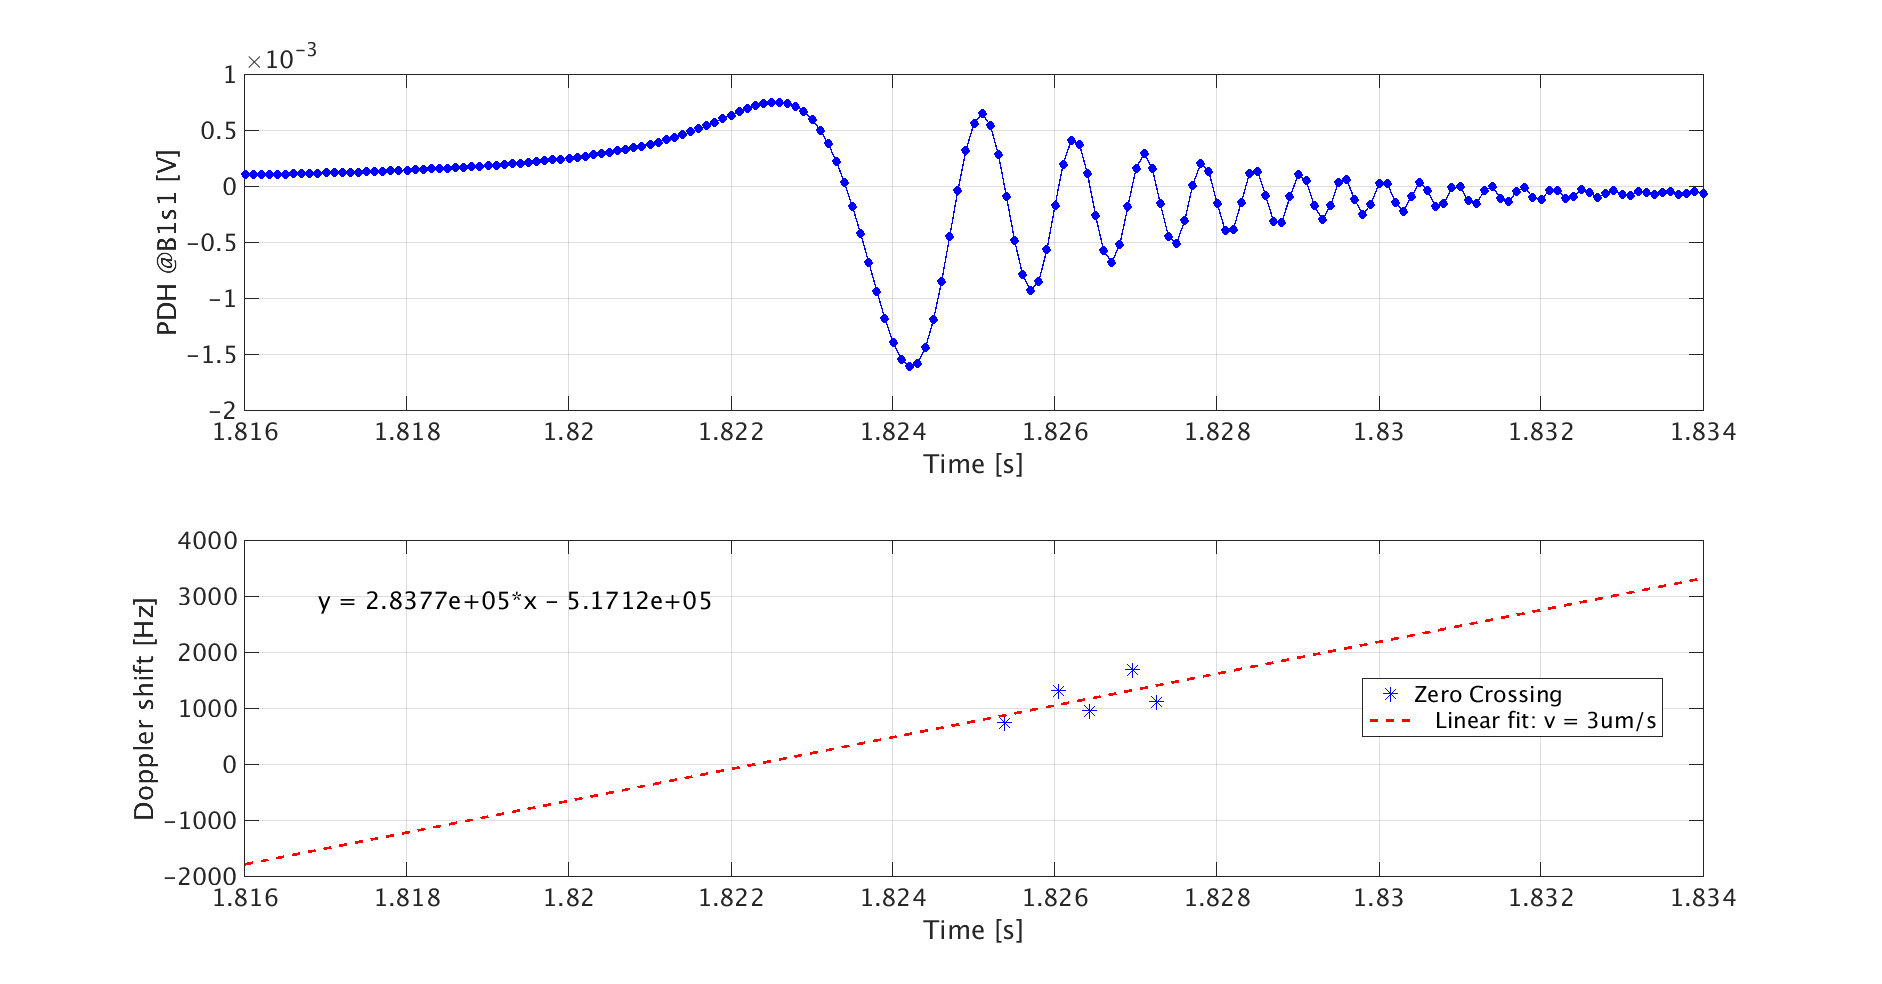
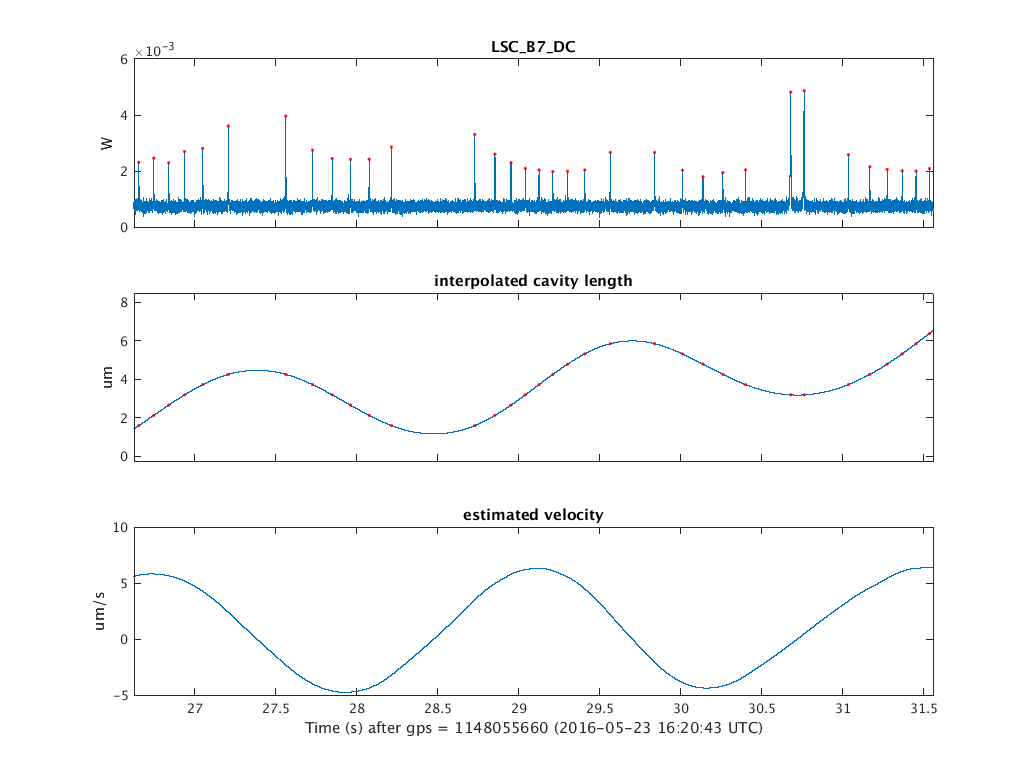
In order to slow down the cavity using Guided Locking, we need to calculate the velocity of the cavity in real time. In order to do that we use the value of the derivative of the normalized error signal (B1s1 / B7_DC) around a cavity resonance.  To calibrate the error signal in meters/Watt, we took a data set of 200s starting from GPS:1148055660 and calculated the real velocity of the cavity following the ringing analysis in entry 33795 using the PDH signal (Rahkmanov PhD thesis pp. 38-39). We obtain the zero crossings of the PDH signal (with ringing), and we calculate the average frequency of the oscillations, plotting it as a function of time. From the slope, we can obtain the velocity. Figure 1 shows an example.

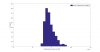
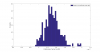
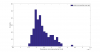
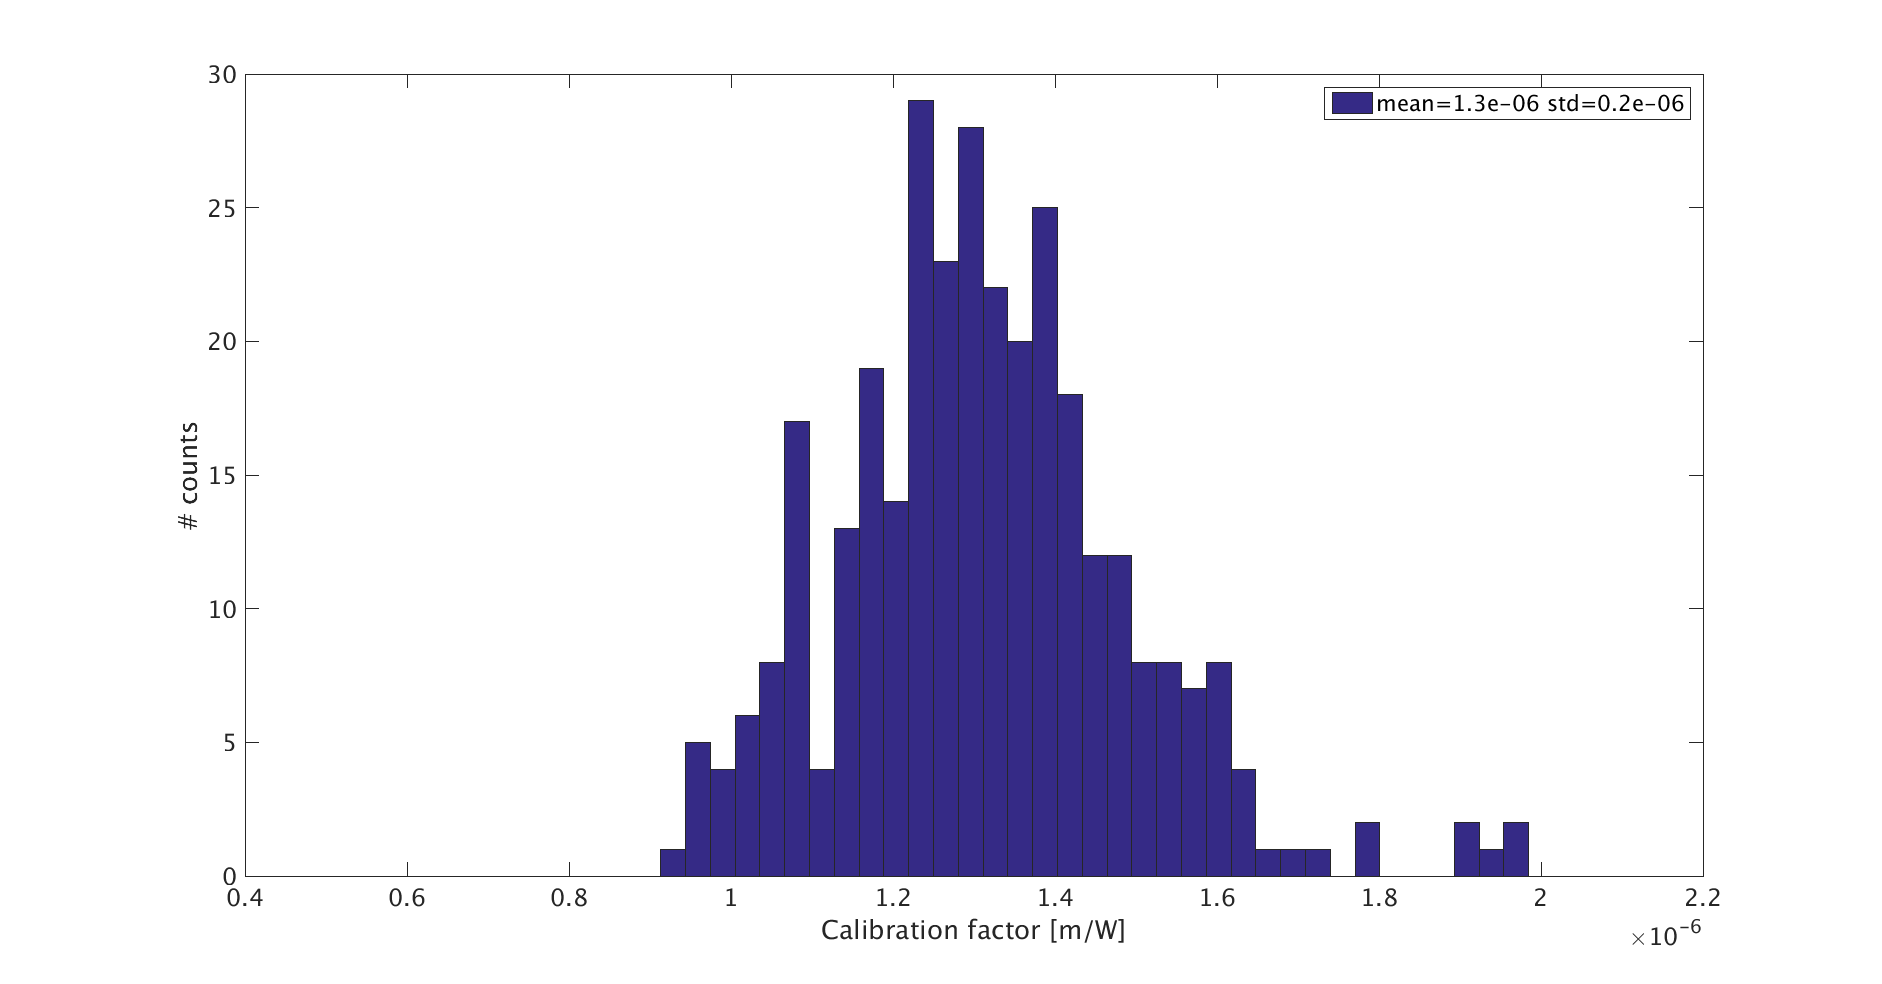
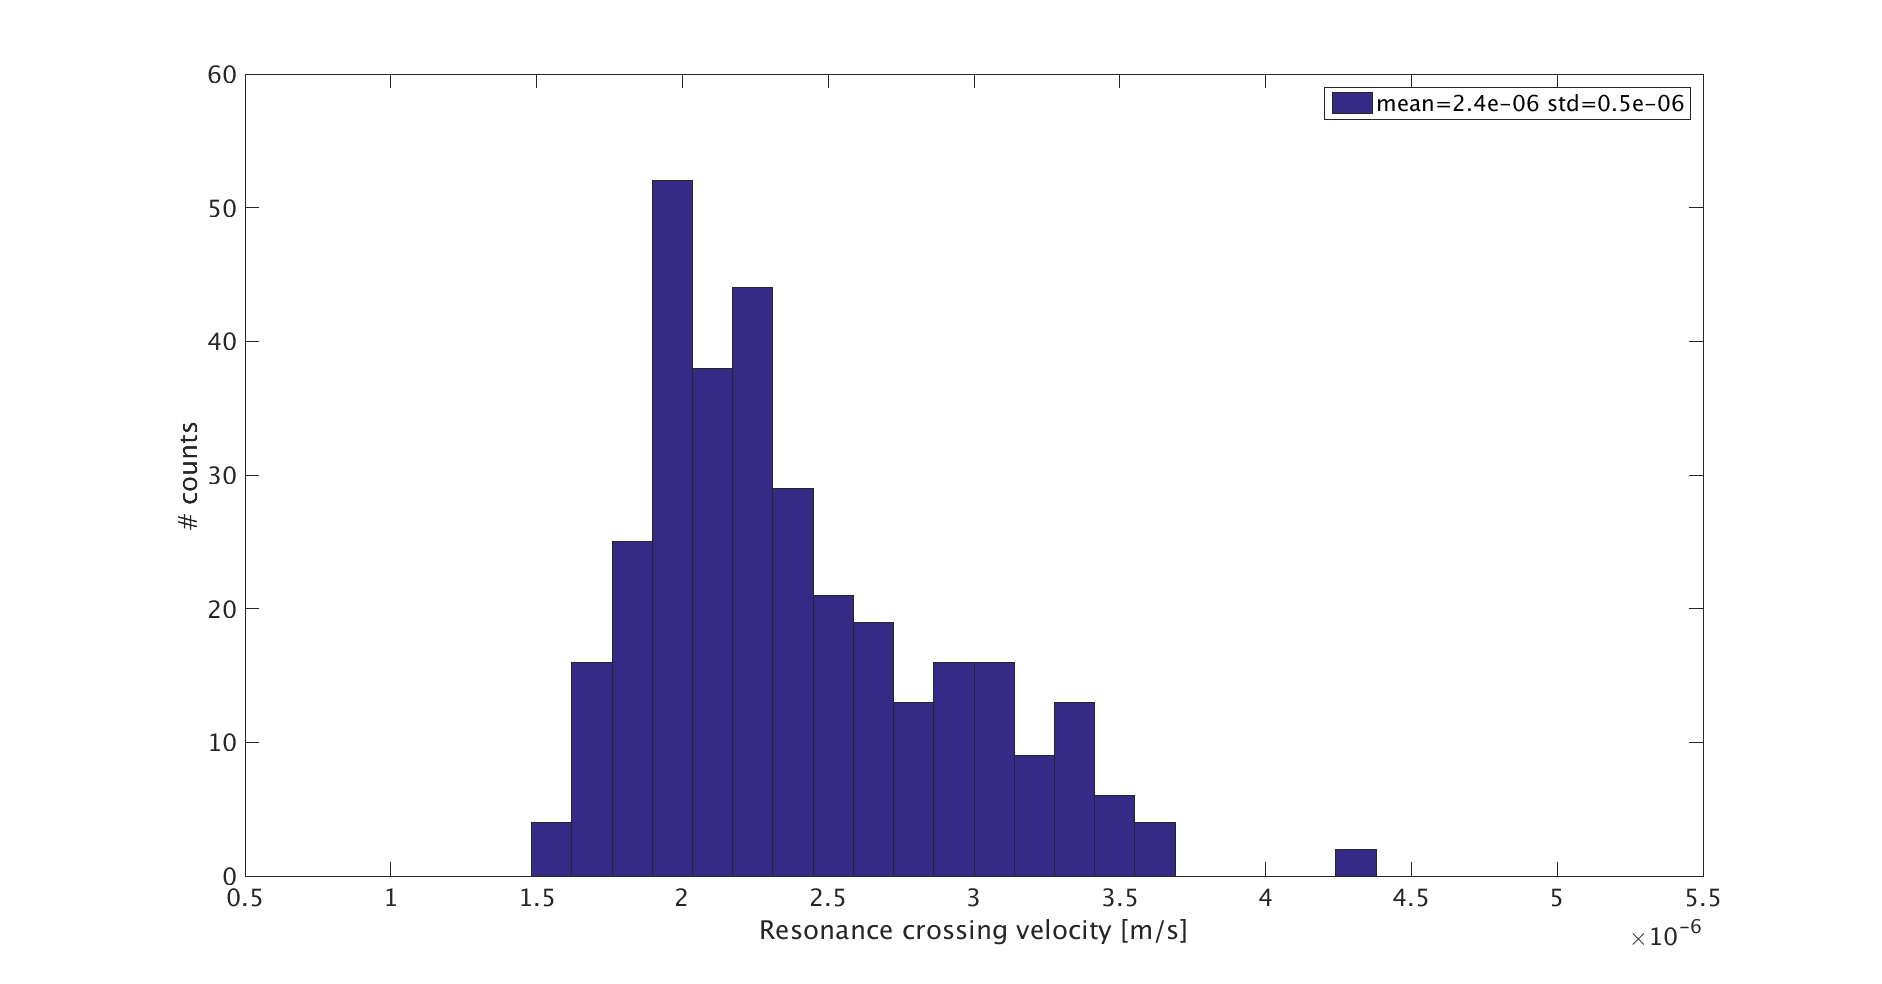
We repeated this process for the whole dataset, and for each peak, we calculated the calibration factor between the real velocity and the derivative channel used for the guided lock algorithm. FIgure 2 shows the histogram of the different analyzed peaks (336). The calibration factor obtained is (4.5+-1.2 (std))e-4 m/W.

Tomorrow morning we will use this calibration in the already-written guided lock script to determine the width of the actuation pulse that will slow the cavity velocity enough to lock.

Images attached to this report
Comments to this report:
swinkels - 10:19 Tuesday 24 May 2016 (33861) Print this report
A more accurate way of calibrating the velocity is fringe interpolation, similar to what was done in the past and more recently for the PR-NI calibration. Attached script shows a quick and dirty way how to do this for yesterday's data. Attached plots show that a mode at 0.4 Hz was excited a bit. This method should allow a proper calibration of the velocity estimate done by the guided lock algorithm, which worked pretty well with Virgo+ measurements and AdV simulations.
Images attached to this comment
Non-image files attached to this comment
casanueva - 10:42 Wednesday 25 May 2016 (33871) Print this report

While trying to lock, we realized that the calibration factor was several orders of magnitude far from what expected. I fixed an error on the code (the velocity calculated for the guided locking was not taken at the resonance) and Figure 1 shows the histogram wit the new calibration factor. Also Figure 2 shows another histogram, this time with the estimated velocities. Comparing the expected velocities with the one calculated by the Guided Locking (with this new calibration factor) we could tune it to a value that allowed us to engage the linear lock (we tuned it conservatively, a factor 5 above).

Images attached to this comment
swinkels - 11:33 Friday 27 May 2016 (33890) Print this report
Some more plots using the same data: Fig 1 shows the transmitted power as a function of the velocity, both at the maximum of the peak and at the moment of a zero crossing of the error signal. A rough calibration of this relation is useful, since the transmitted power is used in the guided lock algorithm to chose between sending a pulse or switching on the linear controller. As expected, the peaks are lower at high velocities, since the cavity does not have time to build up the resonant field. In theory, this plot should show a smooth curve, but the result is pretty noisy. This might be due to alignment fluctuations of the cavity itself or of the suspended benches.

Fig 2 shows the estimated velocity LSC_GL_vel_est (the derivative of the normalized error signal, with some low-pass filtering) sampled at the moment of a zero crossing vs estimated velocity. This should be exactly the signal that is used to estimate the pulse length. Note that estimated velocity as a function of 'true' velocity is a non-linear relation, which can be approximated using a power law (see 2008 GWADW presentation by K. Izumi). This also means that using points obtained at high velocity for the calibration will give an underestimate of the velocity, since the slope is much higher for lower velocities. This interesting part close to the origin is unfortunately missing, since the cavity was moving too fast during the measurement. It would be interesting to acquire similar data (i.e. with no controls applied) when the cavity is moving a bit less.
Images attached to this comment
Search Help
×

Warning

Error

The present report has been modified outside this window. Please check for its integrity in the main page.

Refreshing this page will move this report into drafts.

×