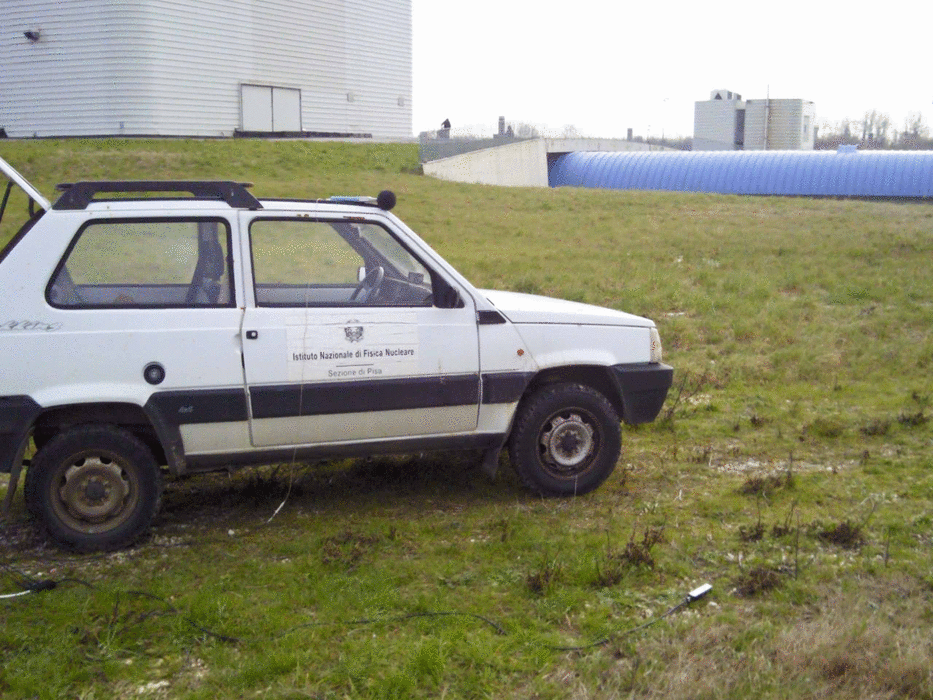
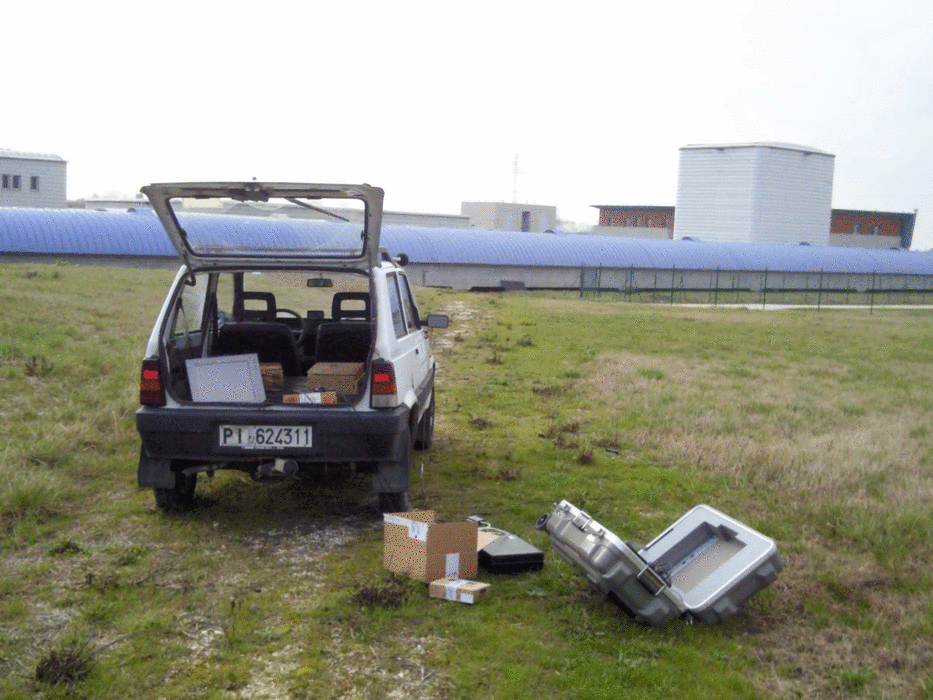
Our fonometer (cel-231, class 2, range 10Hz-25kHz, calibration 3.6 V/Pa, set to "C-low") with wind-screen-on, was laid pointing approx. W, at about 1.5m from soil, the 3-axis magnetometer (DC-2kHz range, calibration 1e4 nT/V) was laid on the ground and oriented along Virgo arms.
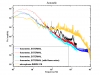
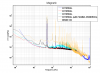
Figure 3 shows acoustic measurements result. We took four measurements with the fonometer: blue and cyan spectra have different resolution; the larger noise below 50Hz in the red spectrum is likely due to a wind gust (according to weather station, wind speed increased to 15 km/h at the time of this measurement; black spectrum is taken while a blowtorch ("fiamma ossidrica") was operated at about 80m distance from us and close to the CB external W wall. The "C-weighting" has been deconvolved from the shown spectra. For comparison, the yellow spectrum is the sound pressure measured inside the CB hall (our channel Em_ACBDCE01), we suspect that the knee at 3kHz is due to some instrumental effect. Our conclusion is that the blue or cyan curves in Fig. 3 represent a realistic measurement of external acoustic noise from about 20Hz up to 10kHz.
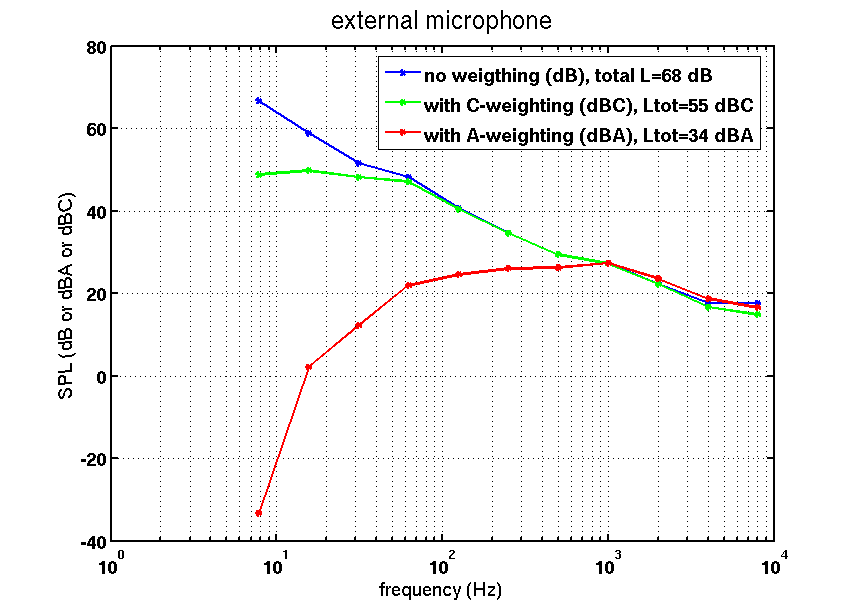
Figure 4 shows the Sound Pressure Levels in octave bands corresponding to the blue curve of Figure 3, in case of: no weighting, "C"-weighting or "A"-weighting. Our measurement gives a total external sound pressure level A-weighted of 34 dBA. This value compares to "class 3" (the "acoustic class" of the EGO site territory) noise limits of "50 dBA during the day (LT 6 to 22)" and "60dBA in the night (LT 22 to 6)".
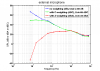
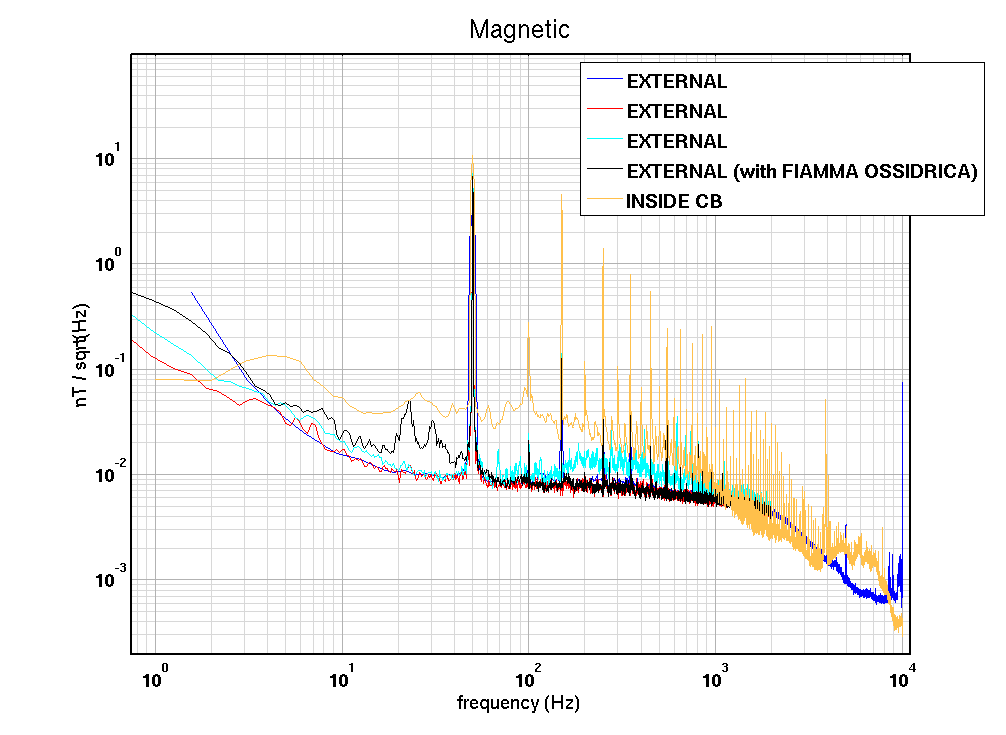
Figure 5 shows the result of magnetic measurements. Colour codes are the same as in Figure 3. Except for 50Hz multiples, the external measurement is limited by the probe intrinsic noise, and all we get is an upper limit. We cannot exclude some magnetic noise is produced by the onosokki spectrum analyzer itself (run under battery power), like for example the extra noise in the black and cyan curves. The 50Hz field is intense also outside, while 50Hz harmonics are significantly less intense.