Procedure:
-take all channels from trend.ffl and throw away some obvious channels (Daq_*, *_max, *_min, all vacuum channels, ...), this leaves about 5800 channels.
-take all NSM_Pr_B1_* channels below 1000 Hz as reference channel (35 channels)
-Throw away bad points (only use data from science mode and use all 40 BRMSMoni flags as veto)
-Compute residuals of fit
-For each band, sort the channels by best fit. The final winner is picked by hand, since there are usually some trivial signals (BRMS of neighbouring band, other RMS monitors) that show a high correlation.
I used 4 days of data from a period during which the horizon showed a strong daily modulation, but during which the ITF was otherwise very stable (no baffle noise or other big problems). Note that in this period the laser was locked to the 'wrong resonance' of the RFC.
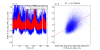
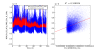
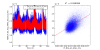
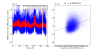
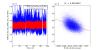
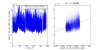
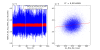
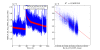
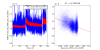
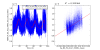
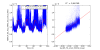
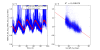
Bands that seem to show relevant correlation (see attached figures):
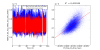
5_8 Hz Pr_B1p_q1_ACqv_rms related to seismic noise
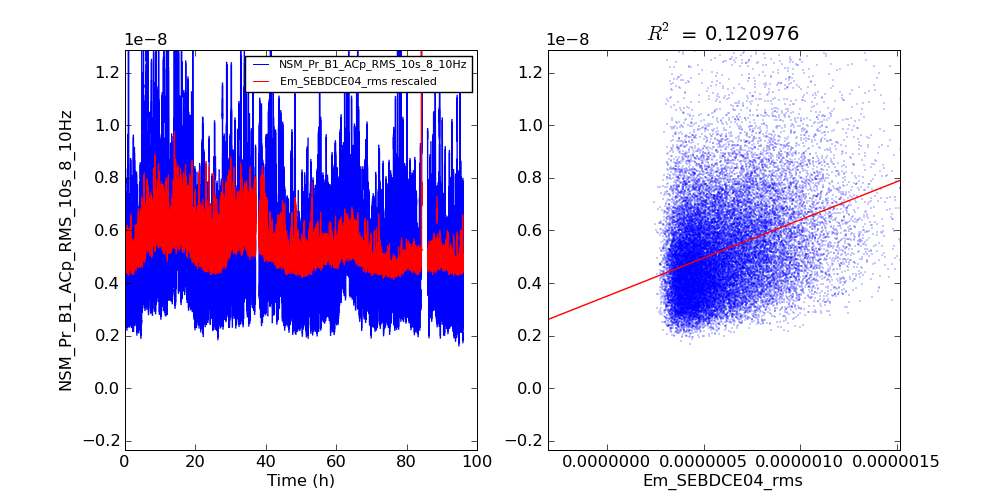
8_10 Hz Em_SEBDCE04_rms seismic noise
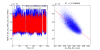
10_12 Hz Pr_B1p_q1_ACqv_rms related to seismic noise
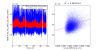
12_13 Hz Sa_BS_F0_vCorr_500Hz_rms related to seismic noise
30_40 Hz Pr_B1_d2_ACq_mean MICH fluctuations?
40_48 Hz Sa_WE_F0_xCorr_500Hz_mean daily temperature fluctuation
48_60 Hz Gx_B1p_Wy_mean scattered light? correlation not very high
60_70 Hz NSM_Em_SE_Cryo02_RMS_55_80Hz bubble noise
70_85 Hz Alp_Lock_SSFS_1111_COHE dihedron resonances?
100_105 Hz Sa_BS_F0_zCorr_500Hz_mean daily temperature fluctuation
105_126 Hz Sa_WE_F0_xCorr_500Hz_mean daily temperature fluctuation
126_145 Hz Gx_WE_ty_mean daily temperature fluctuation
200_260 Hz Pr_B1p_d2_ACp_mean scattered light?
410_440 Hz Gx_B1p_Wx_mean scattered light?
480_500 Hz Gc_Al_DiffEnd_ty_rms scattered light? correlation not very high
Bands from 13 to 30 and 85 to 100 show no clear correlation. Most other bands above 145 Hz show correlation with signals related to optical gain.
The band from 100 to 145 and also the horizon seem driven by a daily temperature fluctuation. It is hard to tell the exact mechanism, since there are many signals that are modulated by this. Signals related to the WE bench misalignment, however, show the best correlation, so this might be an good candidate.
A few bands show correlation with alignment fluctuations in B1p, this might be caused by the known resonances of of optics on the detection bench, which will scatter more when the beam is misaligned.
These analysis should be repeated over longer periods, with possibly a better algorithm. Paolo is also interested in doing similar analysis using BRMS calculated at higher frequencies (up to 10 Hz) to correlate with alignment fluctuations.