The band limited RMS of the dark fringe signal is computed online by NonStatMoni every second, for the following bands
0-10 Hz, 10-30 Hz, 30-50 Hz, 50-100 Hz
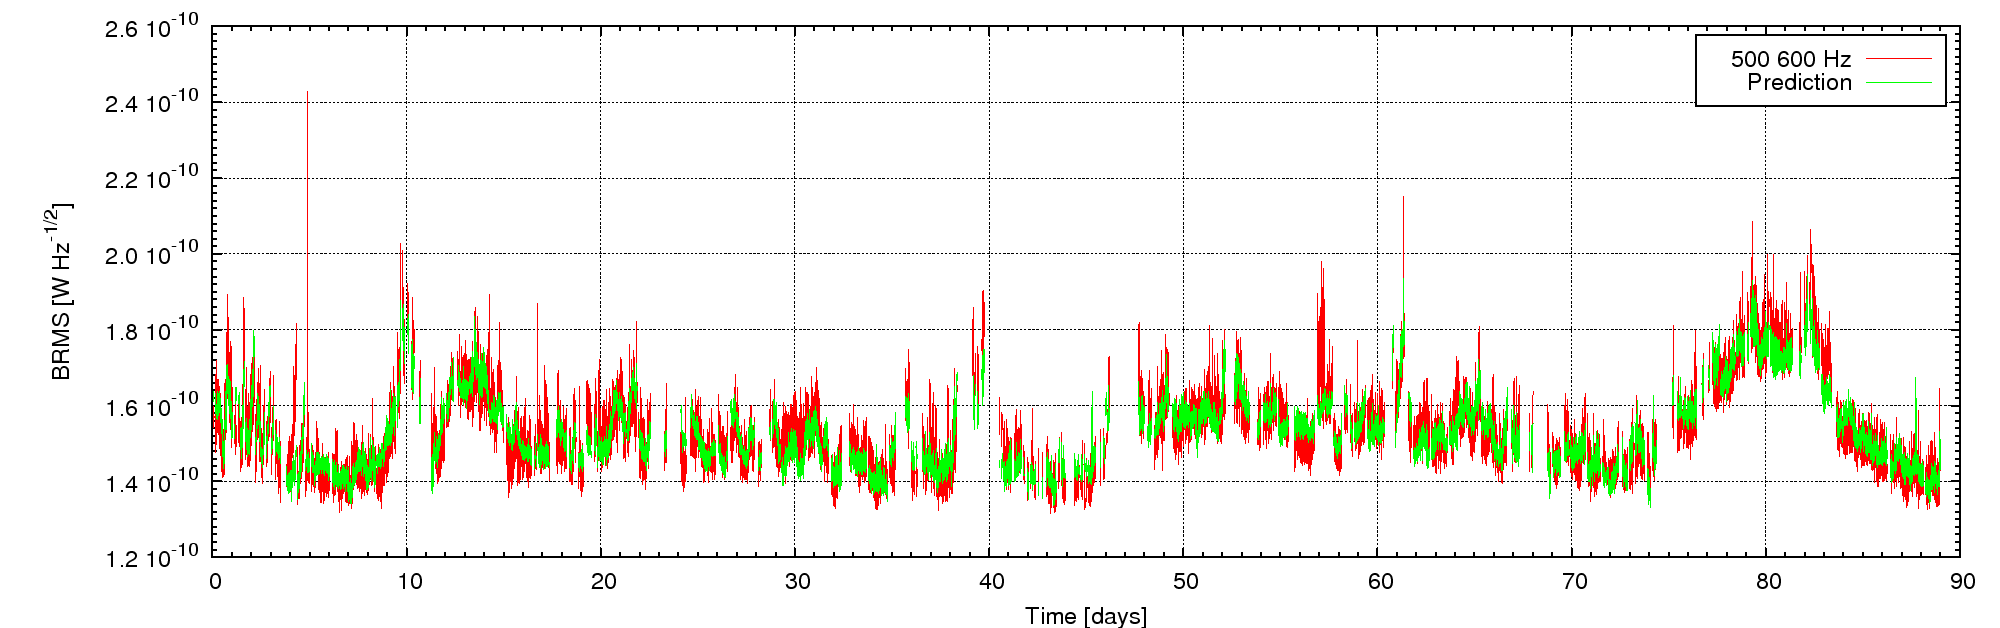
100-200 Hz, ..., 900-1000 Hz
1-2 kHz, ..., 9-10 kHz
I compute the root mean value of the BRMS in these bands over periods of 100s, for all the science mode segments of the run, only removing the first 30 minutes of science mode and the last two.
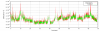
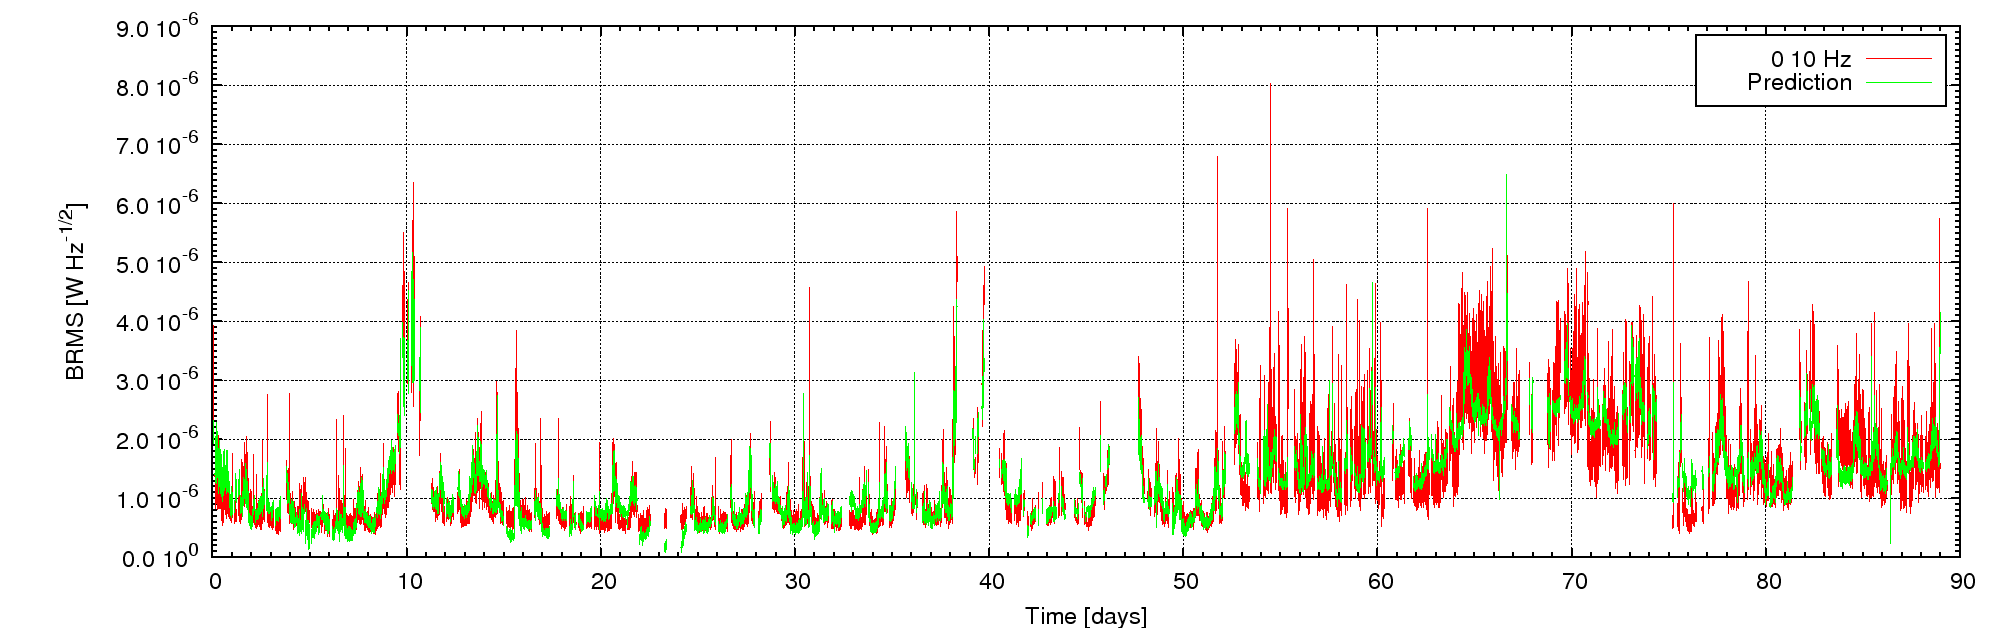
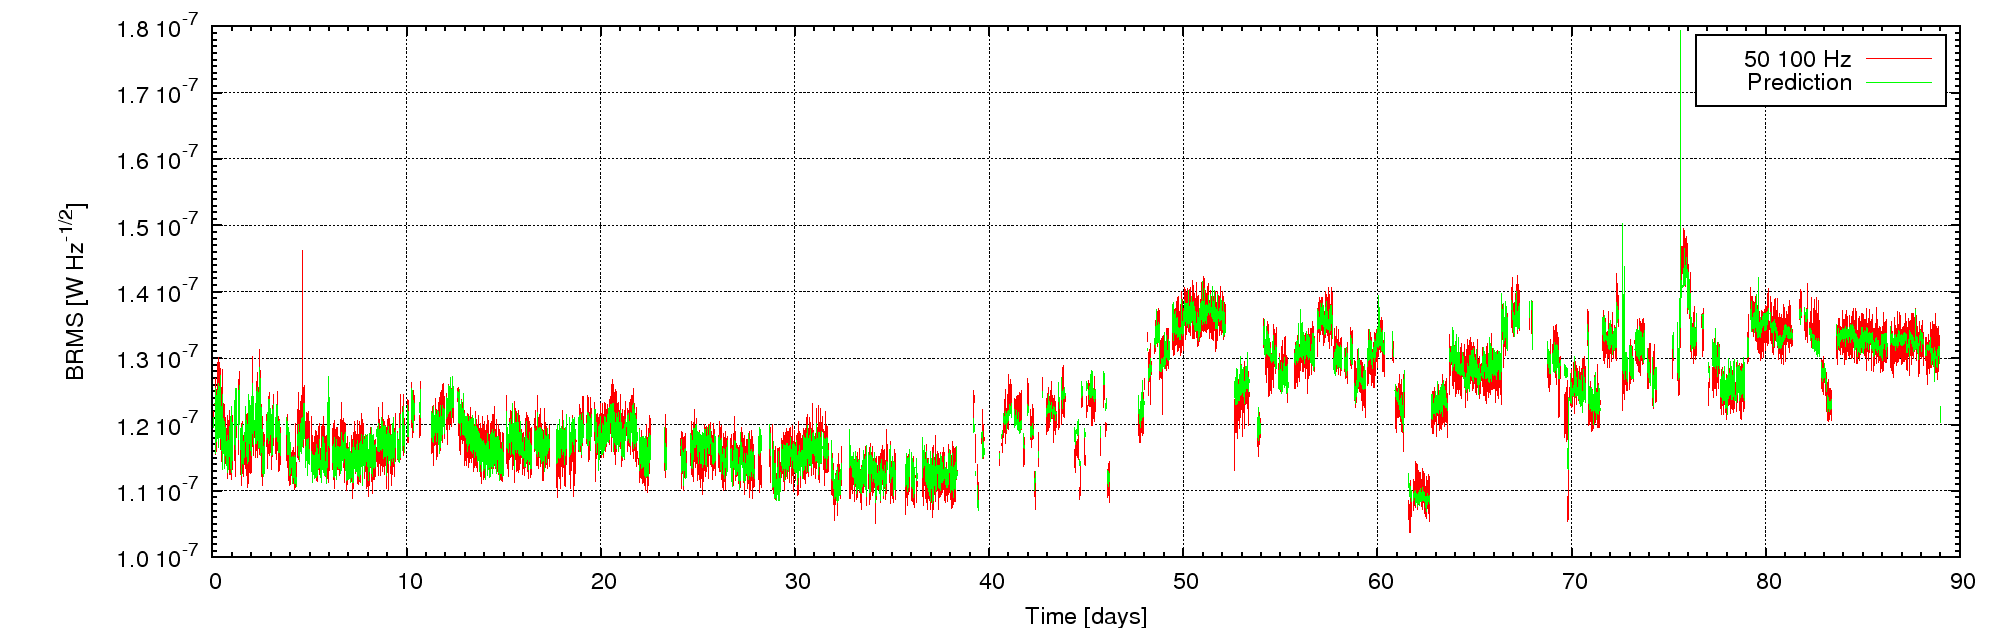
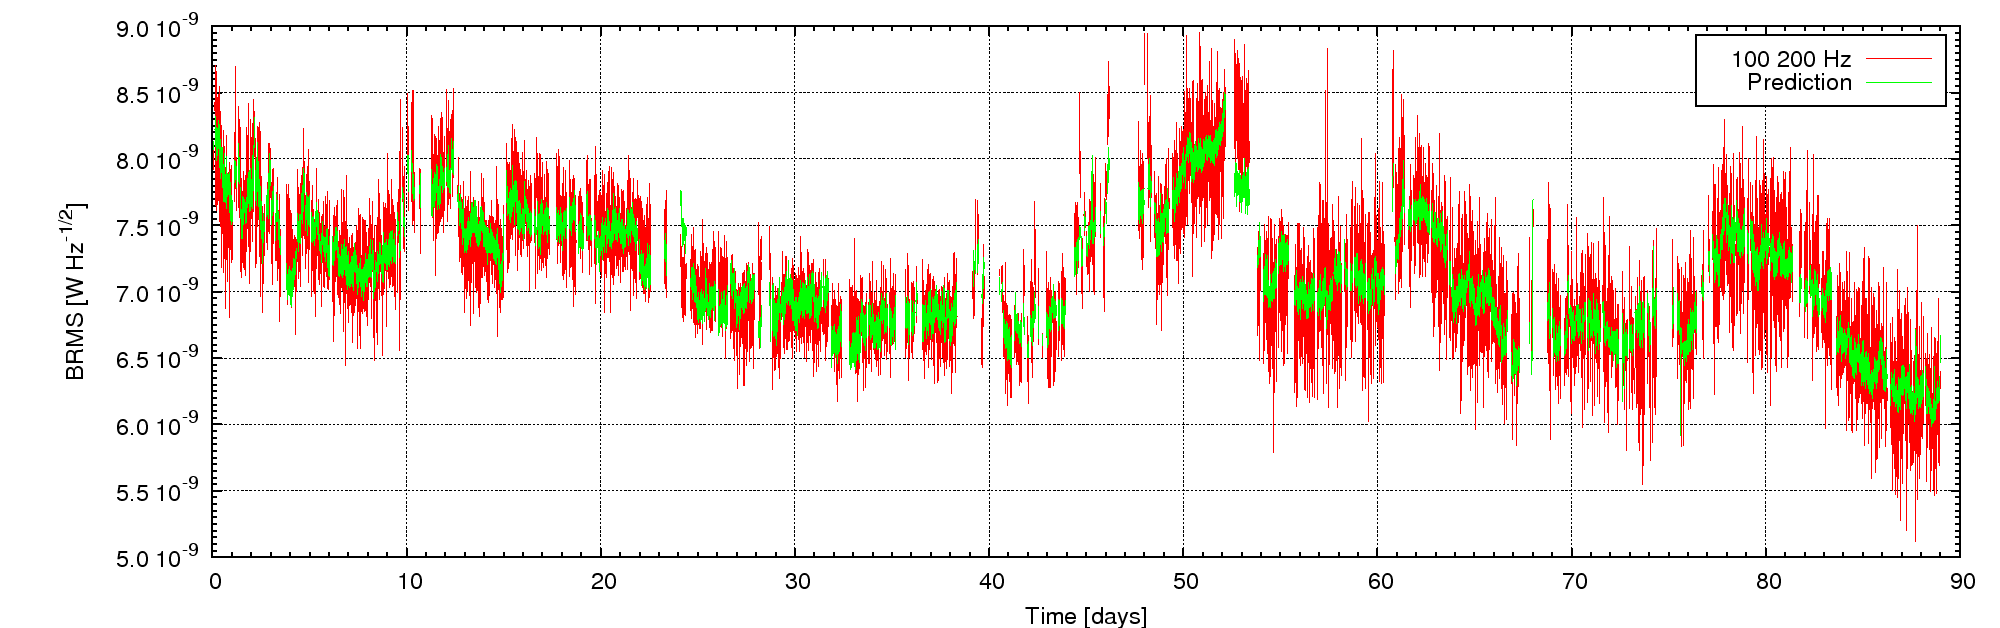
All the BRMS values shows quite large variation over these three months, some with short period and some other very slow.
I performed an analysis, in time domain, to search for correlation of the BRMS variation for each band with other ITF signals. I selected more than 80 channels that could in principle be useful for understanding the dark fringe noise variation:
- locking signals: MICH PRCL DARM gains, sensing cross term, alpha, beta, B2_3f offset
- all the photodiode powers
- IMC_TraDC
- Sidebands and carrier amplitude on B1p
- total RMS of all angular correction (mirror and benches)
- seismic activity in the usual bands
- several temperature inside buildings, ovens and outdoor
- vertical oosition of all mirrors
- centering signals of all quadrants
- output mode cleaner quadrants signals
I used all these channels, measured over the same 100 seconds periods as the BRMS, to perform a "multidimensional linear regression" analysis. This algorithm searches for the linear combination of all the signals that reproduce best the variation of the BRMS. Moreover I post-processed the coefficients so obtained to discard those compatible with zero and to select only those most significant.
This analysis yelds about 30 signals to reproduce the best prediction of the BRMS in a given bans
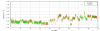
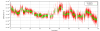
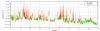
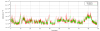
The results are very interesting, since this method was able to reproduce almost all the non-stationarities of the noise. The attached plots shows some example. In red the real BRMS, in green the prediction. The agreement is impressive.
The full results are posted as HTML pages at the address
http://wwwcascina.virgo.infn.it/DataAnalysis/Noise/MultiLinearNonStat
Each page contains the report for a single band. The first plot is of the same kind of those attached to this entry, the second one is a histogram of the residual, namely the difference between the real and predicted value. For an explanation of the third plot and of the table see the next entry...
