Procedure:
-Find 1-sample drop in horizon of 0.2 Mpc in slow data, remove doubles within 10 sec.
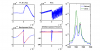
-Get hrec_20kHz data around glitch, band-pass between 100 and 3000 Hz. Find steepest slope to locate glitch, select glitch if slope is larger than 5 times the standard deviation. Interpolate before and after glitch to get step size.
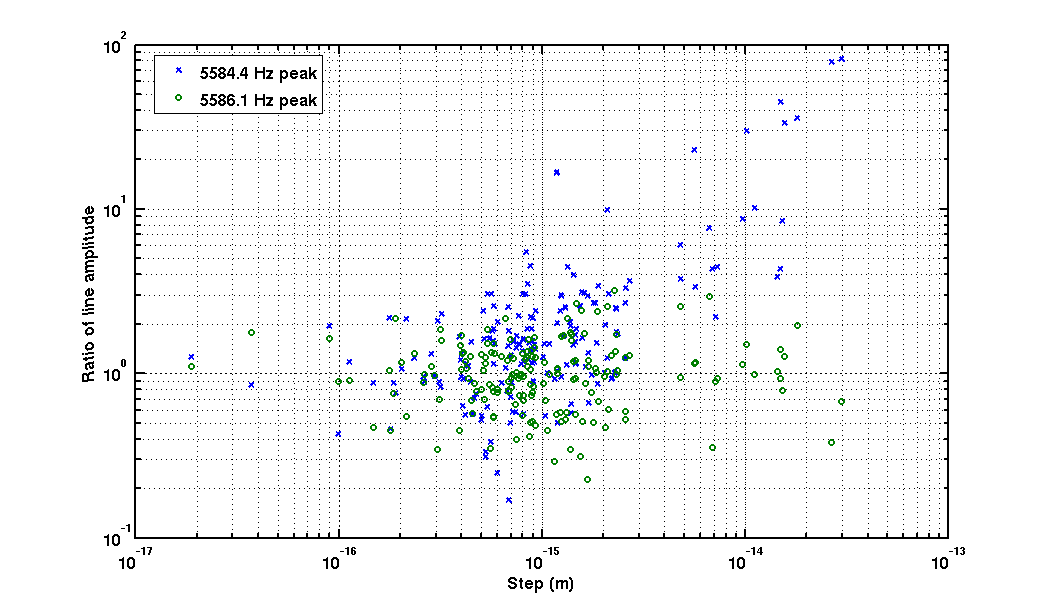
-Calculate spectrum just before and after glitch using 30 sec of data and compute ratio between amplitudes after and before the glitch, for the 5584 Hz (WI drum mode) and 5586 Hz (NI drum mode) peaks. Ratio > 1 means the peak is excited.
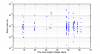
Fig 1: typical large glitch, the WI is clearly excited. Fig 2: typical smaller glitch which looks similar in hrec, but causes no visible excitation of the mirror.
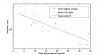
Fig 3: ratios for the WI (blue crosses) and NI (green circles) peaks, plottes vs step amplitude. The glitches with a large step clearly excite the WI. Note that the amplitude ratio seems to vary randomly by a factor of 2 (thermal noise?), so the observed ratio for the NI is more or less consistant with 1. For medium range glitches (step ~1e-15 meter), it is not possible to attribute an individual glitch to the WI. Since the blue cloud clearly has a higher ratio than the green cloud, it is possible to say that a large fraction of these is caused by the WI. Glitches with a smaller step size might be false alarms.
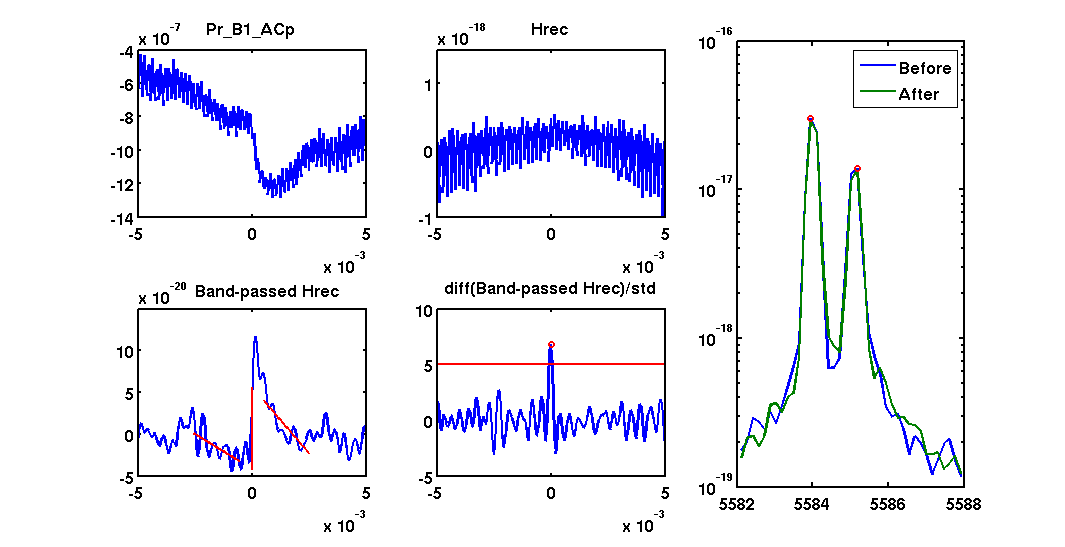
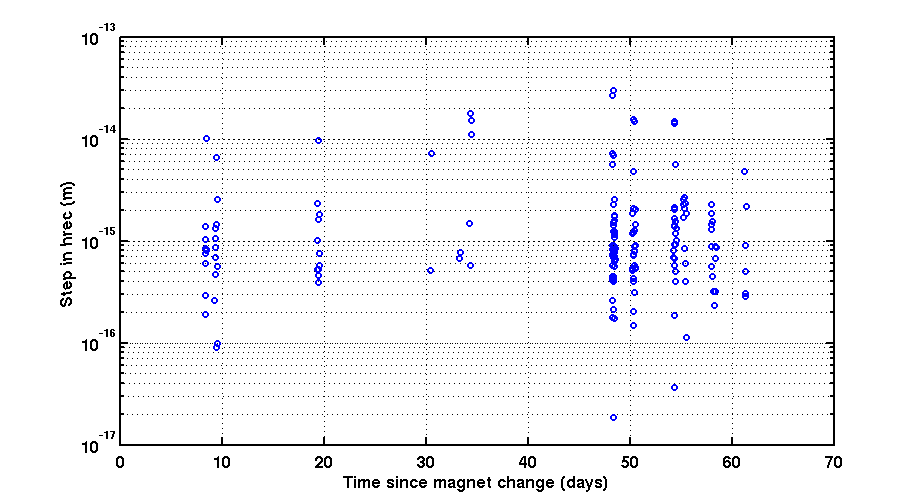
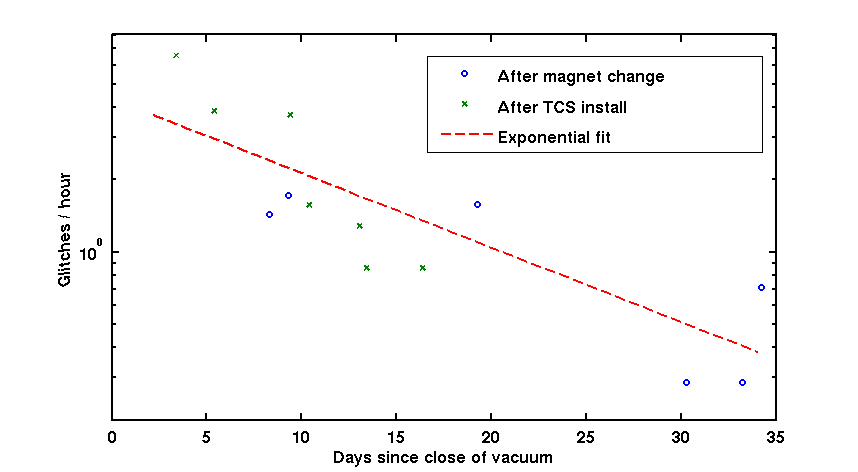
Fig 4: step size as a function of time, the gap around 40 days is the installation of the TCS. Only a change in rate can be observed, not in amplitude. Fig 5: glitch rate as a function of time after closing of the vacuum. An exponential fit gives a rate of 4.3*exp(-t/2 weeks) glitches per hour. Note that this method only finds glitches that are over a certain threshold. We have to hope that as the rate of large glitches decreases, the rate of smaller, uncounted glitches decreases also.
A possible cause for the glitches might be the water-glass glue, since this was used only at the WI.
According to Michele, the large increase in rate after the TCS installation might indicate that the problem is related to water, since people have been working in the tower for a week. It seems plausible that the dehydration of the water-glass periodically causes a change in the structure of the glue, like a mini-earthquake. Assuming a few-gram magnet that pushes a 20 kg mirror, this might be a creep effect with an amplitude of a few atom layers.

