I checked RF PD saturation situation after a lot of sideband power decrease during MICH offset reduction (see logbook #42162 and #42188).
RMS of the photodiode signals seem to be limited by the main sidebands, and most offending sideband is now 6MHz at MICH offset of 0.1 to 0.0.
If we want to have more range in the future with current locking scheme, we might want to notch 6MHz for B1p and B4.
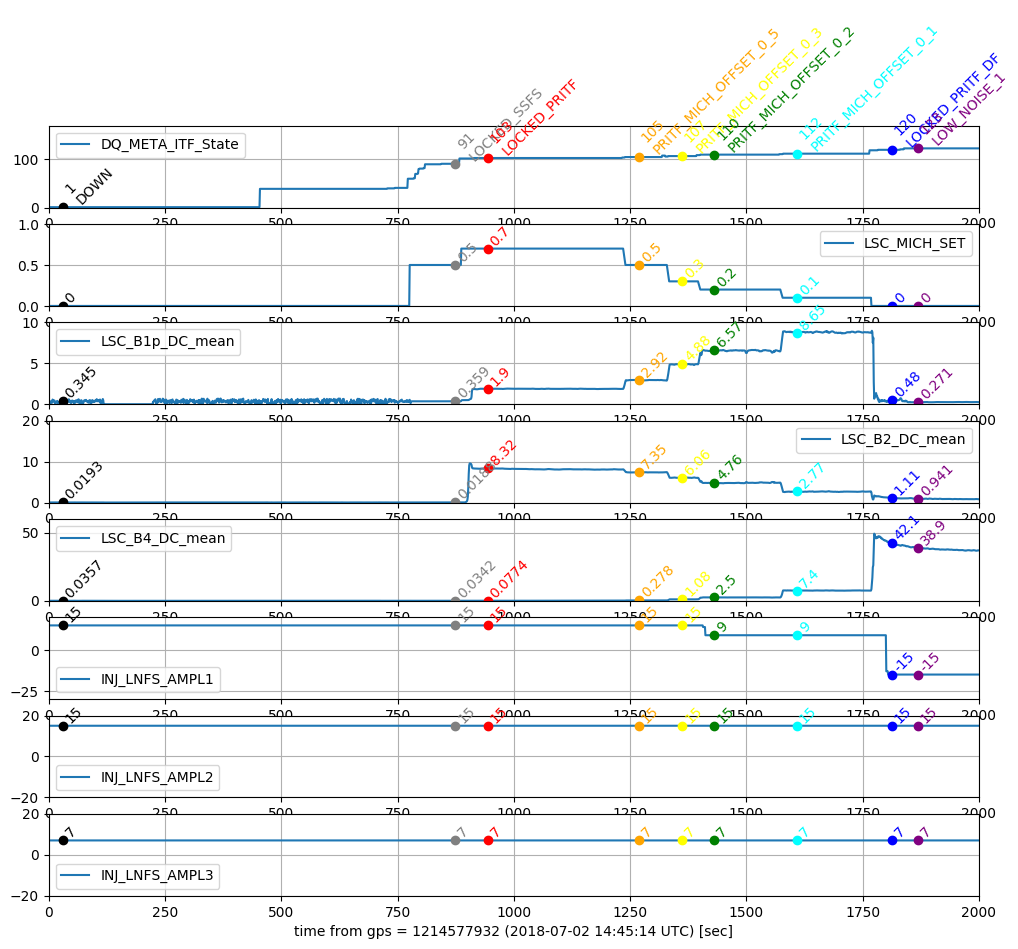
Lock sequence:
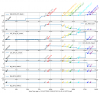
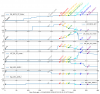
To visualize the lock sequence, I made a time series plot of Metatron states, DC power at B1p/B2/B4 and modulation amplitudes.
DCchannelsTimeseries1214577932.png is the plot on July 2 (after nominal 56MHz modulation depth reduction from 12dBm to 7dBm).
6MHz starts with 15dBm, but reduced to 9dBm during MICH offset reduction from 0.3 to 0.2. It is further reduced to -15dBm in DF.
8MHz and 56MHz are kept at 15dBm and 7dBm respectively during the whole lock acquisition.
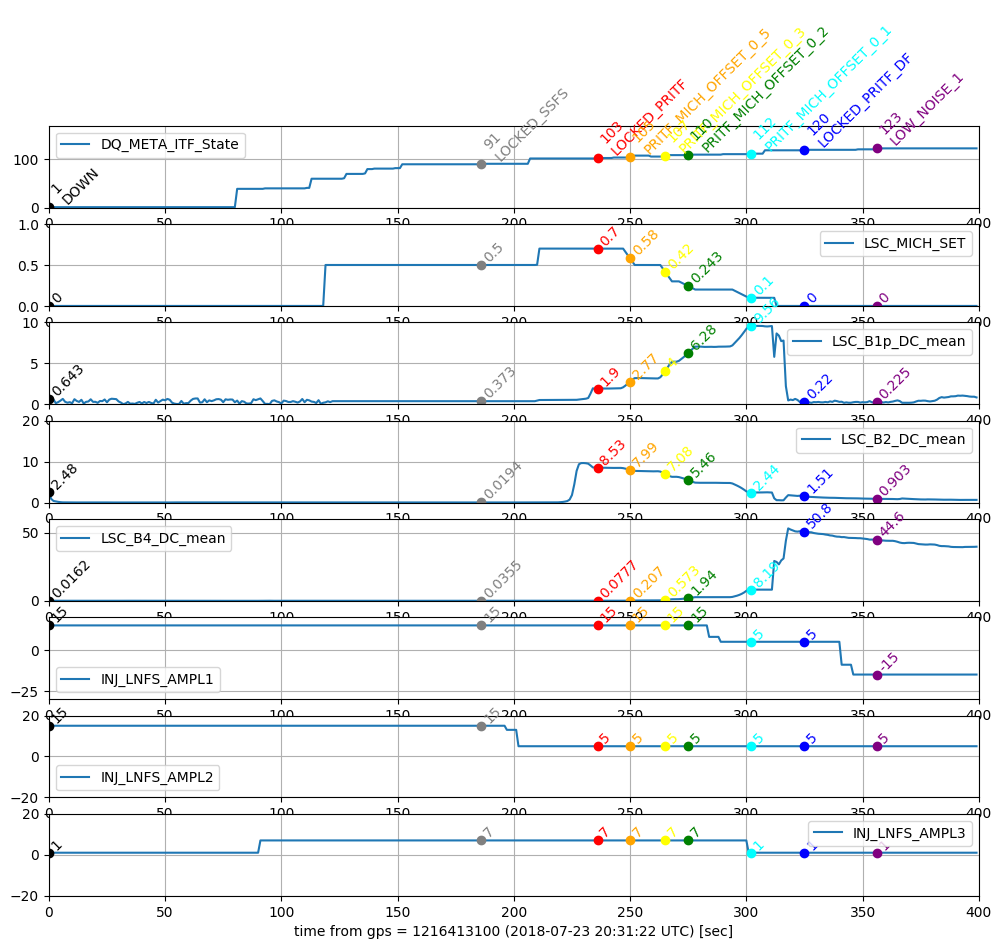
DCchannelsTimeseries1216413100.png is the plot on July 23, when we reached Low Noise 3 (see #42188).
6MHz is reduced from 15dBm to 5dBm during MICH offset reduction from 0.2 to 0.1. And then it is further reduced to -15dBm in DF.
8MHz is reduced from 15dBm to 5dBm during transition from LOCKED_SSFS to LOCKED_PRITF.
56MHz is reduced from 7dBm to 1dBm during MICH offset reduction from 0.2 to 0.1.
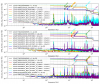
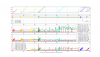
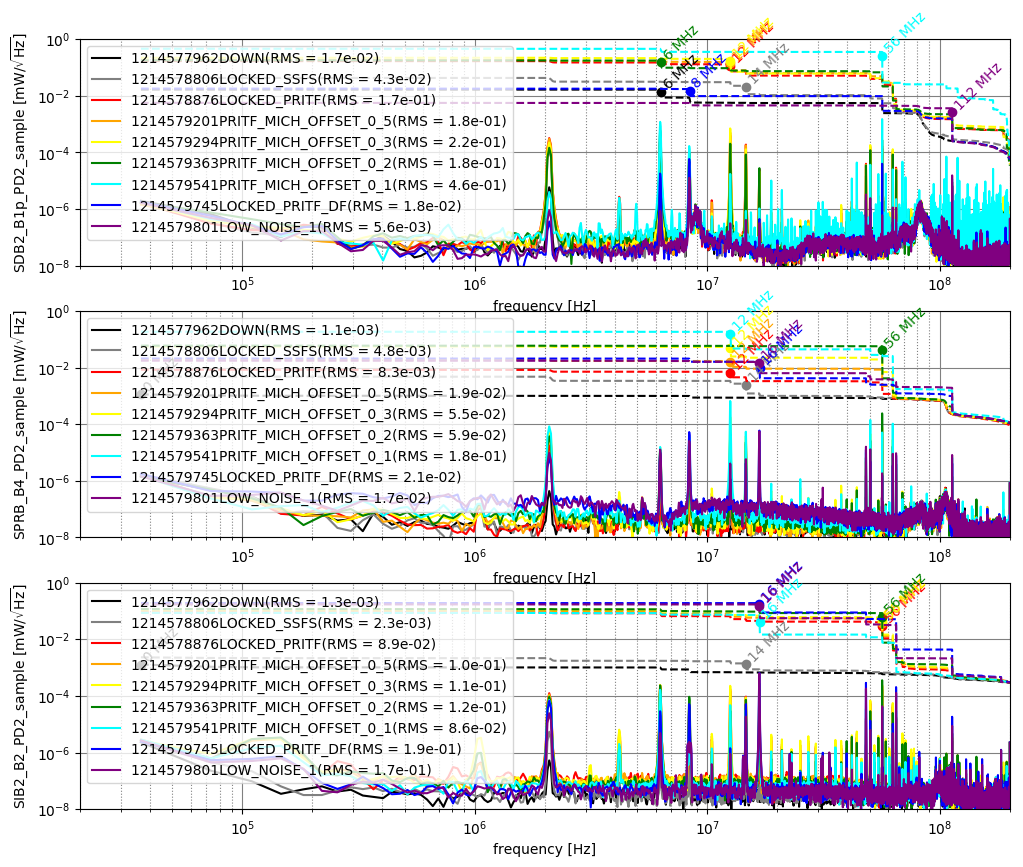
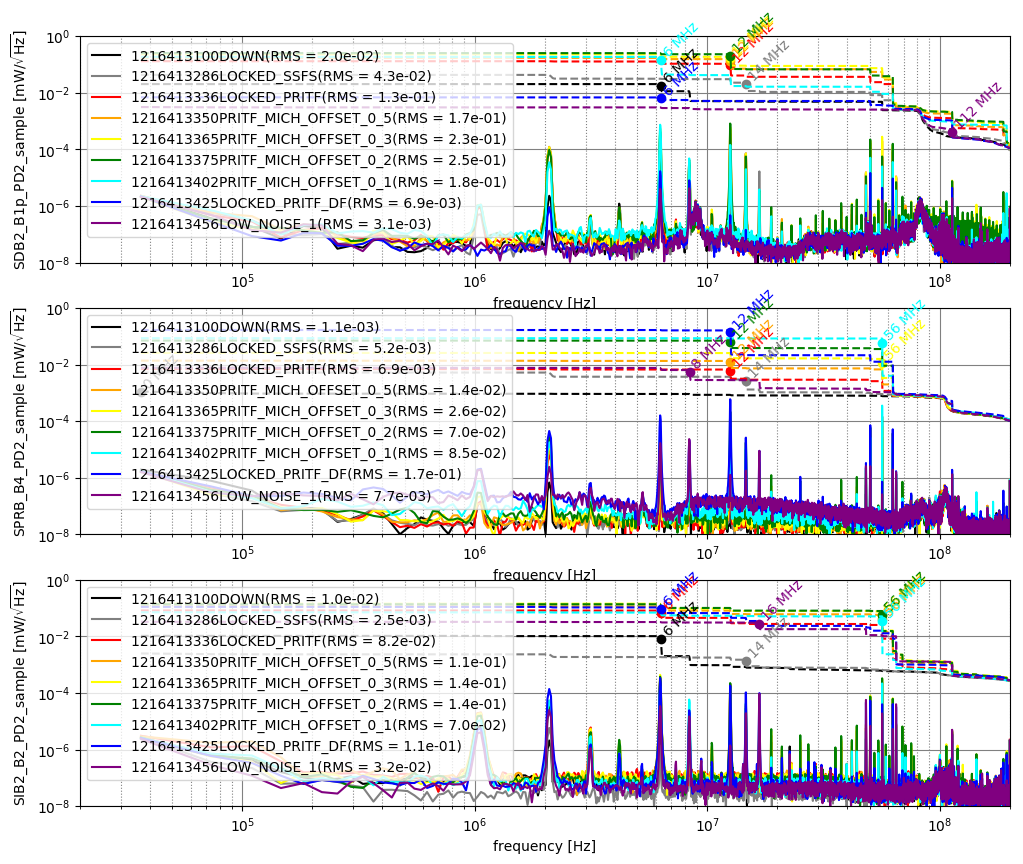
RF PD spectra with RMS:
RFchannelsSpectra1214577932.png is the spectra from July 2 and RFchannelsSpectra1216413100.png is the spectra from July 23.
Dashed line shows the RMS and dots show the most RMS-contributing frequency.
You can see the RMS reduction and saturation reduction especially at MICH offset of 0.1.
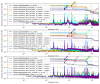
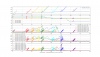
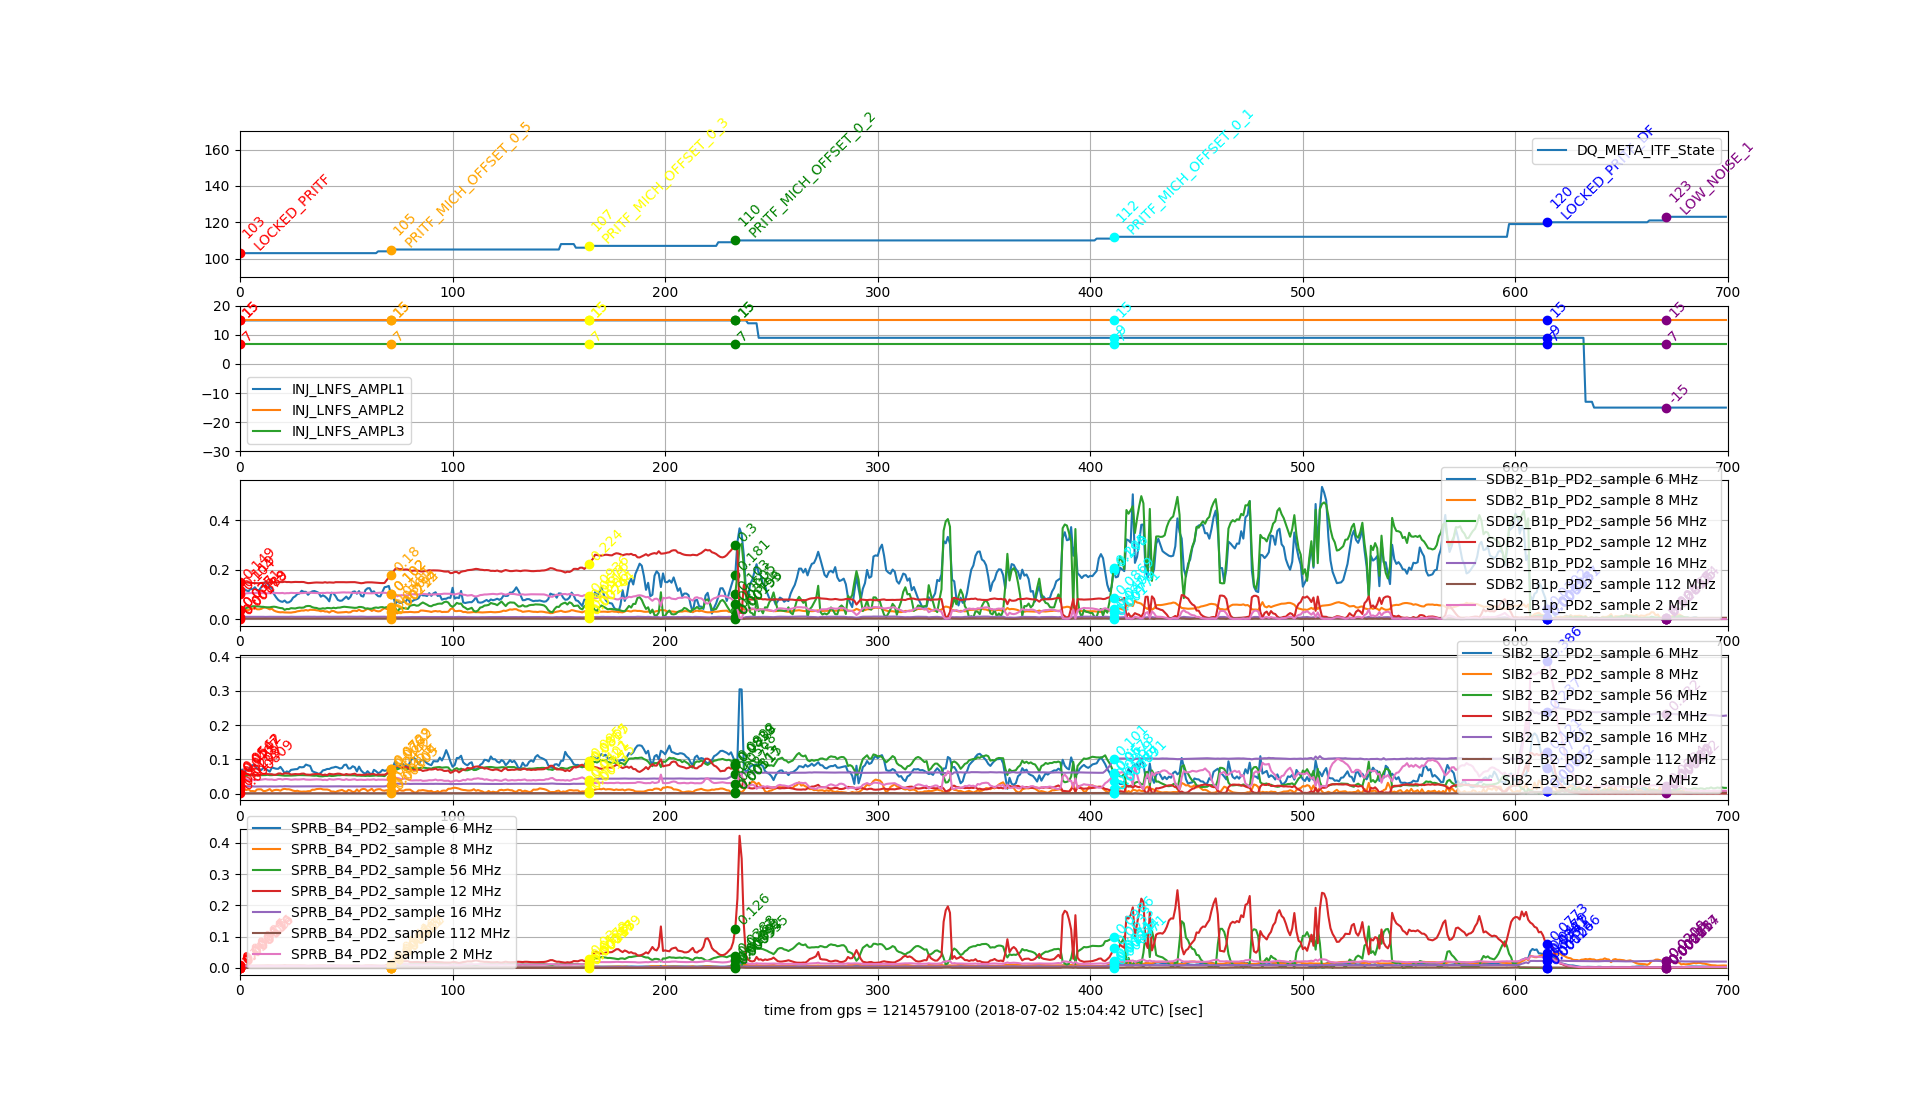
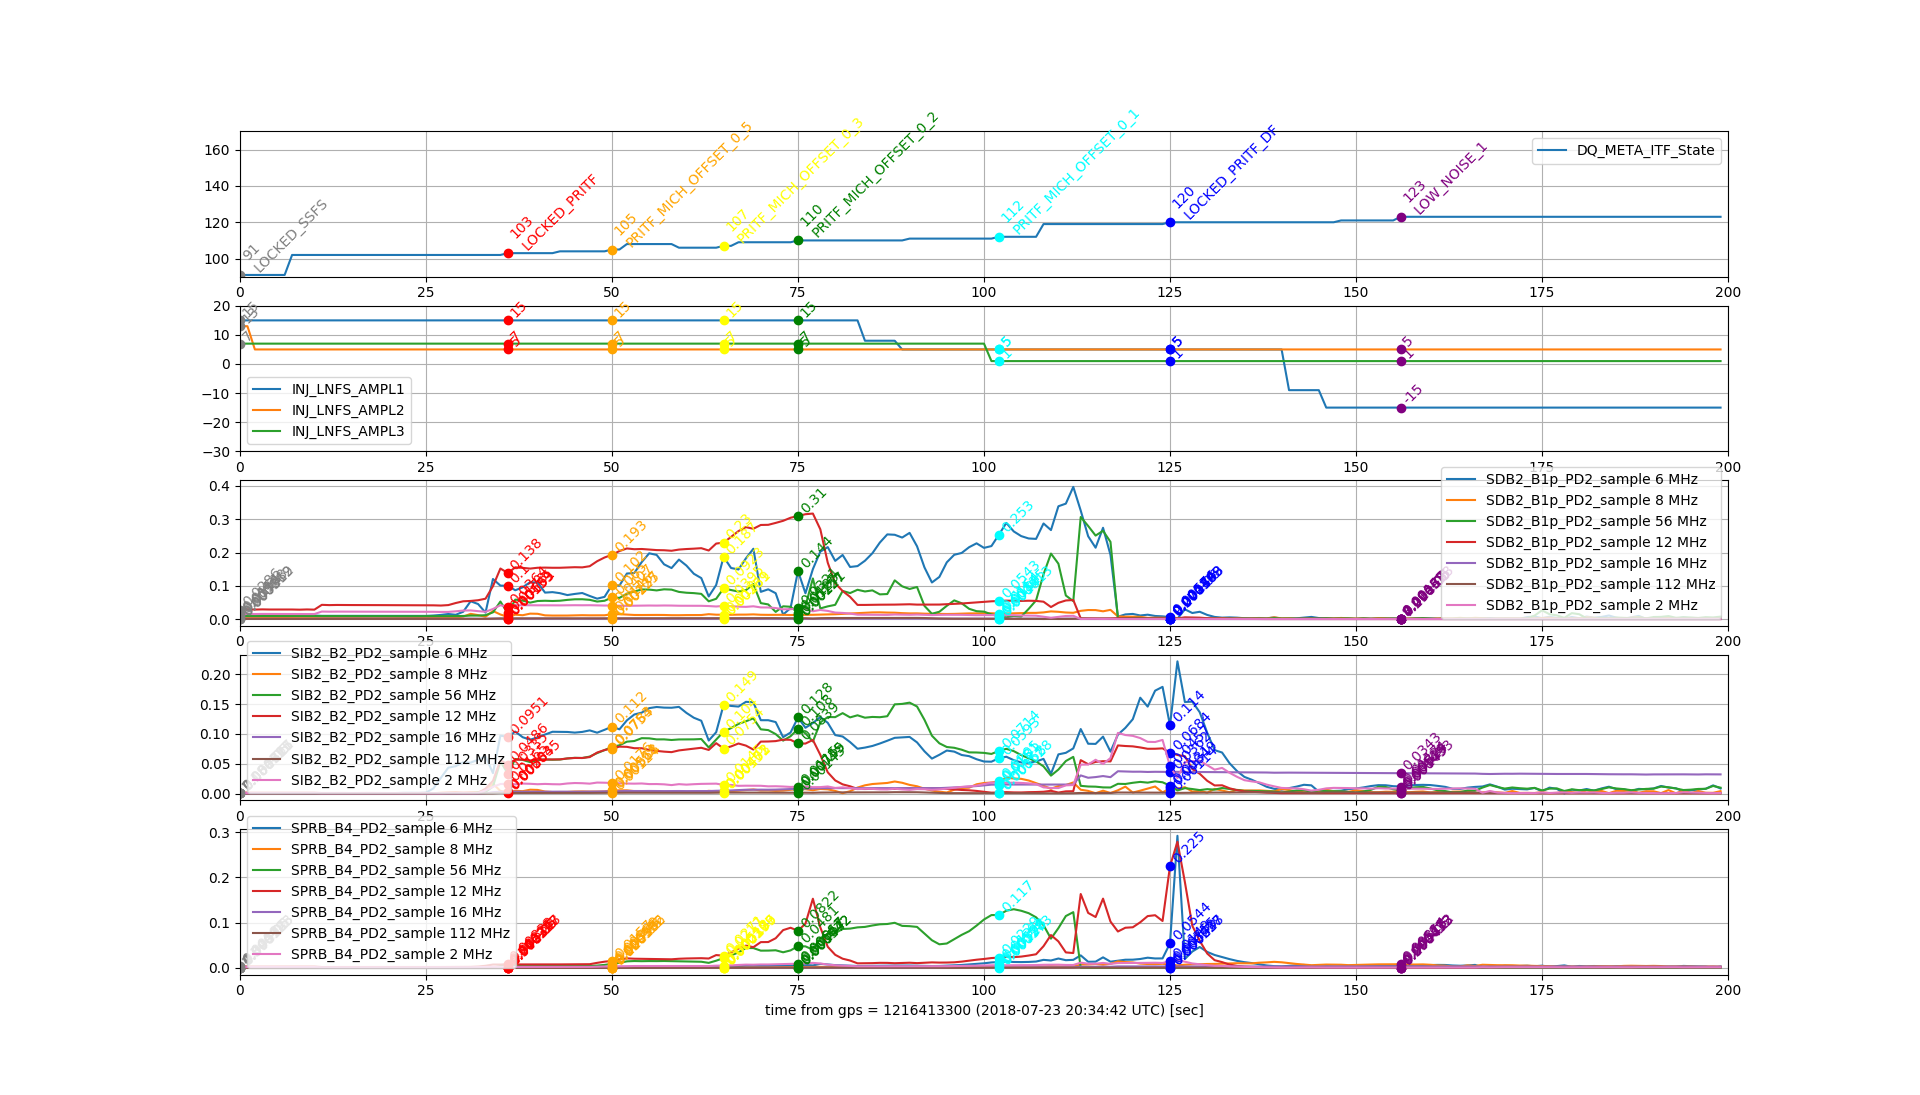
Demodulated signals of RF PDs:
I also plotted the time series data of demodulated amplitudes at 6MHz, 8MHz, 56MHz, 12MHz, 16MHz, 112MHz, and 2MHz of B1p/B2/B4 400MHz raw signals.
DemodulationTimeseries1214579100.png is that for July 2 and DemodulationTimeseries1216413300.png is that for July 23.
From July 2, you can see that 6MHz and 56MHz were high (and oscillating!) at B1p at MICH offset of 0.1. 16MHz and 2MHz were also killing B2 from MICH offset reduction to DF.
On July 23, the situation is much better. You can see that modulation depth reduction is effectively reducing amplitudes of one of the highest sidebands (note that INJ_LNFS_AMPL# has some delay and actual sideband power reduction happens O(10) sec before).
You can also see that the sideband which has largest amplitude during the lock sequence is 6MHz.