After input power increase to 25W, PDs seems to be saturated.
I checked what sideband powers are high at B1p, B2, and B4 photodiodes at different MICH offsets.
Summary:
- Sideband behaviour at B2 looks reproducable.
- Sideband power at B1p and B4 fluctuates between locks, especially when MICH offset is 0.2 to 0.0. Maybe this is from different alignment conditions, which result in the different sideband power build-up for different modulation frequencies (see, also lobgook #42011 (6MHz decay) and #41817 (56MHz decay)).
- B4_DC decays at dark fringe quite rapidly (see also logbook #42058).
Possible solution:
If my understanding of the lock sequence is correct......
- For B1p, we can notch 12MHz and 2MHz since we are not using these at B1p.
- For B4, it's hard to notch because we are using 12MHz (for sideband power monitor), 56MHz (for SSFS). We can notch 2MHz. We can also try reducing modulation depth of 6MHz and 56MHz.
- For B2, we can notch 16MHz. We can also try reducing modulation depth of 8MHz and 56MHz.
Detailed results:
DC power and RF power at different MICH offsets for 3 lock sequences with different conditions are listed below.
For each lock sequence, DC power evolution and modulation depth change with MICH offset change, and spectra of RF PD signals are attached.
In the spectra, color corresponds MICH offsets as;
- 0.7: red
- 0.5: yellow
- 0.3: green
- 0.2: cyan
- 0.1: blue
- 0.0: magenta
- no light: black (taken this morning)
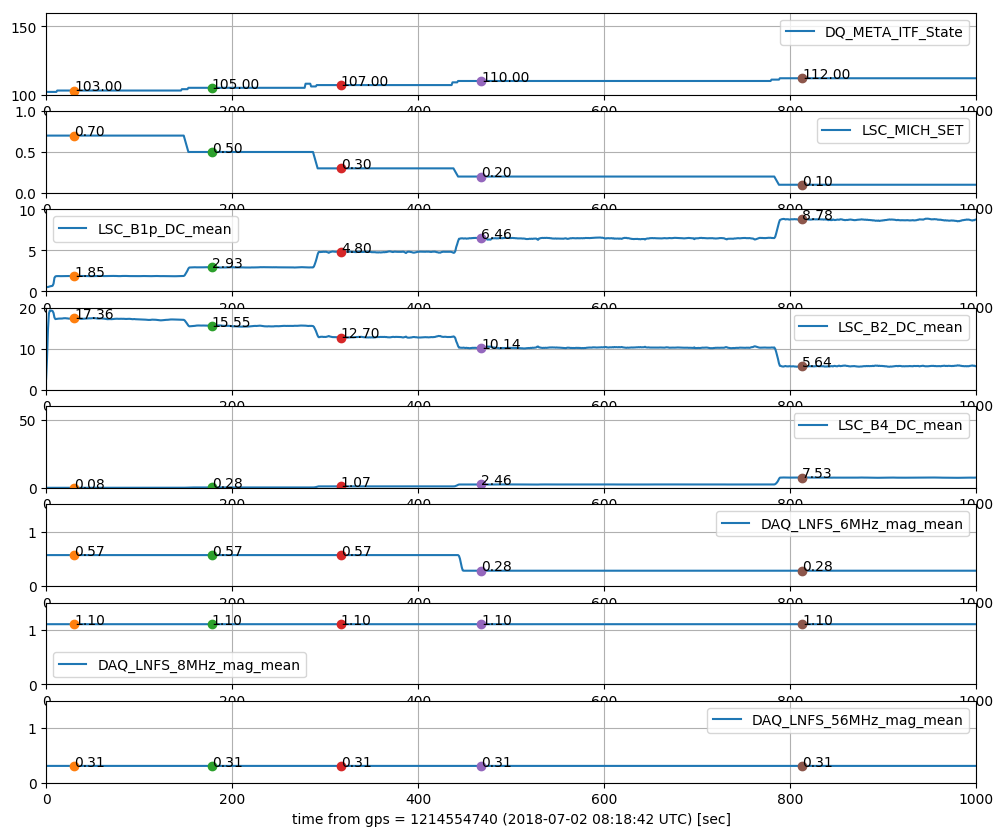
From gps = 1214554740 (2018-07-02 08:18:42 UTC) Figure of DC signals, Figure of RF PD spectra
(original 25 W, did not reached DF)
DQ_META_ITF_State 103. 105. 107. 110. 112.
LSC_MICH_SET 0.70 0.50 0.30 0.20 0.10
LSC_B1p_DC_mean 1.85 2.93 4.80 6.46 8.78
LSC_B2_DC_mean 17.36 15.55 12.70 10.14 5.64
LSC_B4_DC_mean 0.08 0.28 1.07 2.46 7.53
DAQ_LNFS_6MHz_mag_mean 0.57 0.57 0.57 0.28 0.28 (reduced towards dark fringe)
DAQ_LNFS_8MHz_mag_mean 1.10 1.10 1.10 1.10 1.10
DAQ_LNFS_56MHz_mag_mean 0.31 0.31 0.31 0.31 0.31
B1p_PD2 highest freq 2MHz 12MHz 12MHz 6MHz 6MHz
B1p_PD2 highest mag 3e-4 9e-4 1e-3 1e-3 2e-3 [mW/rtHz]
B1p_PD2 2nd high freq 12MHz 6MHz 6MHz 12MHz 56MHz
B1p_PD2 2nd high mag 2e-4 6e-4 9e-4 4e-4 1e-3 [mW/rtHz]
B1p_PD2 3rd high freq 14MHz 2MHz 2MHz 2MHz 12MHz
B1p_PD2 3rd high mag 2e-4 5e-4 5e-4 2e-4 4e-4 [mW/rtHz]
(mostly same as MICH offset reduction starting from gps = 1214556256 below, but different at 0.2-0.1 offset)
B4_PD2 highest freq 2MHz 12MHz 12MHz 56MHz 56MHz
B4_PD2 highest mag 1e-5 9e-5 2e-4 4e-4 5e-4 [mW/rtHz]
B4_PD2 2nd high freq 14MHz 56MHz 56MHz 12MHz 12MHz
B4_PD2 2nd high mag 1e-5 7e-5 2e-4 1e-4 4e-4 [mW/rtHz]
B4_PD2 3rd high freq 12MHz 2MHz 2MHz 2MHz 50MHz
B4_PD2 3rd high mag 1e-5 5e-5 9e-5 7e-5 1e-4 [mW/rtHz]
(mostly same as MICH offset reduction starting from gps = 1214556256 below)
B2_PD2 highest freq 6MHz 6MHz 6MHz 56MHz 16MHz
B2_PD2 highest mag 2e-5 1e-3 1e-3 1e-3 1e-3 [mW/rtHz]
B2_PD2 2nd high freq 2MHz 56MHz 56MHz 12MHz 2MHz
B2_PD2 2nd high mag 1e-5 9e-4 1e-3 1e-3 6e-4 [mW/rtHz]
B2_PD2 3rd high freq 14MHz 12MHz 12MHz 16MHz 14MHz
B2_PD2 3rd high mag 1e-5 7e-4 7e-4 7e-4 5e-4 [mW/rtHz]
(mostly same as the MICH offset reduction starting from gps = 1214556256 below)
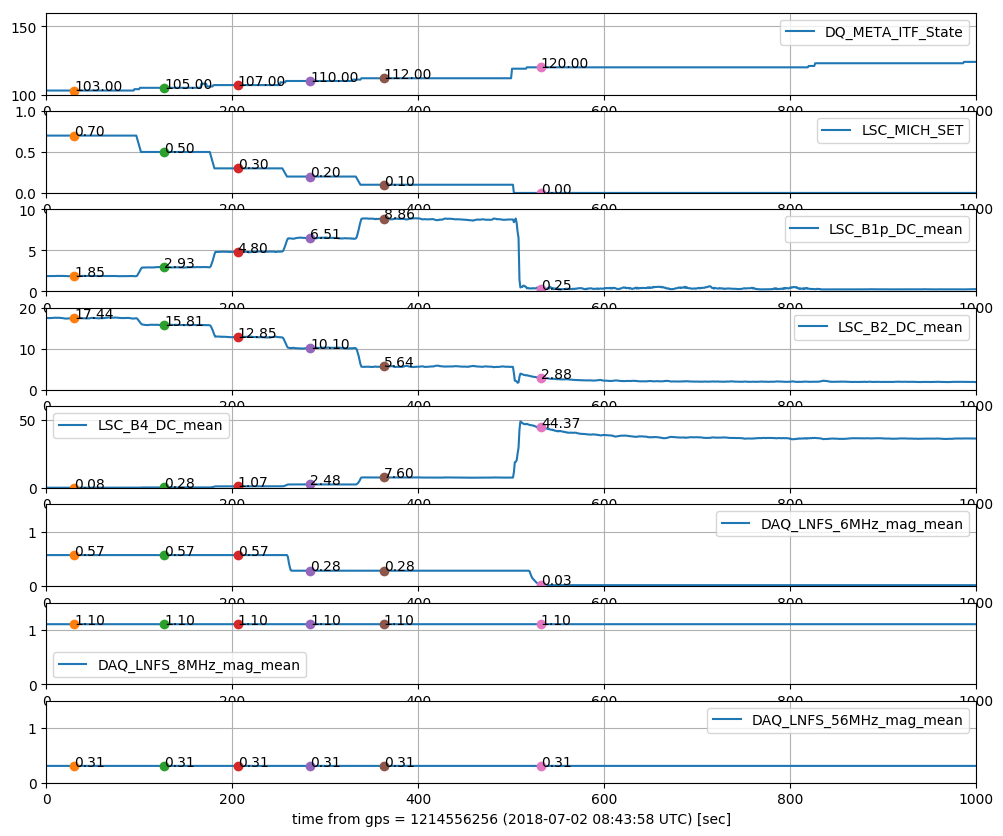
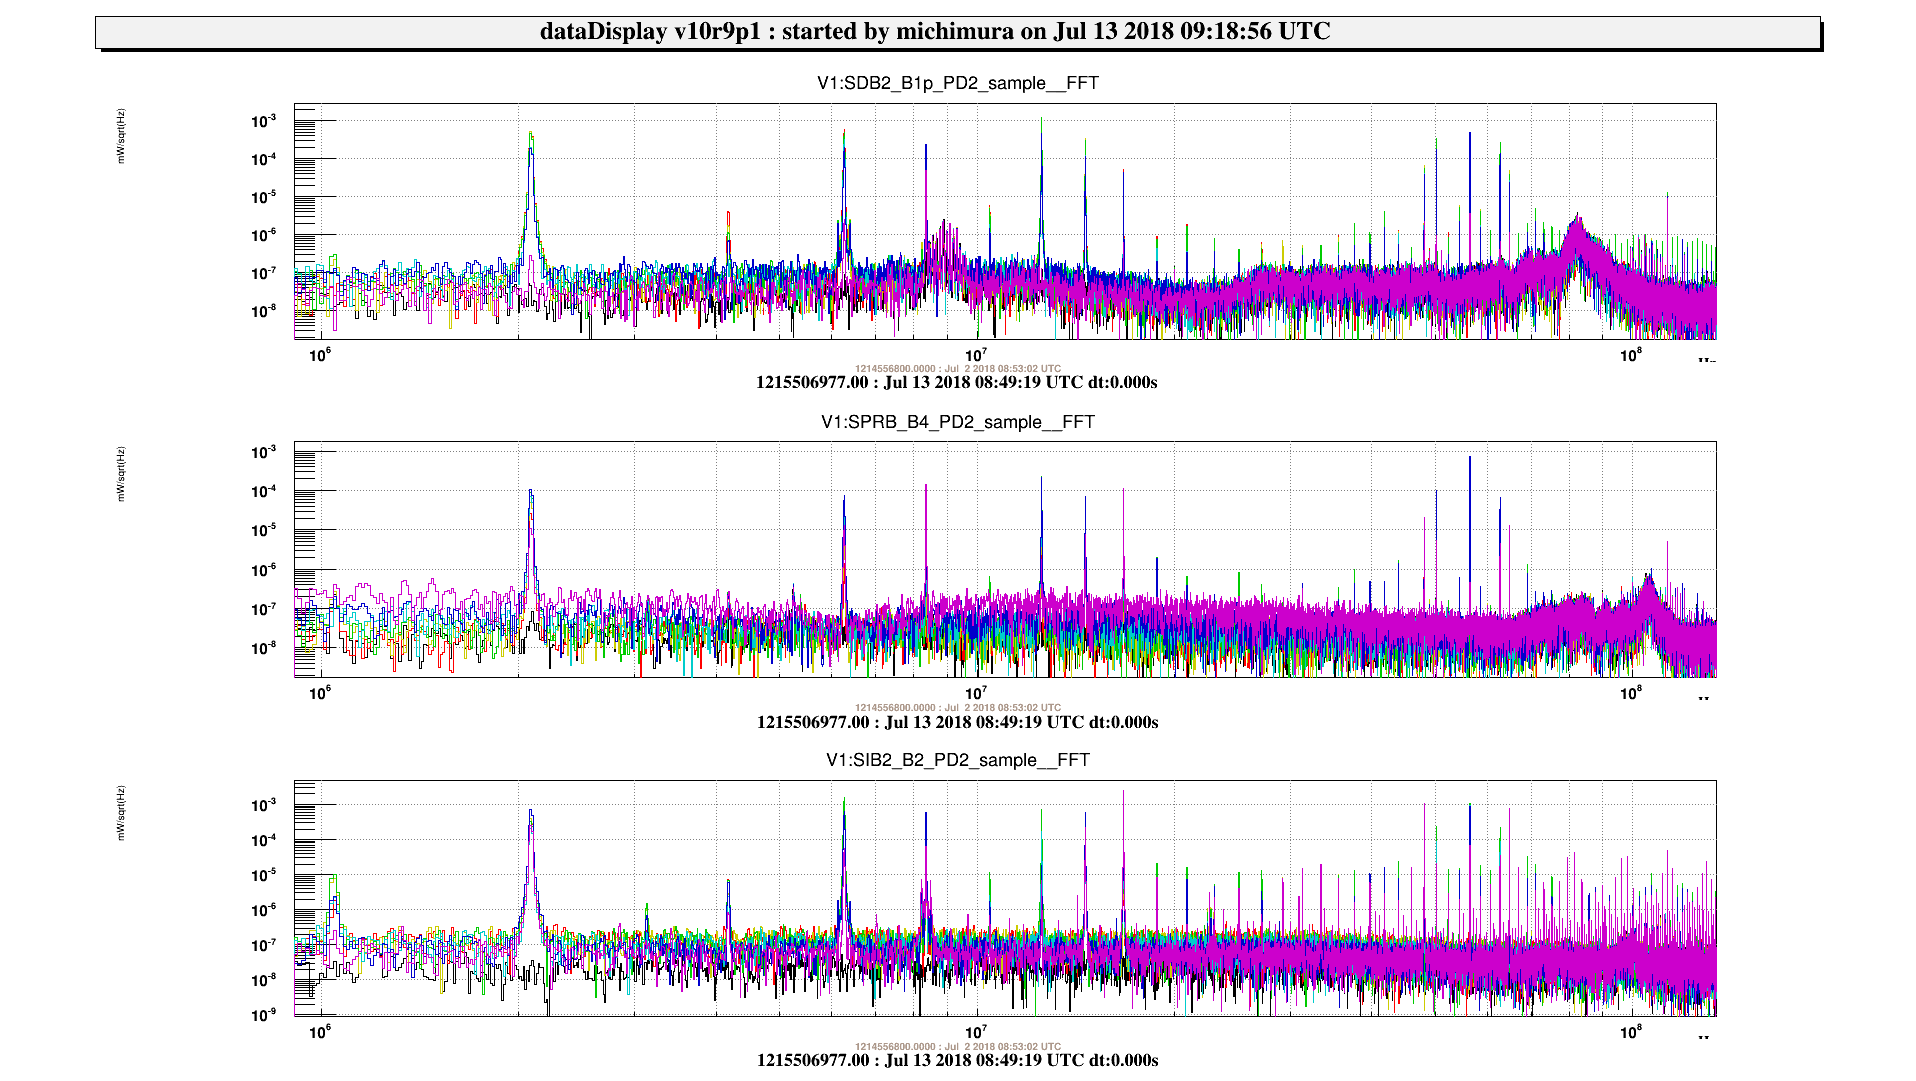
From gps = 1214556256 (2018-07-02 08:43:58 UTC) Figure of DC signals, Figure of RF PD spectra
(after B1p saturation fixed)
DQ_META_ITF_State 103. 105. 107. 110. 112. 120.
LSC_MICH_SET 0.70 0.50 0.30 0.20 0.10 0.00
LSC_B1p_DC_mean 1.85 2.93 4.80 6.51 8.86 0.25
LSC_B2_DC_mean 17.44 15.81 12.85 10.10 5.64 2.88
LSC_B4_DC_mean 0.08 0.28 1.07 2.48 7.60 44.37
DAQ_LNFS_6MHz_mag_mean 0.57 0.57 0.57 0.28 0.28 0.03 (reduced towards dark fringe)
DAQ_LNFS_8MHz_mag_mean 1.10 1.10 1.10 1.10 1.10 1.10
DAQ_LNFS_56MHz_mag_mean 0.31 0.31 0.31 0.31 0.31 0.31
B1p_PD2 highest freq 12MHz 12MHz 12MHz 56MHz 56MHz 8MHz
B1p_PD2 highest mag 7e-4 9e-4 1e-3 4e-4 5e-4 5e-5 [mW/rtHz]
B1p_PD2 2nd high freq 6MHz 2MHz 6MHz 12MHz 12MHz 112MHz
B1p_PD2 2nd high mag 6e-4 5e-4 5e-4 4e-4 5e-4 9e-6 [mW/rtHz]
B1p_PD2 3rd high freq 2MHz 6MHz 2MHz 6MHz 8MHz 56MHz
B1p_PD2 3rd high mag 5e-4 4e-4 5e-4 3e-4 3e-4 4e-6 [mW/rtHz]
(12MHz at 0.3 offset is highest, 2MHz is also high)
B4_PD2 highest freq 12MHz 12MHz 12MHz 56MHz 56MHz 8MHz
B4_PD2 highest mag 3e-5 9e-5 2e-4 2e-4 7e-4 1e-4 [mW/rtHz]
B4_PD2 2nd high freq 2MHz 56MHz 56MHz 12MHz 12MHz 16MHz
B4_PD2 2nd high mag 3e-5 6e-5 2e-4 1e-4 2e-4 1e-4 [mW/rtHz]
B4_PD2 3rd high freq 14MHz 2MHz 2MHz 2MHz 2MHz 48MHz
B4_PD2 3rd high mag 2e-5 5e-5 9e-5 7e-5 1e-4 2e-5 [mW/rtHz]
(56MHz at 0.1 offset is highest, 12MHz is also high)
B2_PD2 highest freq 6MHz 6MHz 6MHz 56MHz 16MHz 16MHz
B2_PD2 highest mag 7e-4 1e-3 2e-3 9e-4 1e-3 2e-3 [mW/rtHz]
B2_PD2 2nd high freq 12MHz 56MHz 56MHz 12MHz 56MHz 48MHz
B2_PD2 2nd high mag 5e-4 8e-4 1e-3 7e-4 9e-4 1e-3 [mW/rtHz]
B2_PD2 3rd high freq 2MHz 12MHz 12MHz 6MHz 2MHz 64MHz
B2_PD2 3rd high mag 4e-4 6e-4 7e-4 6e-4 7e-4 8e-4 [mW/rtHz]
(16MHz at dark fringe is highest, 56MHz and 56+/-8MHz are also high)
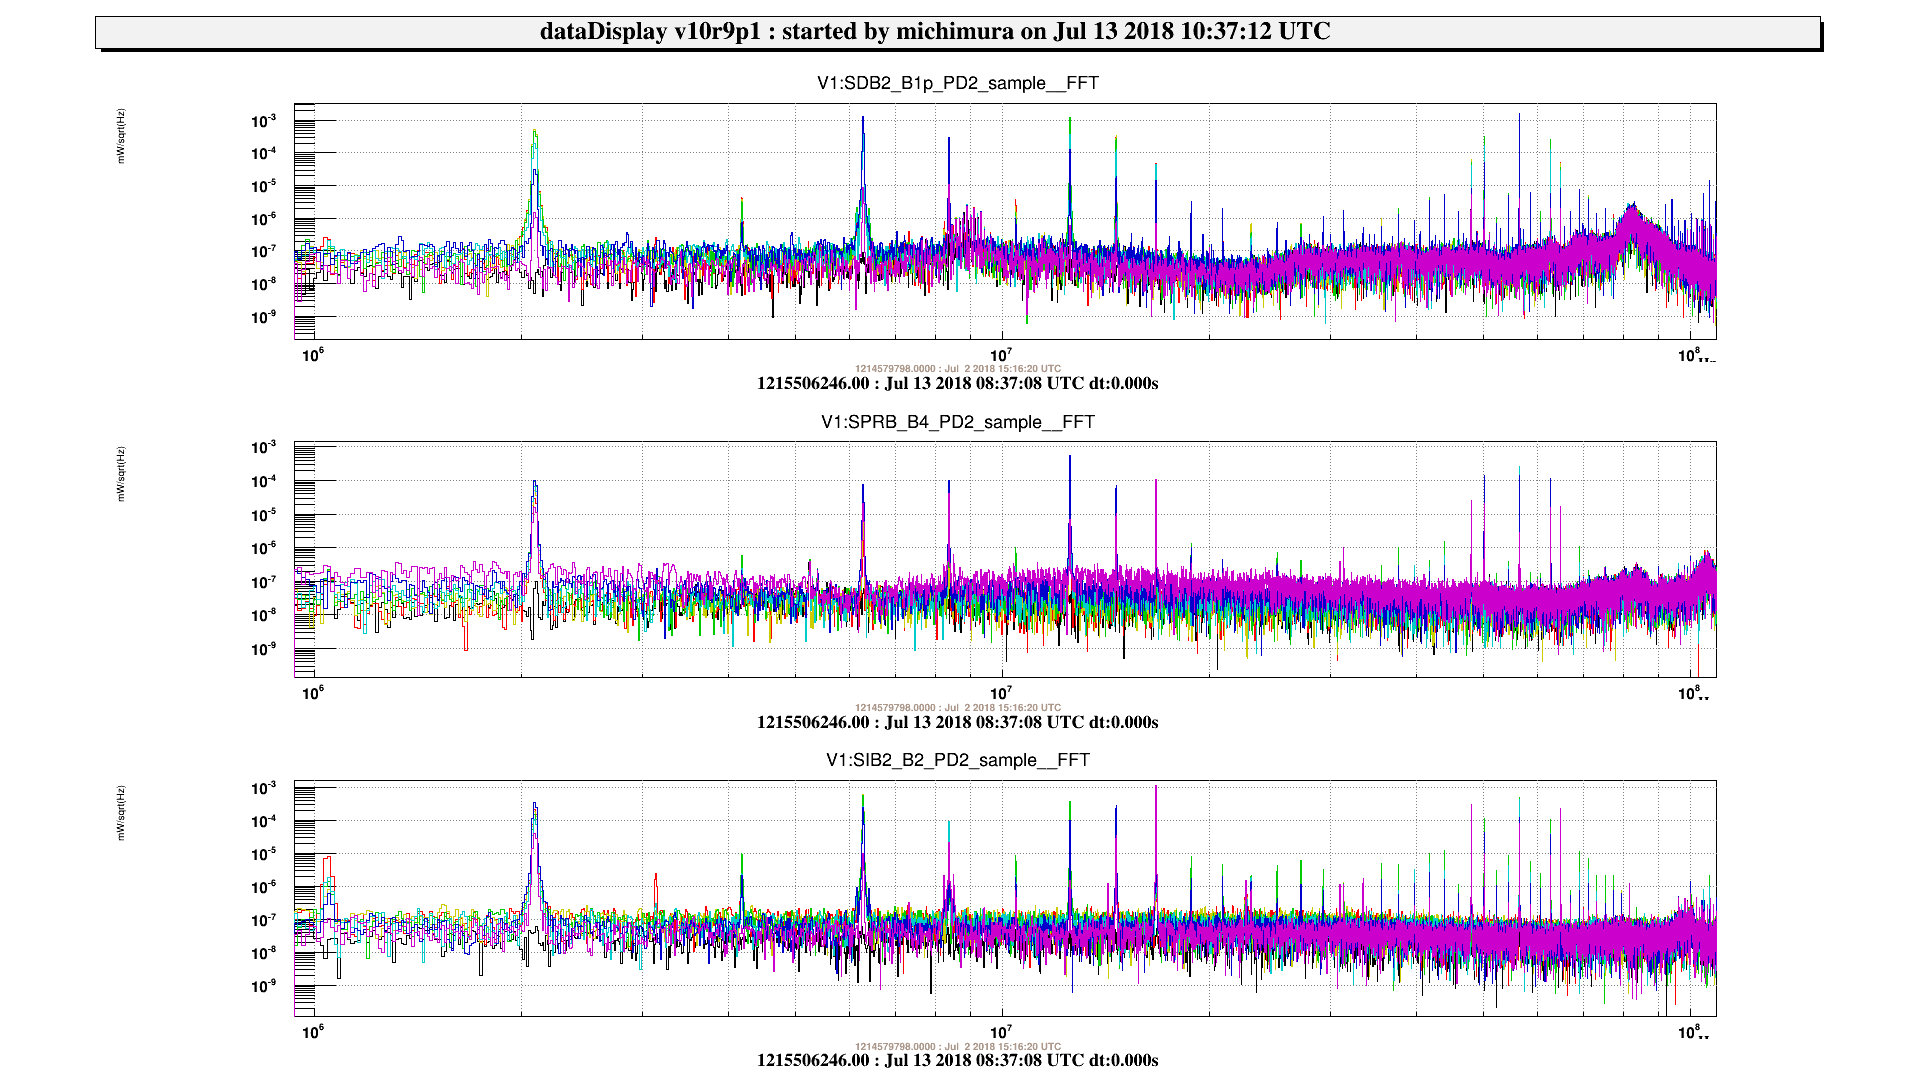
gps = 1214578932 (2018-07-02 15:01:54 UTC) Figure of DC signals, Figure of RF PD spectra
(after decreasing the power on B2)
DQ_META_ITF_State 103. 105. 107. 110. 112. 120.
LSC_MICH_SET 0.70 0.50 0.30 0.20 0.10 0.00
LSC_B1p_DC_mean 1.87 2.97 4.87 6.50 8.78 0.49
LSC_B2_DC_mean 8.17 7.35 6.03 4.79 2.65 1.24 (~half the DC power)
LSC_B4_DC_mean 0.08 0.28 1.08 2.47 7.52 44.11
DAQ_LNFS_6MHz_mag_mean 0.57 0.57 0.57 0.28 0.28 0.02 (reduced towards dark fringe)
DAQ_LNFS_8MHz_mag_mean 1.10 1.10 1.10 1.10 1.10 1.10
DAQ_LNFS_56MHz_mag_mean 0.31 0.31 0.31 0.31 0.31 0.31
B1p_PD2 highest freq 12MHz 12MHz 12MHz 12MHz 56MHz 112MHz
B1p_PD2 highest mag 7e-4 9e-4 1e-3 4e-4 2e-3 2e-5 [mW/rtHz]
B1p_PD2 2nd high freq 6MHz 2MHz 6MHz 6MHz 6MHz 8MHz
B1p_PD2 2nd high mag 7e-4 5e-4 6e-4 4e-4 1e-3 1e-5 [mW/rtHz]
B1p_PD2 3rd high freq 2MHz 6MHz 2MHz 56MHz 8MHz 6MHz
B1p_PD2 3rd high mag 5e-4 4e-4 4e-4 2e-4 3e-4 9e-6 [mW/rtHz]
(mostly same as MICH offset reduction starting from gps = 1214556256 above, but different at 0.2-0.0 offset)
B4_PD2 highest freq 12MHz 12MHz 12MHz 56MHz 12MHz 16MHz
B4_PD2 highest mag 3e-5 8e-5 2e-4 3e-4 5e-4 1e-4 [mW/rtHz]
B4_PD2 2nd high freq 2MHz 56MHz 56MHz 12MHz 48MHz 8MHz
B4_PD2 2nd high mag 3e-5 6e-5 2e-4 1e-4 1e-4 4e-5 [mW/rtHz]
B4_PD2 3rd high freq 14MHz 2MHz 2MHz 2MHz 56MHz 48MHz
B4_PD2 3rd high mag 2e-5 5e-5 9e-5 7e-5 1e-4 3e-5 [mW/rtHz]
(mostly same as MICH offset reduction starting from gps = 1214556256 above, but different at 0.2-0.0 offset)
B2_PD2 highest freq 6MHz 6MHz 6MHz 56MHz 16MHz 16MHz
B2_PD2 highest mag 3e-4 6e-4 6e-4 4e-4 5e-4 1e-3 [mW/rtHz]
B2_PD2 2nd high freq 12MHz 56MHz 56MHz 12MHz 2MHz 48MHz
B2_PD2 2nd high mag 3e-4 4e-4 5e-4 3e-4 3e-4 3e-4 [mW/rtHz]
B2_PD2 3rd high freq 56MHz 12MHz 12MHz 6MHz 14MHz 64MHz
B2_PD2 3rd high mag 3e-4 3e-4 4e-4 3e-4 3e-4 2e-4 [mW/rtHz]
(mostly half the MICH offset reduction starting from gps = 1214556256 above, as expected)

I checked RF PD saturation situation after a lot of sideband power decrease during MICH offset reduction (see logbook #42162 and #42188).
RMS of the photodiode signals seem to be limited by the main sidebands, and most offending sideband is now 6MHz at MICH offset of 0.1 to 0.0.
If we want to have more range in the future with current locking scheme, we might want to notch 6MHz for B1p and B4.
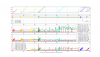
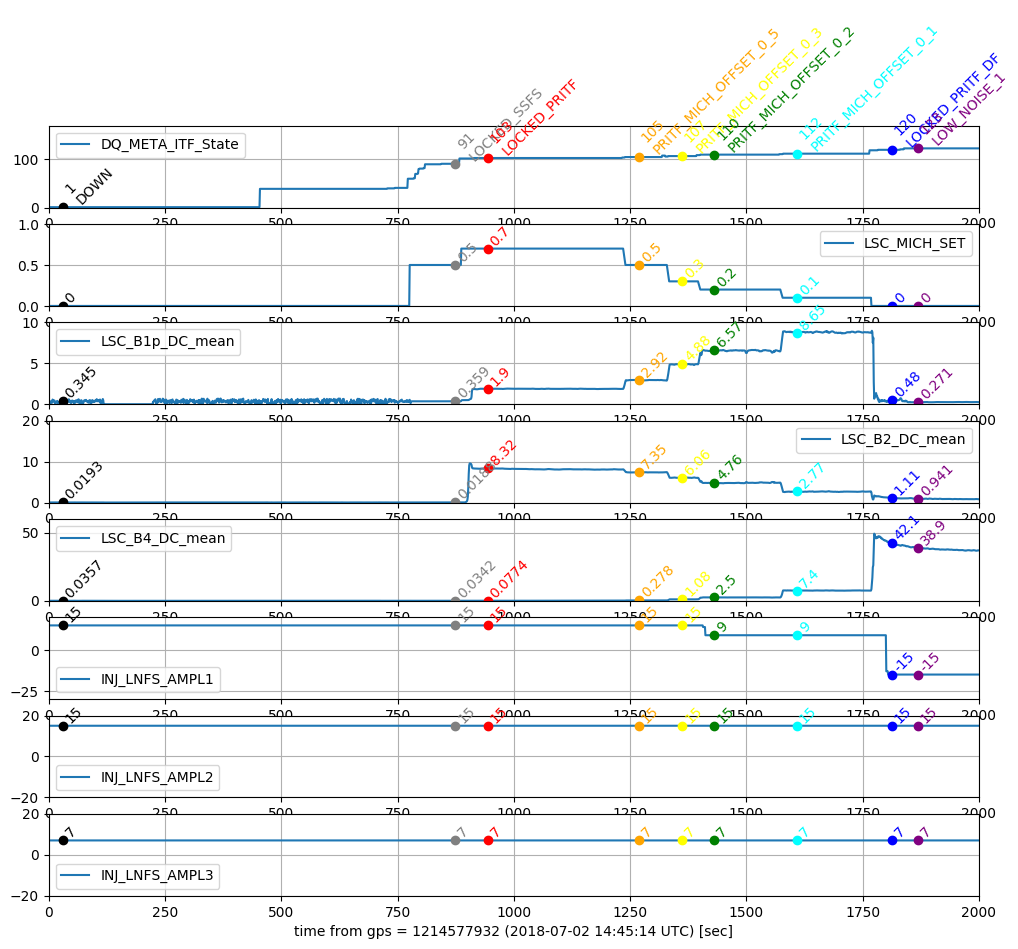
Lock sequence:
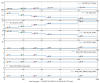
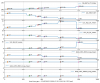
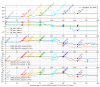
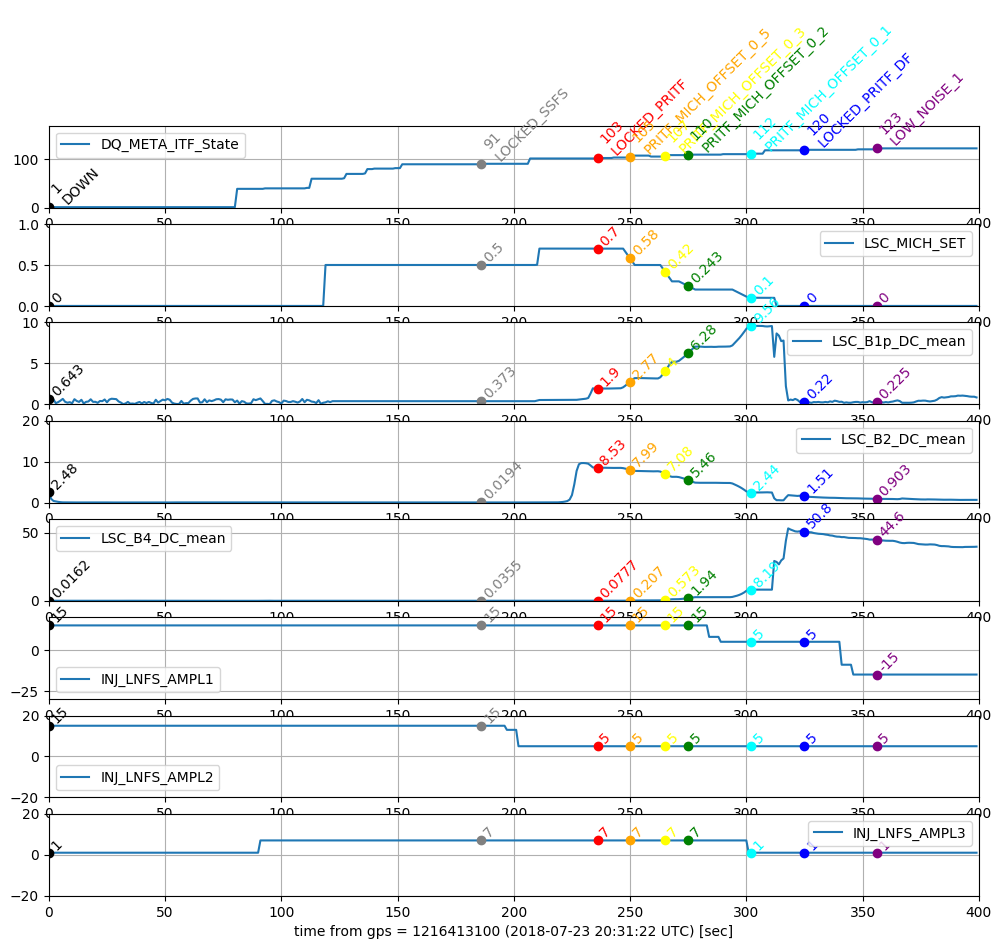
To visualize the lock sequence, I made a time series plot of Metatron states, DC power at B1p/B2/B4 and modulation amplitudes.
DCchannelsTimeseries1214577932.png is the plot on July 2 (after nominal 56MHz modulation depth reduction from 12dBm to 7dBm).
6MHz starts with 15dBm, but reduced to 9dBm during MICH offset reduction from 0.3 to 0.2. It is further reduced to -15dBm in DF.
8MHz and 56MHz are kept at 15dBm and 7dBm respectively during the whole lock acquisition.
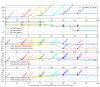
DCchannelsTimeseries1216413100.png is the plot on July 23, when we reached Low Noise 3 (see #42188).
6MHz is reduced from 15dBm to 5dBm during MICH offset reduction from 0.2 to 0.1. And then it is further reduced to -15dBm in DF.
8MHz is reduced from 15dBm to 5dBm during transition from LOCKED_SSFS to LOCKED_PRITF.
56MHz is reduced from 7dBm to 1dBm during MICH offset reduction from 0.2 to 0.1.
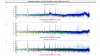
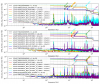
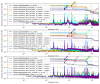
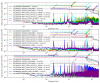
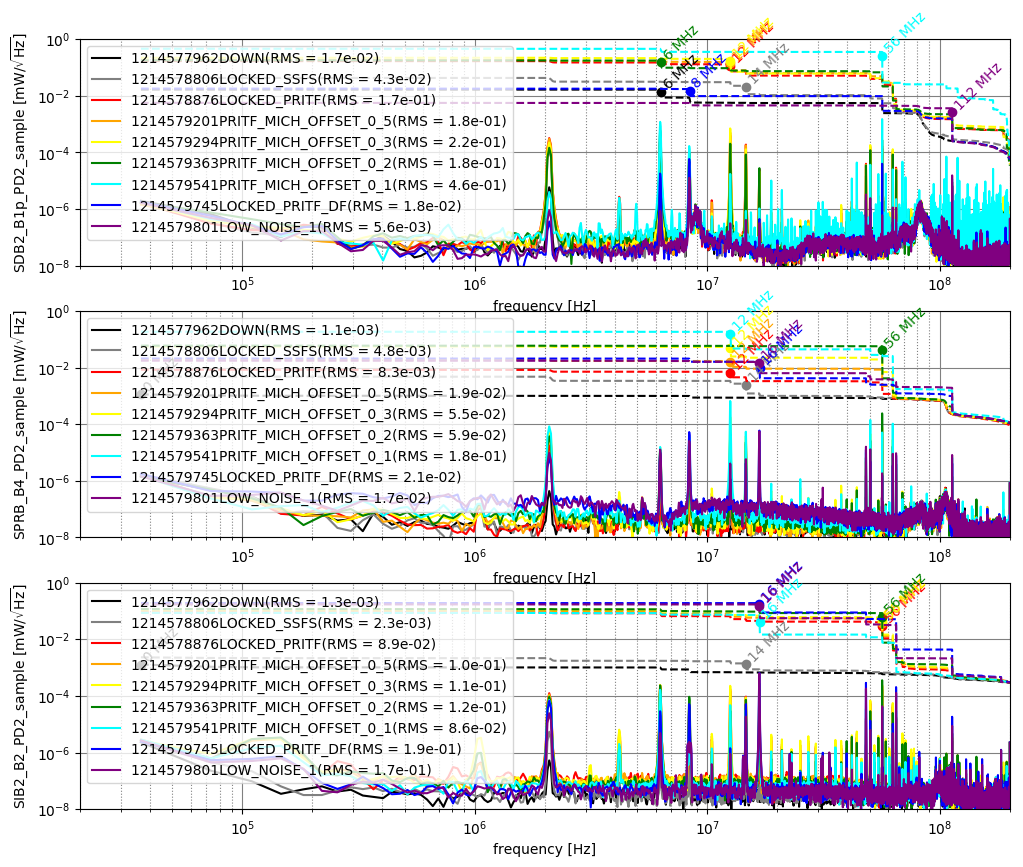
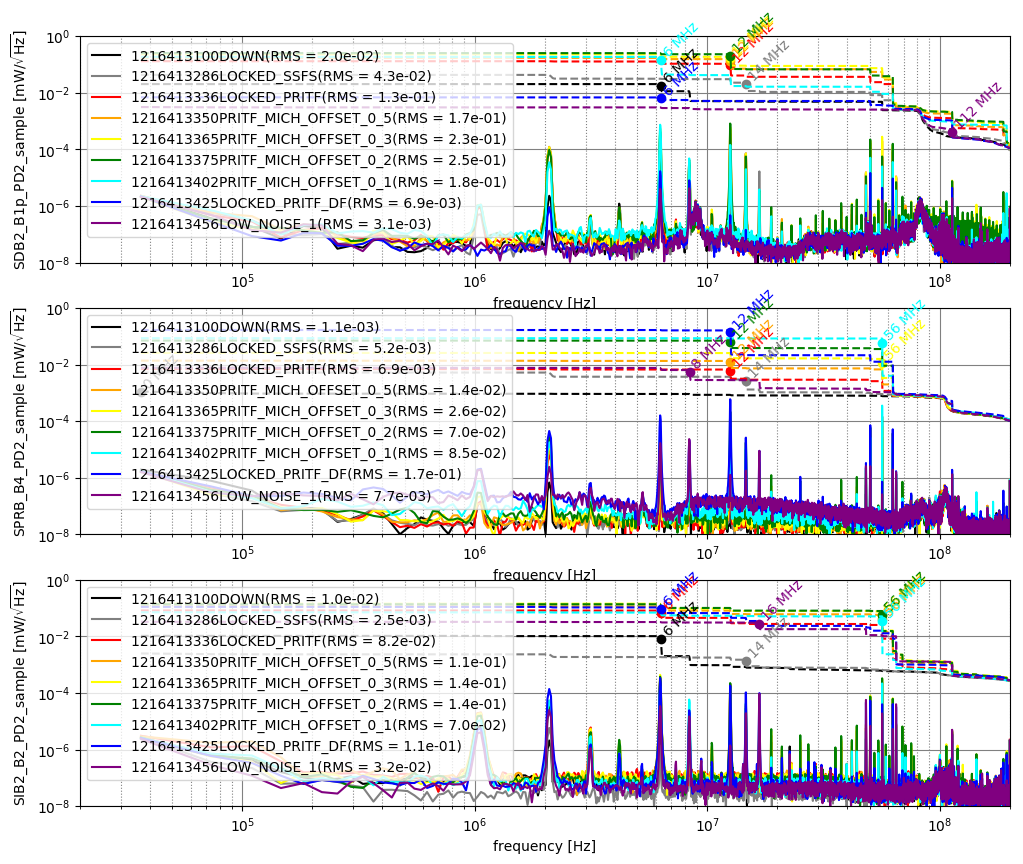
RF PD spectra with RMS:
RFchannelsSpectra1214577932.png is the spectra from July 2 and RFchannelsSpectra1216413100.png is the spectra from July 23.
Dashed line shows the RMS and dots show the most RMS-contributing frequency.
You can see the RMS reduction and saturation reduction especially at MICH offset of 0.1.
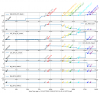
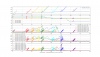
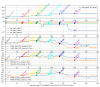
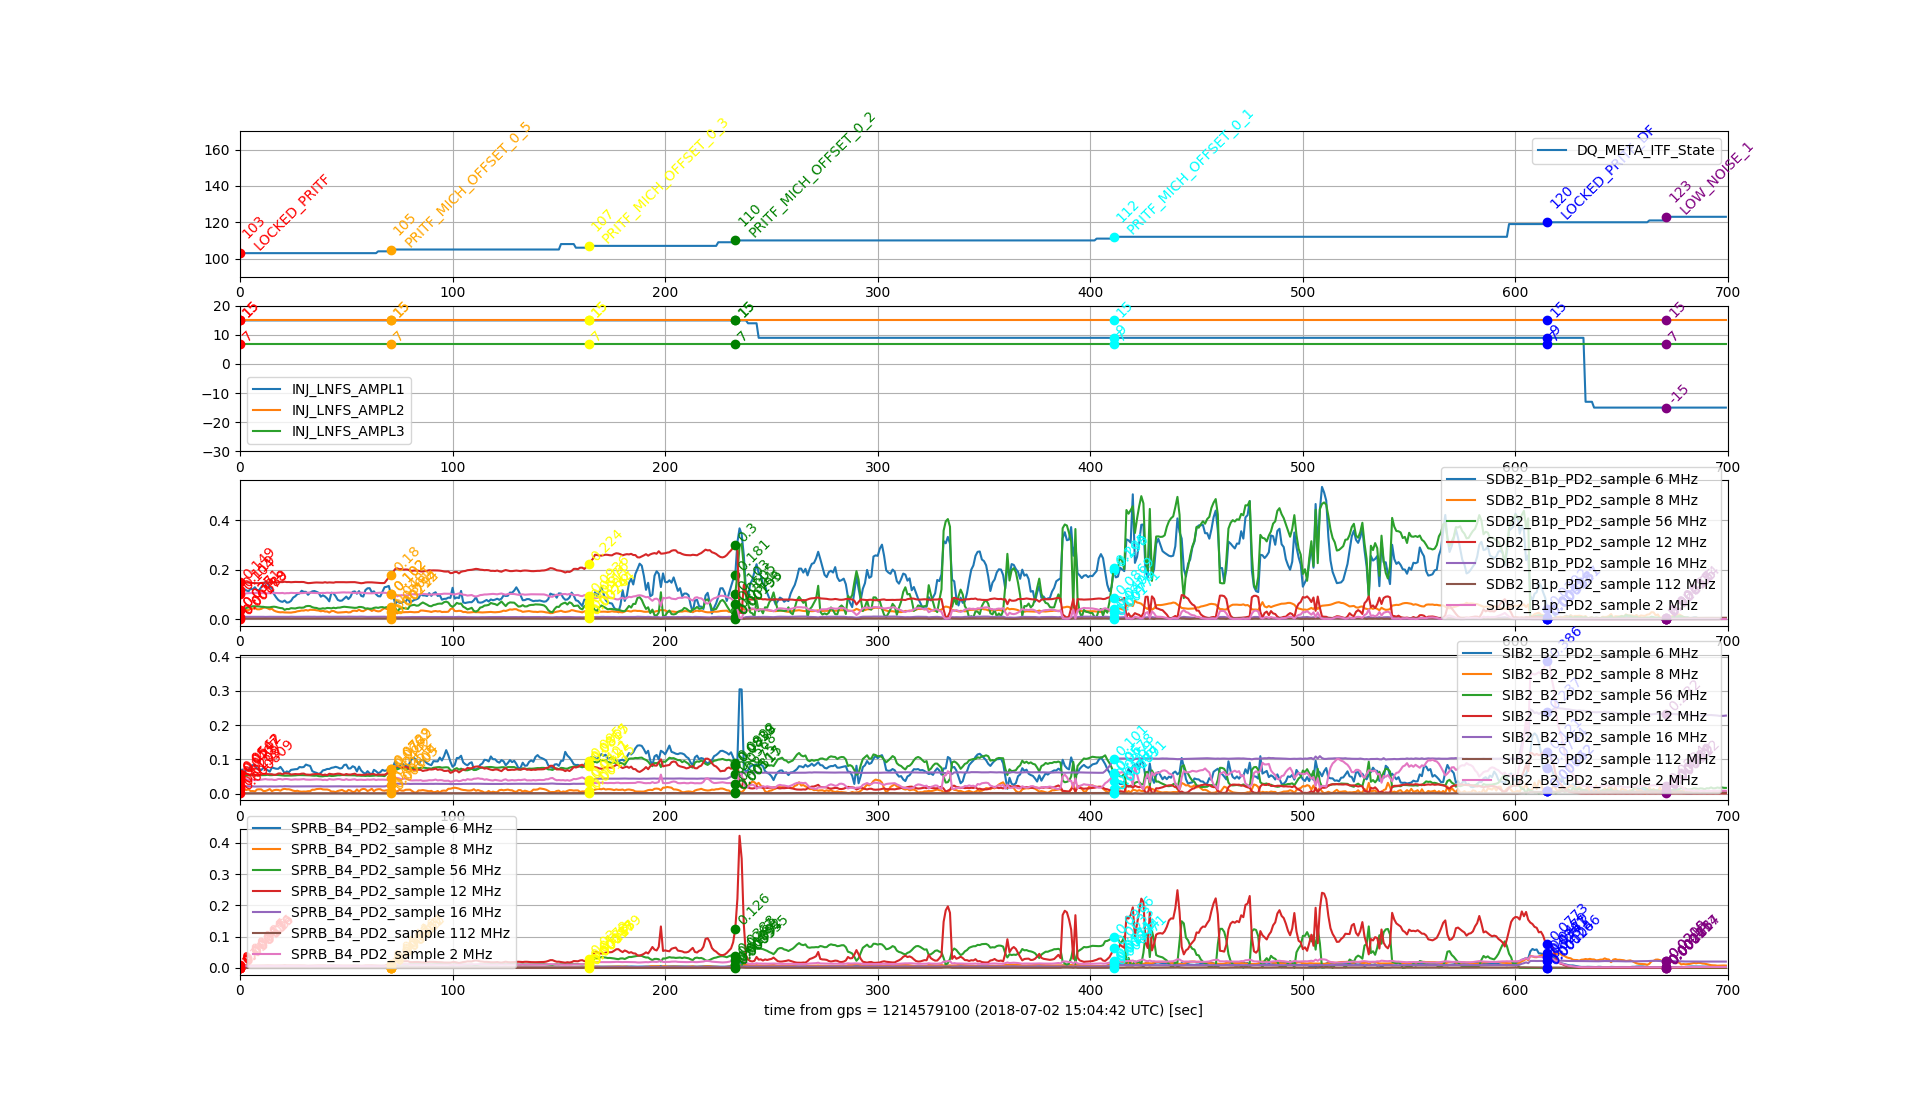
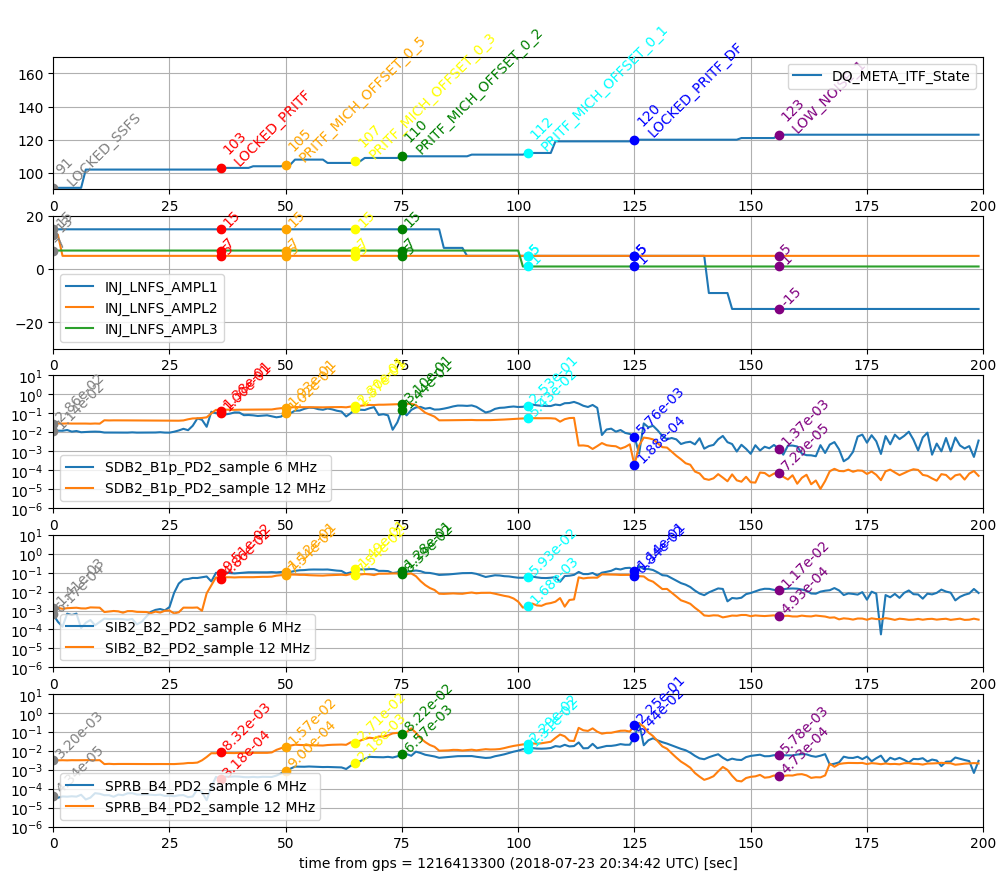
Demodulated signals of RF PDs:
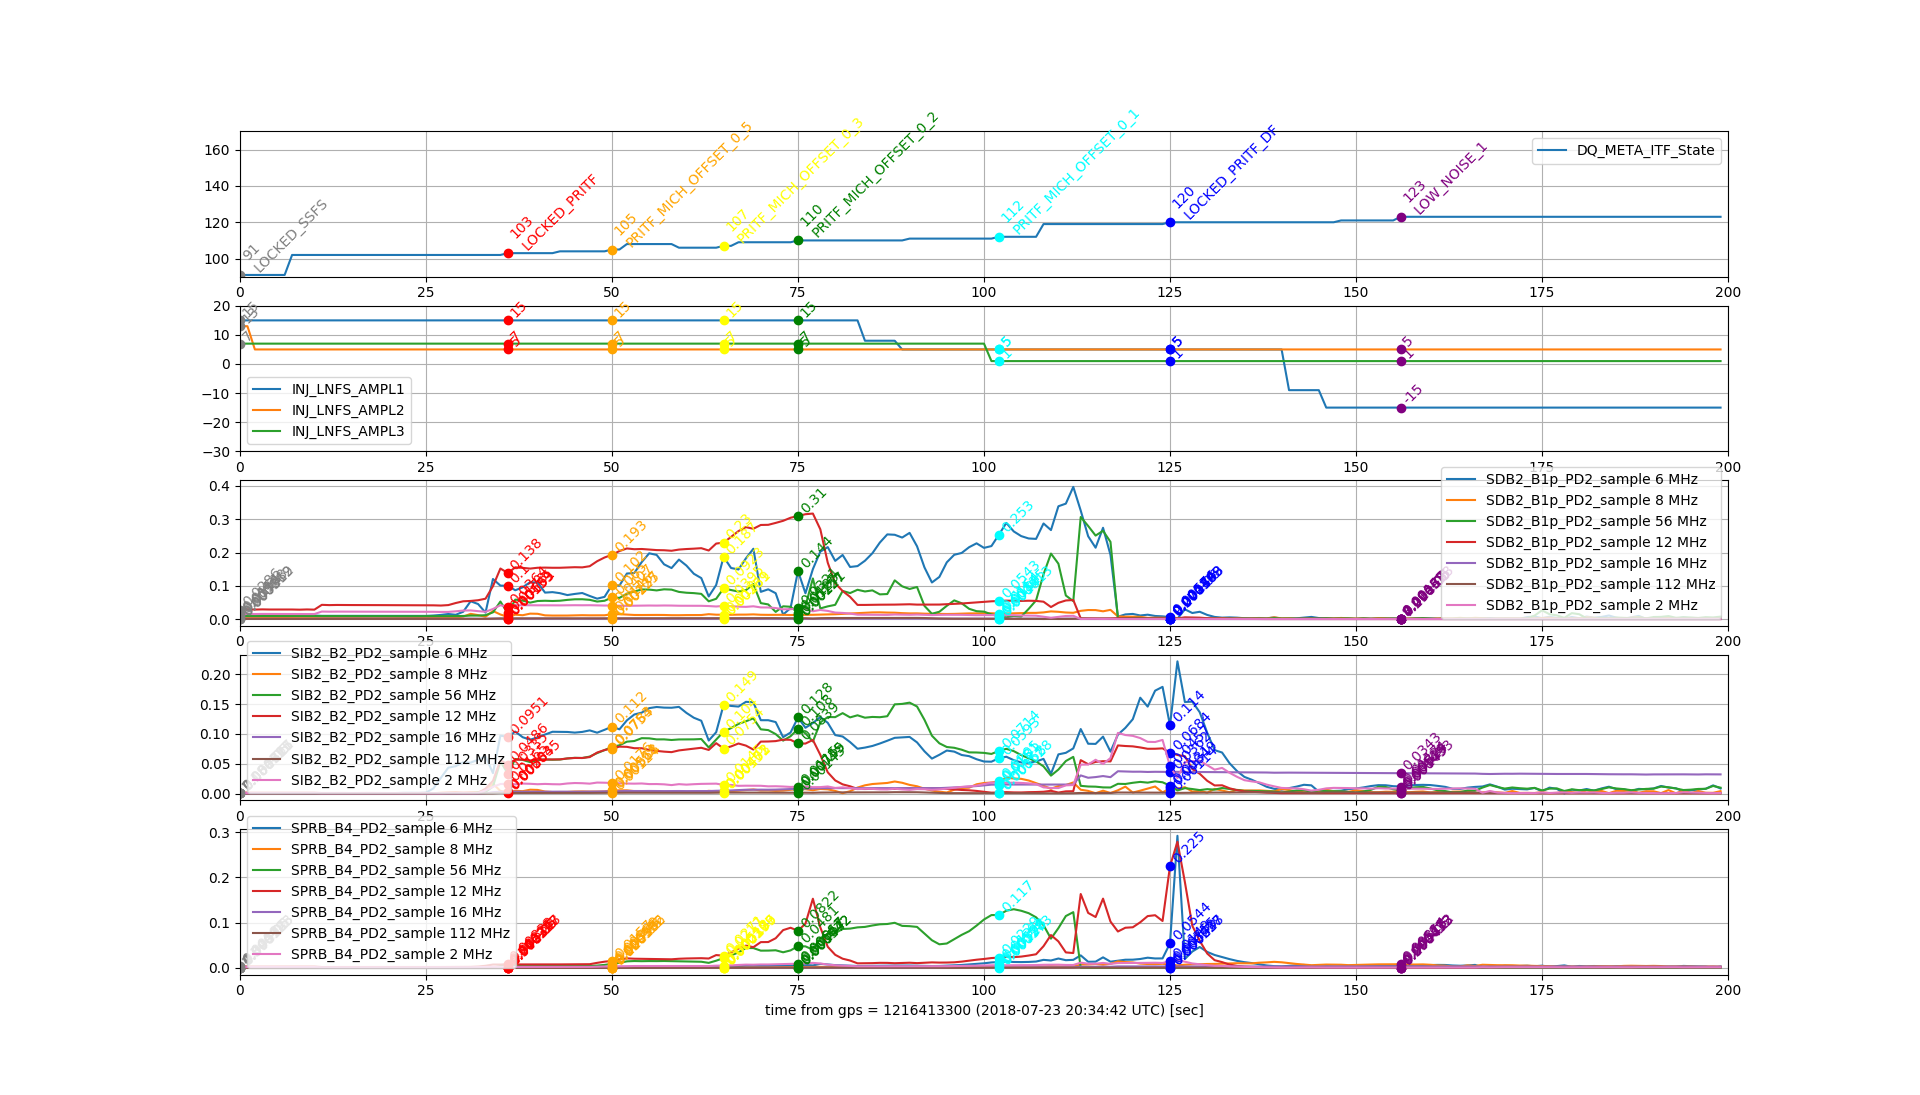
I also plotted the time series data of demodulated amplitudes at 6MHz, 8MHz, 56MHz, 12MHz, 16MHz, 112MHz, and 2MHz of B1p/B2/B4 400MHz raw signals.
DemodulationTimeseries1214579100.png is that for July 2 and DemodulationTimeseries1216413300.png is that for July 23.
From July 2, you can see that 6MHz and 56MHz were high (and oscillating!) at B1p at MICH offset of 0.1. 16MHz and 2MHz were also killing B2 from MICH offset reduction to DF.
On July 23, the situation is much better. You can see that modulation depth reduction is effectively reducing amplitudes of one of the highest sidebands (note that INJ_LNFS_AMPL# has some delay and actual sideband power reduction happens O(10) sec before).
You can also see that the sideband which has largest amplitude during the lock sequence is 6MHz.
For a quick check, I made a comparison of lock sequences between June 23 when we achieved 35Mpc at 13W and the current one at 25W.
Although there are big fluctuations and hard to tell, most of the sideband powers at B1p, B2, B4 seem reasonably scaled with power change. B4 8MHz power seems a bit higher (~ x4) than expected from dark fringe, and B4 112MHz power seems a bit lower (~ 1/2) than expected in Low Noise 1. B4 8MHz being higher could be related to PRCL servo (not enough gain? bad demodulation phase tuning?). B4 112MHz being less suggest less 56MHz build up in PRC (thermal lensing? alignment?). Further investigations necessary.
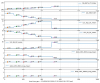
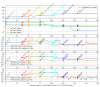
Lock sequence:
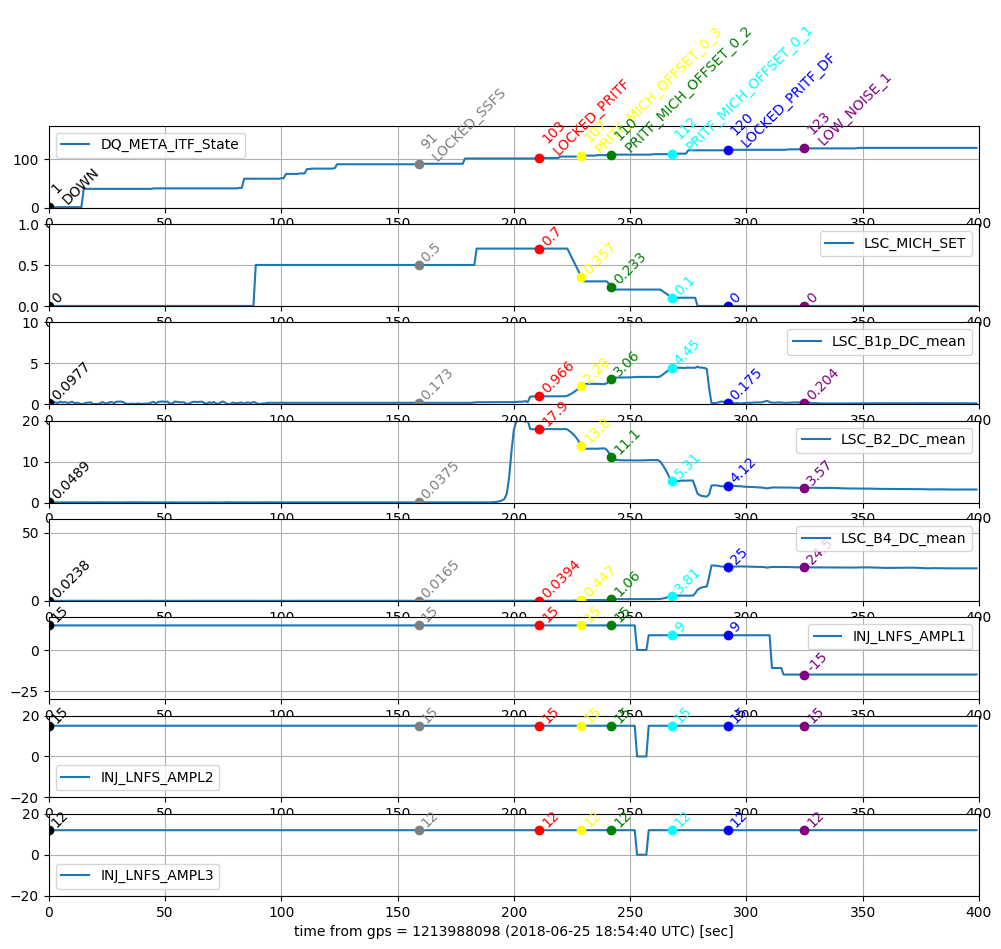
DCchannelsTimeseries1213988098.png is the plot showing time series of Metatron states, DC power at B1p/B2/B4 and modulation amplitudes on June 25. If you compare it with the same plot on July 23 (DCchannelsTimeseries1216413100.png in logbook #42201), you can see that power on B1p and B4 is doubled, and power on B2 is now half.
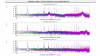
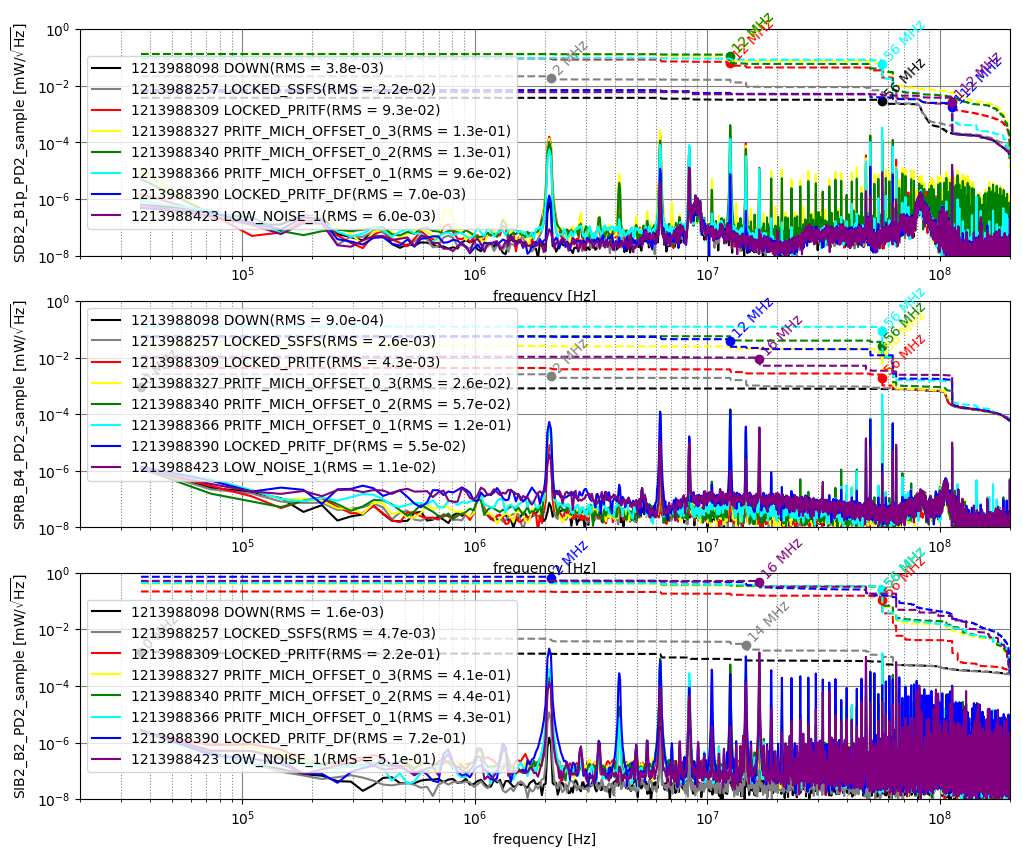
RF PD spectra with RMS:
RFchannelsSpectra1213988098.png is the spectra of RF PDs from June 25. Compared with the spectra from July 23 (RFchannelsSpectra1216413100.png in logbook #42201), you can see that there were many harmonics in B2 and B1p, even we were at 13W.
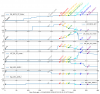
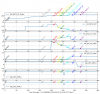
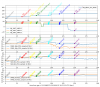
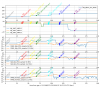
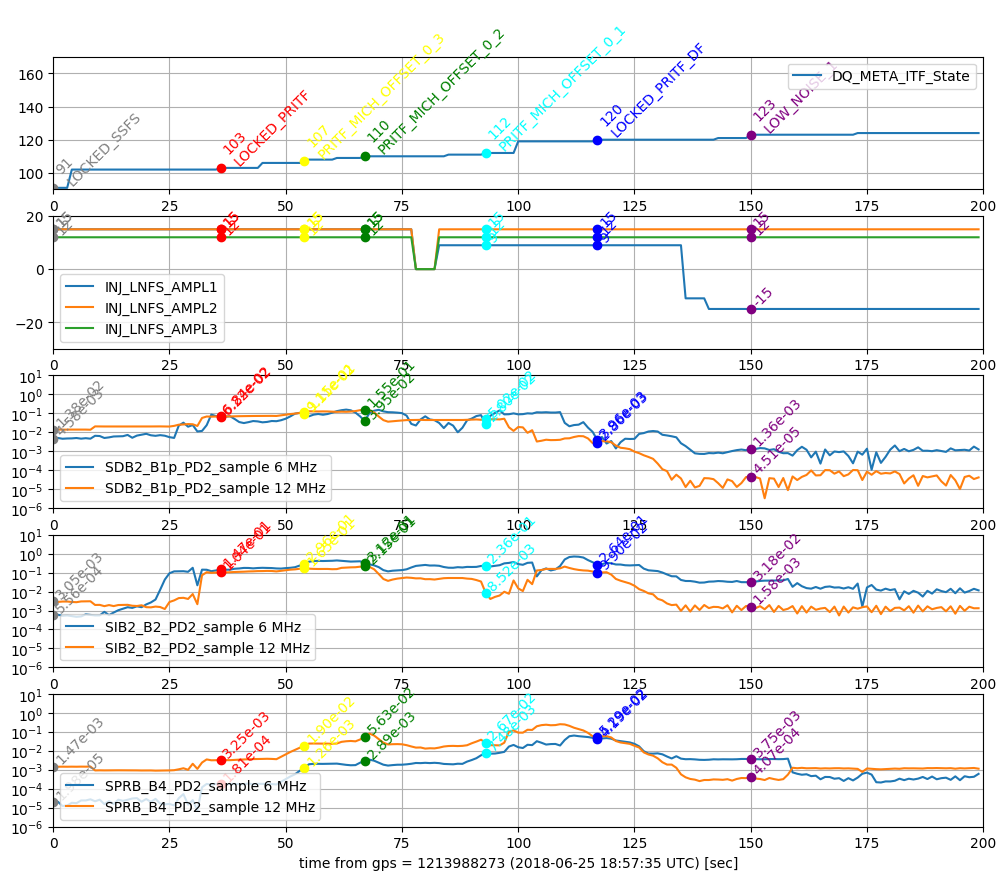
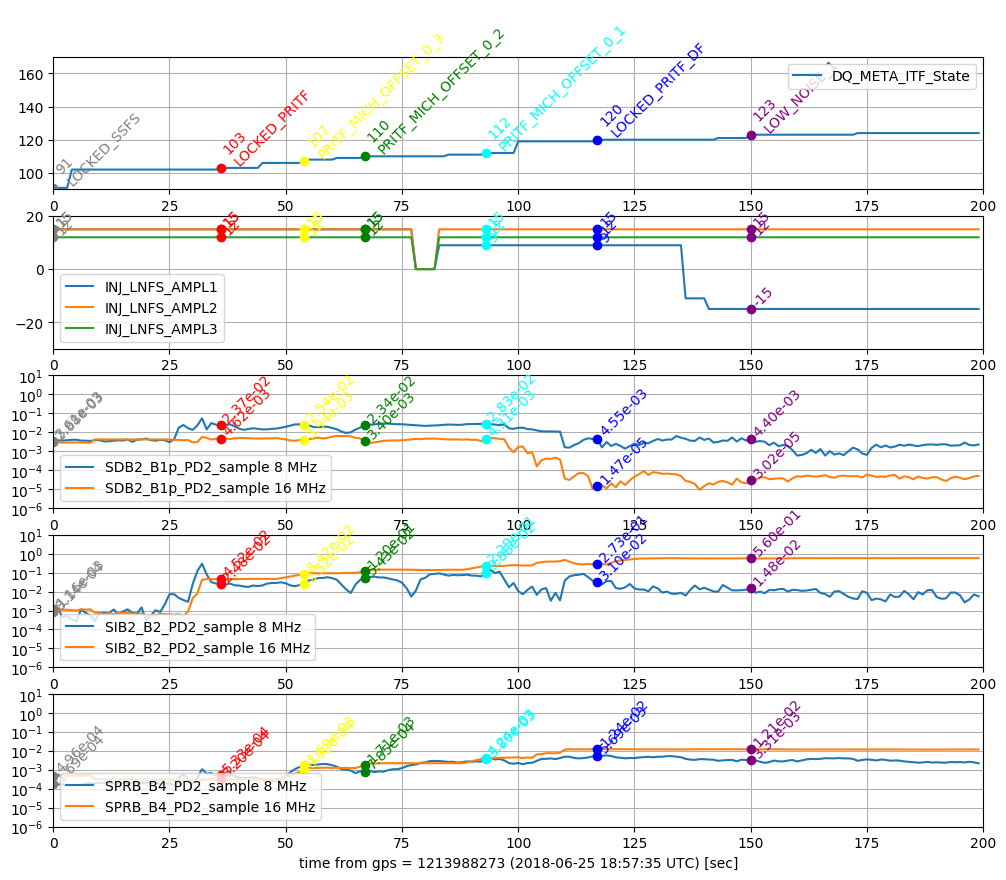
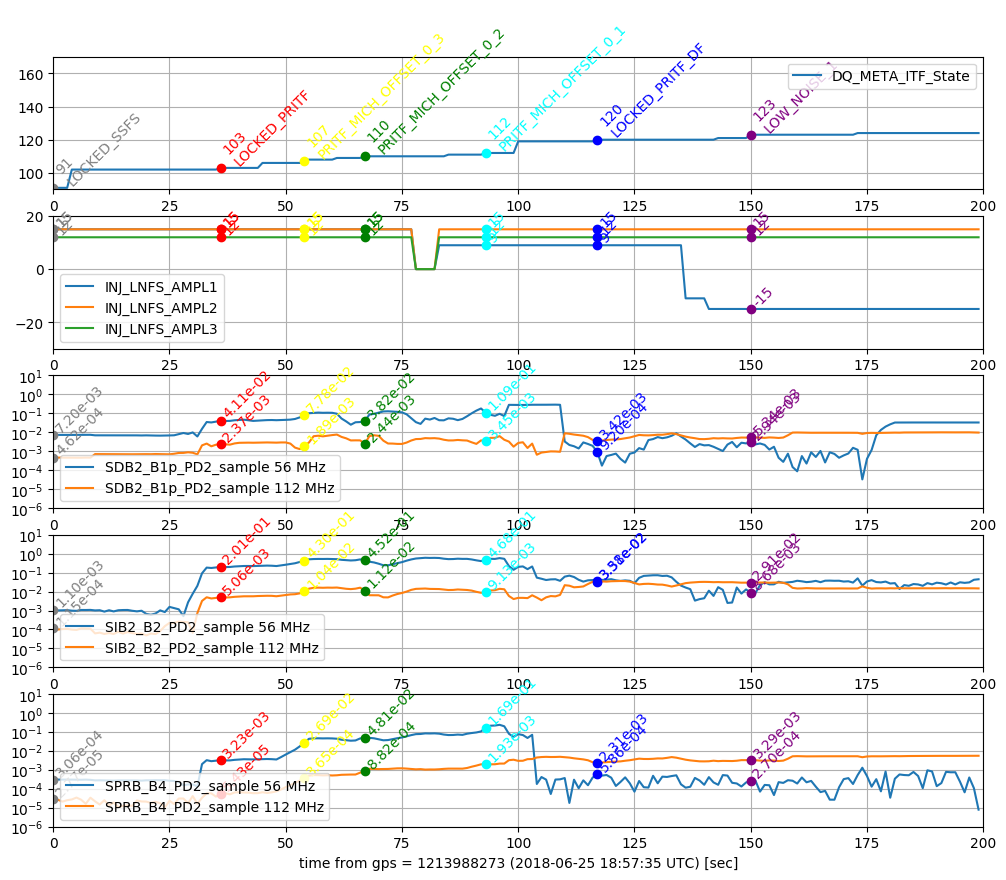
Demodulated signals of RF PDs:
The time series data of demodulated amplitudes at 6MHz, 8MHz, 56MHz and their 2nd harmonics are generated (see attached figures; links in table below). Since SDB2_B1p_PD2_sample, SIB2_B2_PD2_sample, SPRB_B4_PD2_sample are only saved 32768 samples per second (8.192e-05 seconds per second), I demodulated the data in one chunk of 32768 samples to give the demodulation amplitude for each second. The demodulation was done using the frequency stored at INJ_LNFS_FREQ{1|2|3}.
6MHz, 8MHz and 56MHz are generated by the beat between the carrier and the sideband. Therefore, their power should scale as modulation depth times DC power. 12MHz, 16MHz and 112MHz are generated by the beat between upper and lower sidebands. Therefore, their power should scale as modulation depth squared times DC power.
Below is the summary table of modulation amplitudes in dBm at the starting point of the MICH offset reduction and at Low Noise 1 in June 25 and July 23, and how DC and RF power on B1p, B2, B4 changed.
June 25 July 23 B1p B2 B4
DC power ~doubled ~half ~doubled
[as expected]
6MHz 15dBm->-15dBm 15dBm->-15dBm ~doubled ~half ~doubled
12MHz ~doubled ~half ~doubled
figure figure [no anomaly from expectation found]
8MHz 15dBm 5dBm ~half [0.6] ~1/10~1/2 [0.2] ~1/3->~2 [0.6]
16MHz ~1/3 [0.2] ~1/20~1/10 [0.05] ~1/3 [0.2]
figure figure [expectations in []; no anomaly from expectation, but B4 8MHz seems higher from DF]
56MHz 12dBm 7dBm->1dBm ~same->half bit less than [half->1/4] ~same->half
112MHz ~half->1/4 ~1/10 [1/4->1/8] ~half->1/4 (but ~1/10 LN1)
figure figure [no anomaly from expectation, but B4 112MHz seems lower at LN1]
Note that INJ_LNFS_AMPL{1|2|3} being zero between MICH_OFFSET_0_2 and _0_1 in the plots for June 25 is fake due to some data error. I confirmed that INJ_LNFS_FREQ{1|2|3} are also zero at this moment, which is very unlikely real.