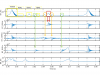
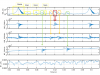
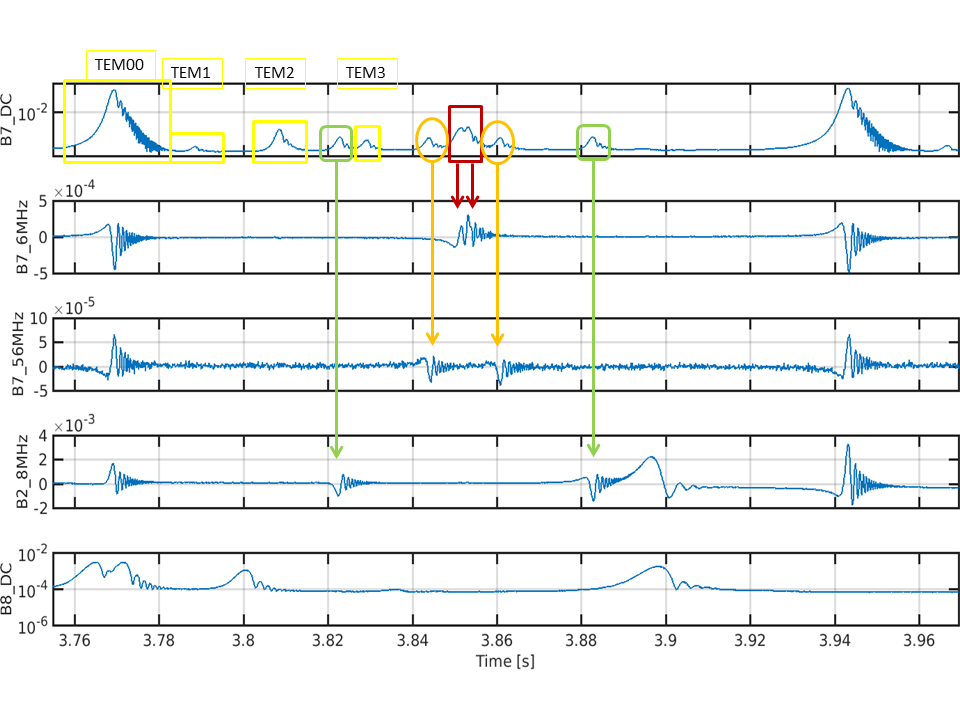
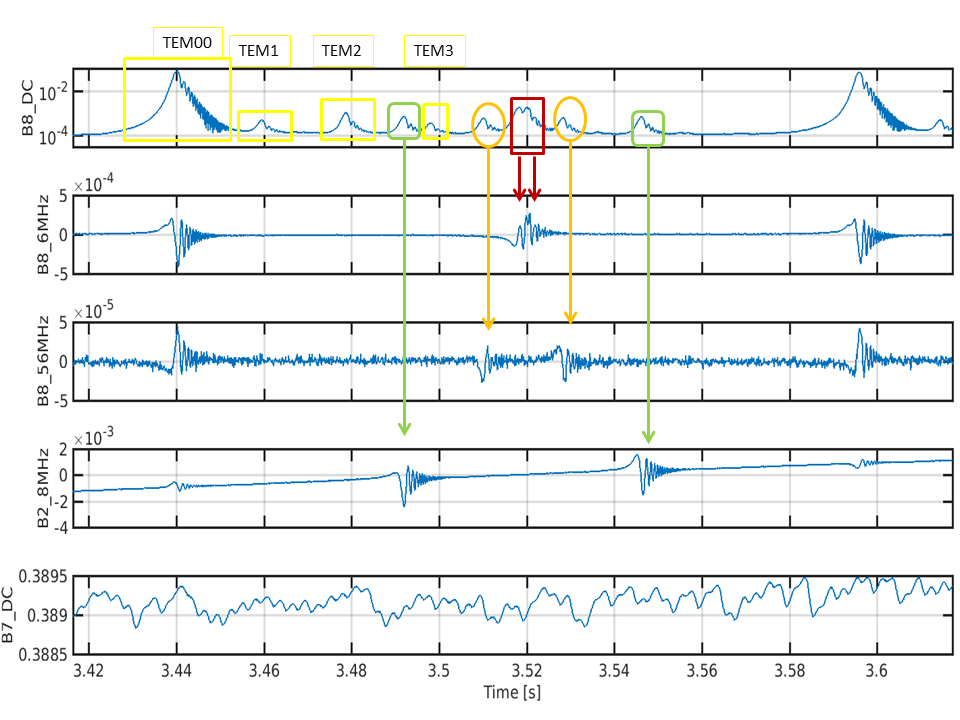
We identified the major peaks present in the arms FSR.
In order to distinguish between the carrier HOM peaks and the sidebands, we looked also at the error signal demodulated at 6MHz and 56MHz in transmission of the arm cavity and at the one demodulated at 8MHz in reflection (B2) while the cavities were free swinging.
A zoom around one FSR of the North arm and of the West arm are shown in figures 1 and 2, respectively.
In the yellow boxes, the carrier fundamental mode and the first 3 HOMs are highlighted. In particular the resonance of the TEM00 mode is also well visible in all the demodulated signals, as expected, while the HOMs are too weak to see their corresponding demodulated signals.
In the red square, in the middle of the FSR, the resonances of the 6MHz sidebands are visible: USB ad LSB are very close to each other, and also the two error signals are barely distinguishable from each other, also because of the ringing.
In the orange circles, the resonances of 56MHz USB and LSB.
Finally, in green, the resonances of the 8MHz USB and LSB are shown. Notice that, since also the West cavity was flashing, some of the signals in the 8MHz "belong" to the West cavity, whose transmission is reported in the last subplot for sake of clarity. In figure 2 (plot for the West arm), the North arm was locked while the West was flashing, so the North arm didn't affect the 8MHz signals.
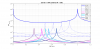
An analytical calculation was also performed in order to compare it with the measurements, and is shown in figure 3, and they agree pretty well. The HOM4 of the carrier falls at the same frequency as the 6MHz, almost in the middle of the FSR, so even if it is present in the data, it's not easy to see it.