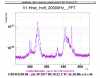
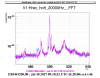
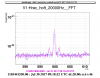
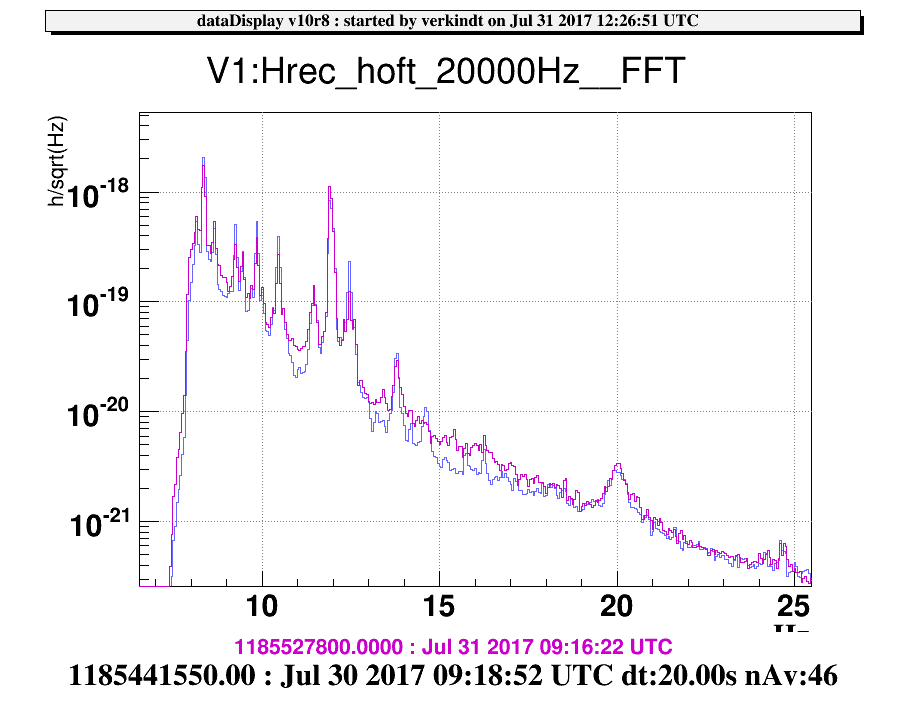
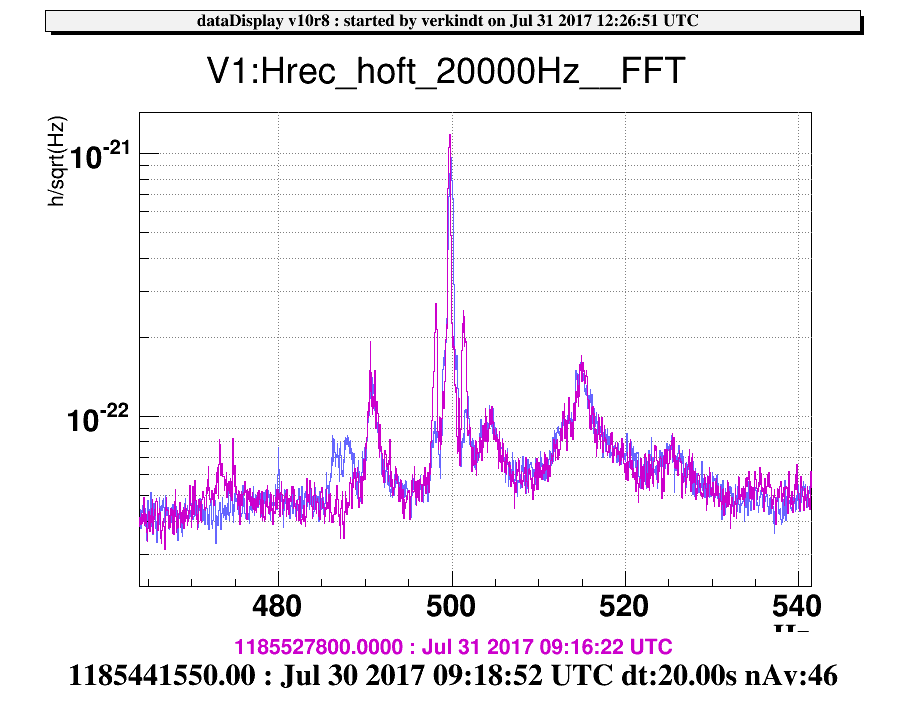
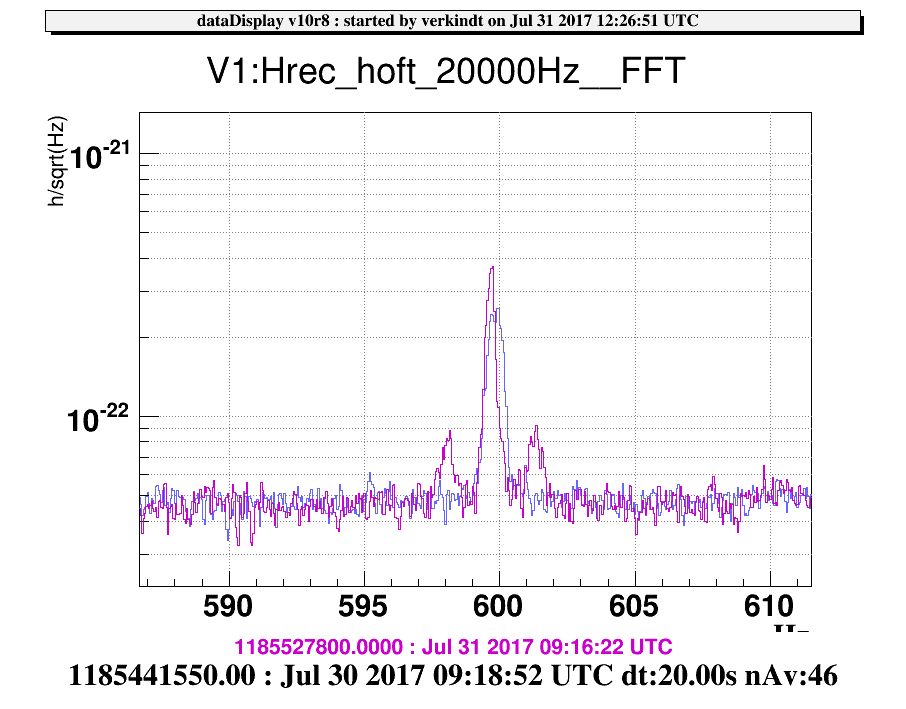
and 2017-07-31 morning, during SCIENCE periods with ITF locked in LOWNOISE 3.
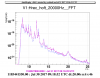
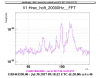
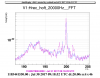
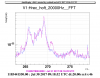
They show some bumps or frequency bands in the sensitivity which move in amplitude or frequency.
I suspect them to be at the origin of several high SNR glitches visible in
Omicron glitchgrams as lines around a given frequency and
I invite detchar shifters to investigate on them.
