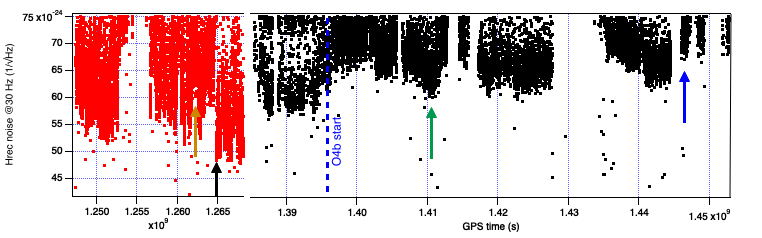
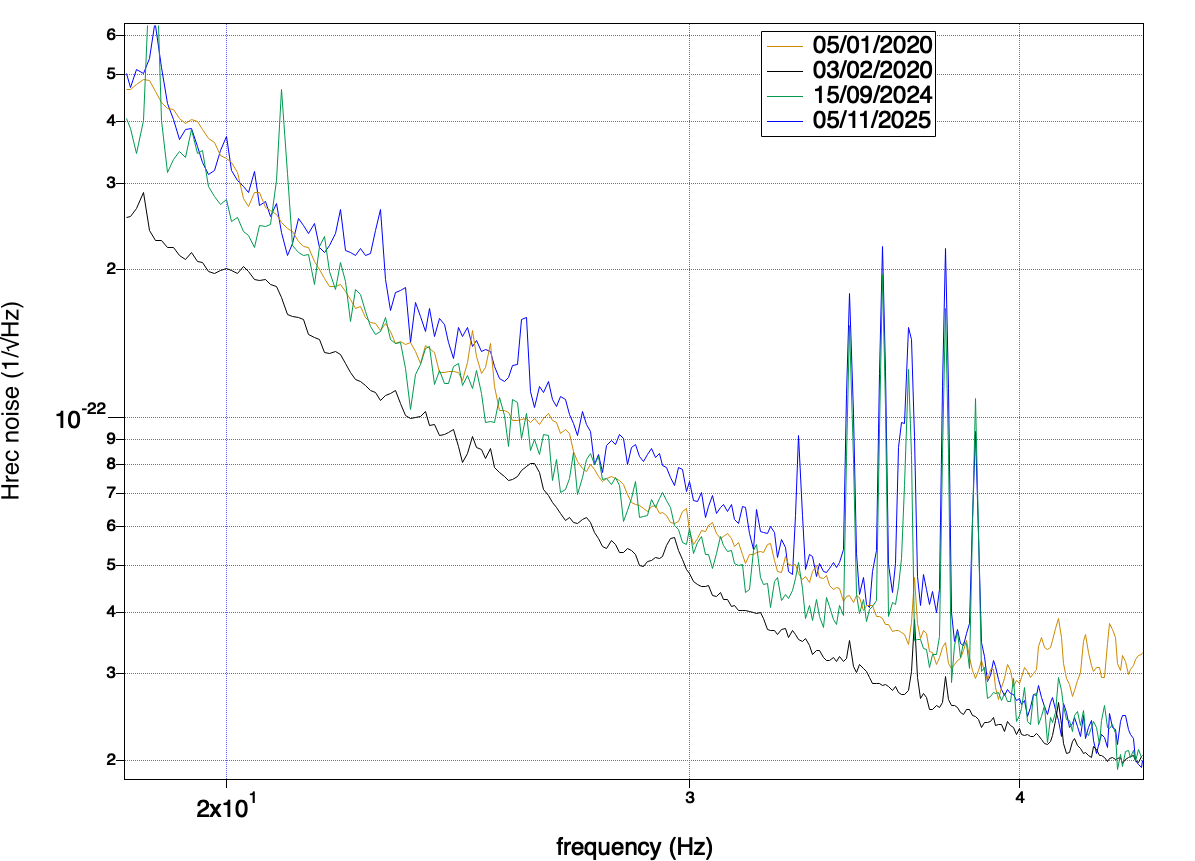
The Virgo sensitivity in the 20÷30 Hz band is limited by an unknown noise source with 1/f^4 spectrum. This was already the case during O3. The attached plots show how the noise level changed during O3 and O4. The first plot is the Hrec spectral density at 30 Hz during the two science runs, with O3 displayed in red points and O4 in black points. Data in the few months before the start of O4 are also included. Each points represents an average over 1000 s.
The second plot shows the Hrec spectrum at four different times, representative of high and low noise (@30 Hz) in O3 and O4 as highlighted by coloured arrows on the first plot. A few comments: the noise in the 20÷30 Hz band
1) was generally lower in O3 than in O4;
2) changed by ~20% during both science runs, and in the best conditions during O4 was similar to the worst conditions during O3;
3) was lowest at the end of 2023 in the O4 configuration.
