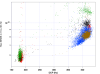
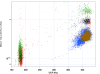
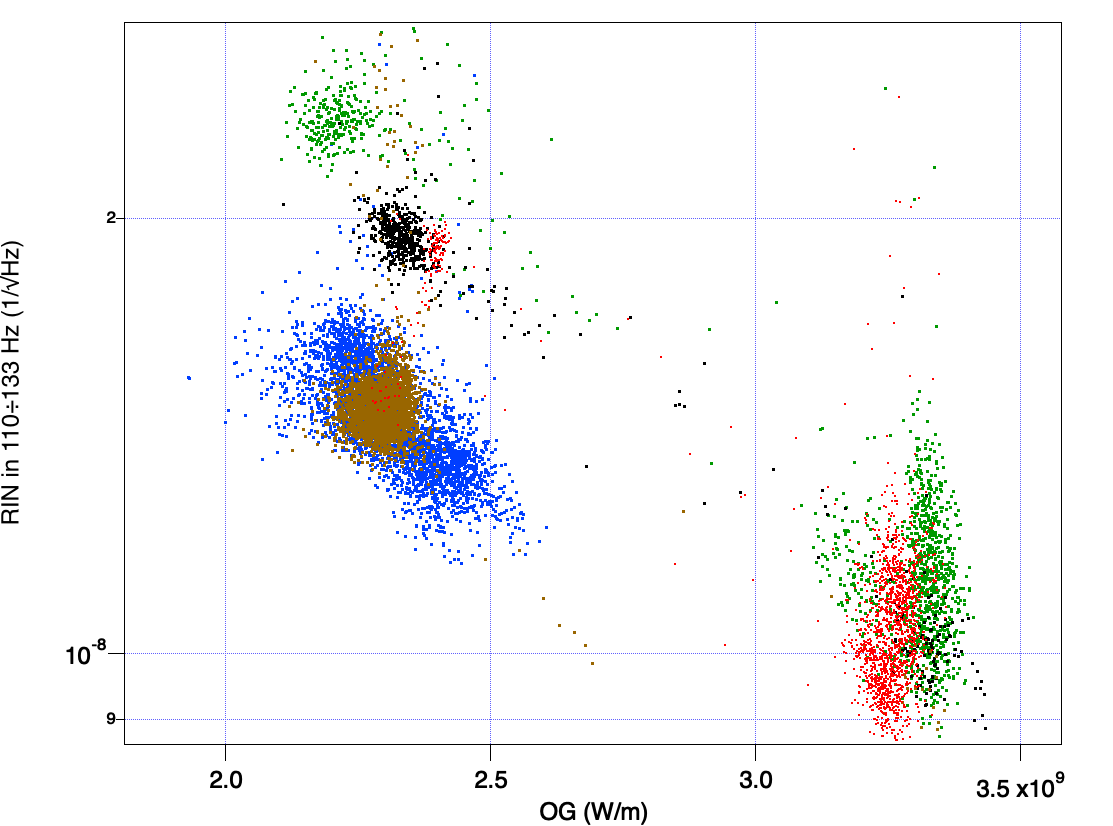
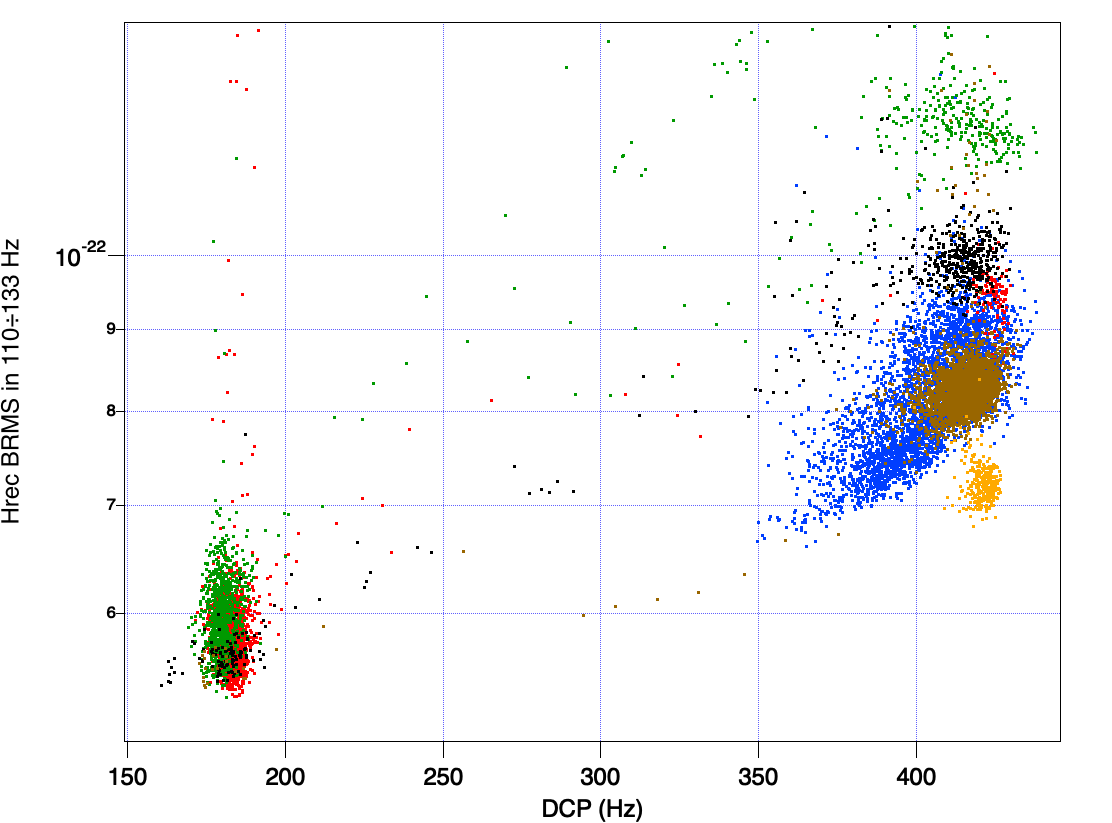
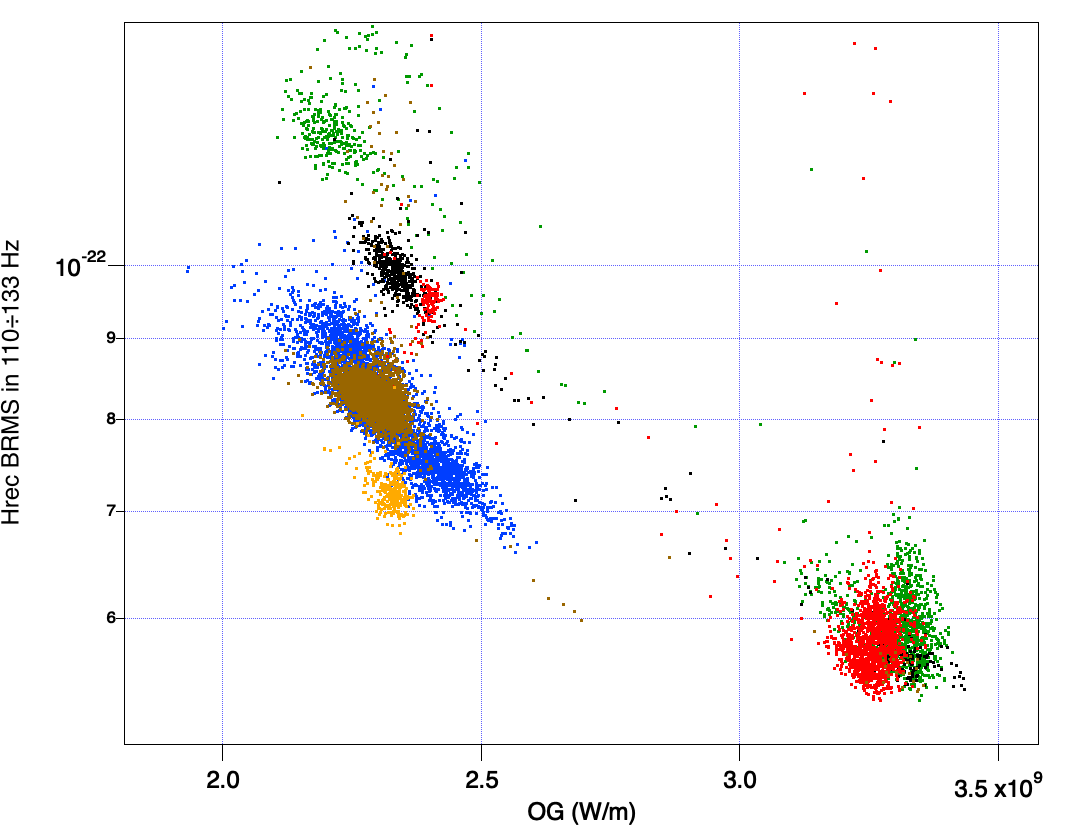
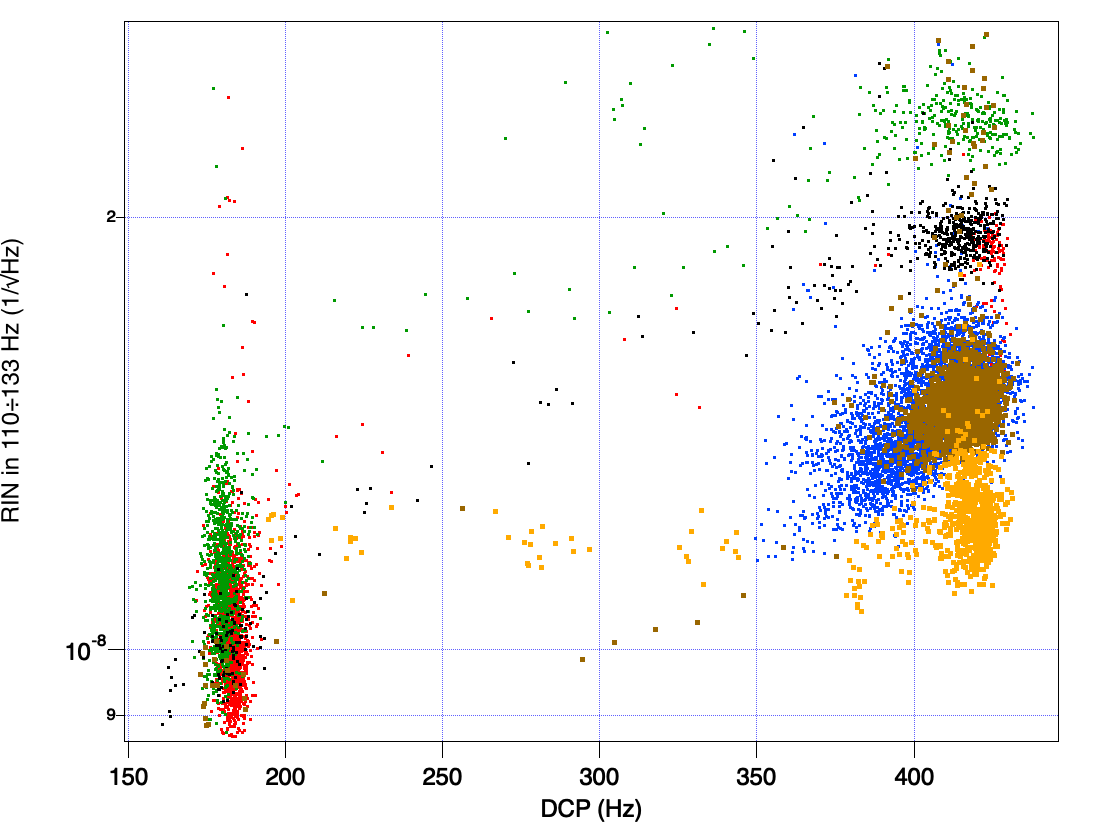
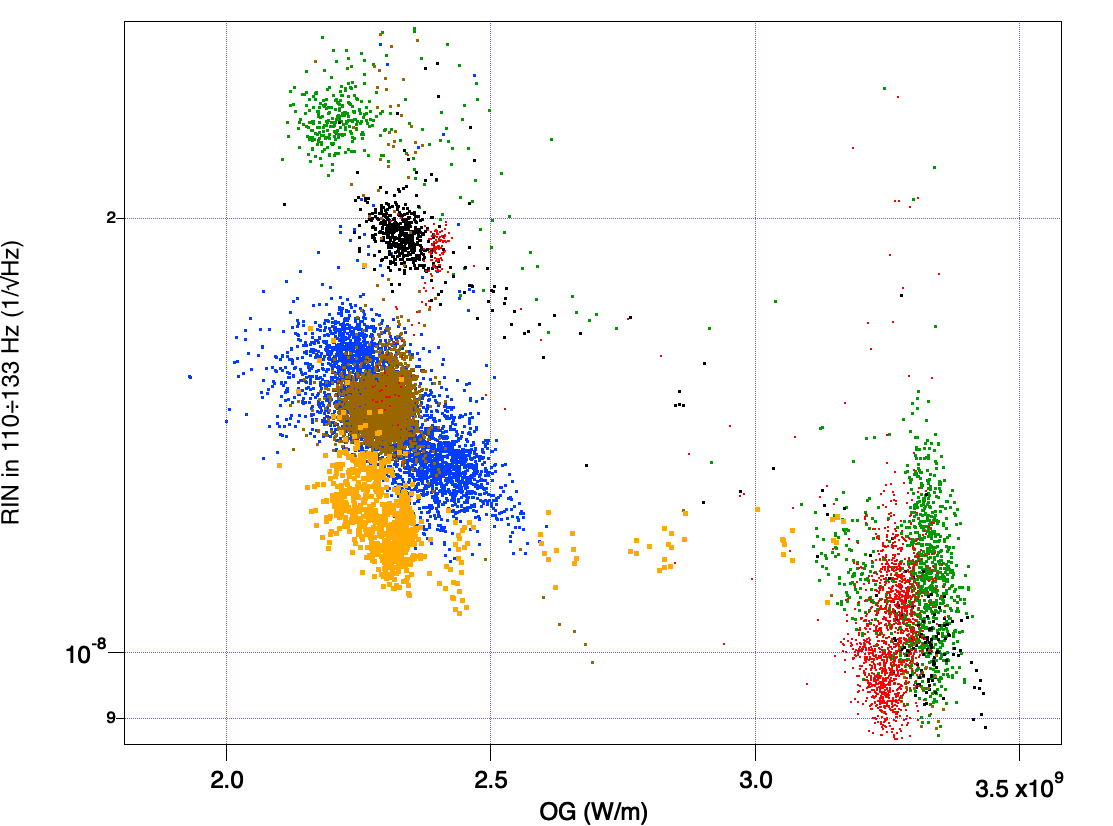
Comparing the sensitivity with aligned SR in different conditions might not show clear outcomes, as the noise depends on the double cavity pole frequency wich is not always stable. However, comparing data with the same DCP frequency may also give unclear results, as the sensitivity depends on the optical gain too.
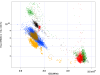
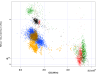
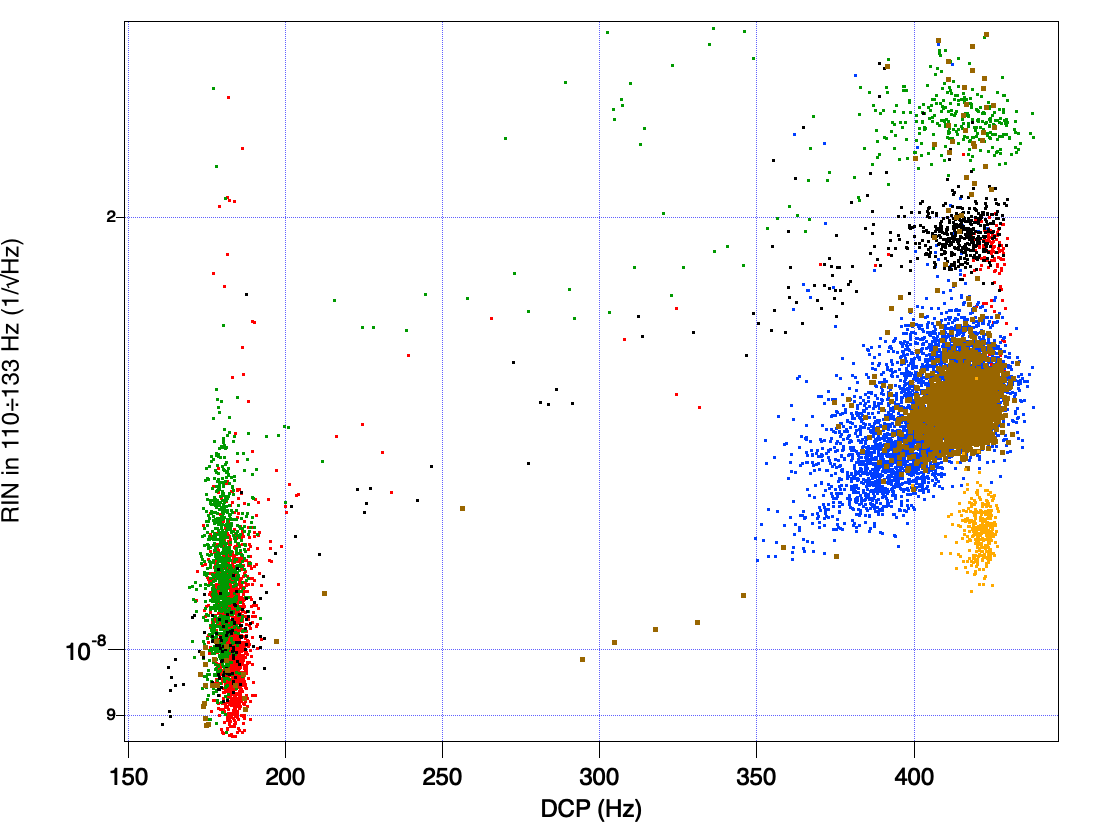
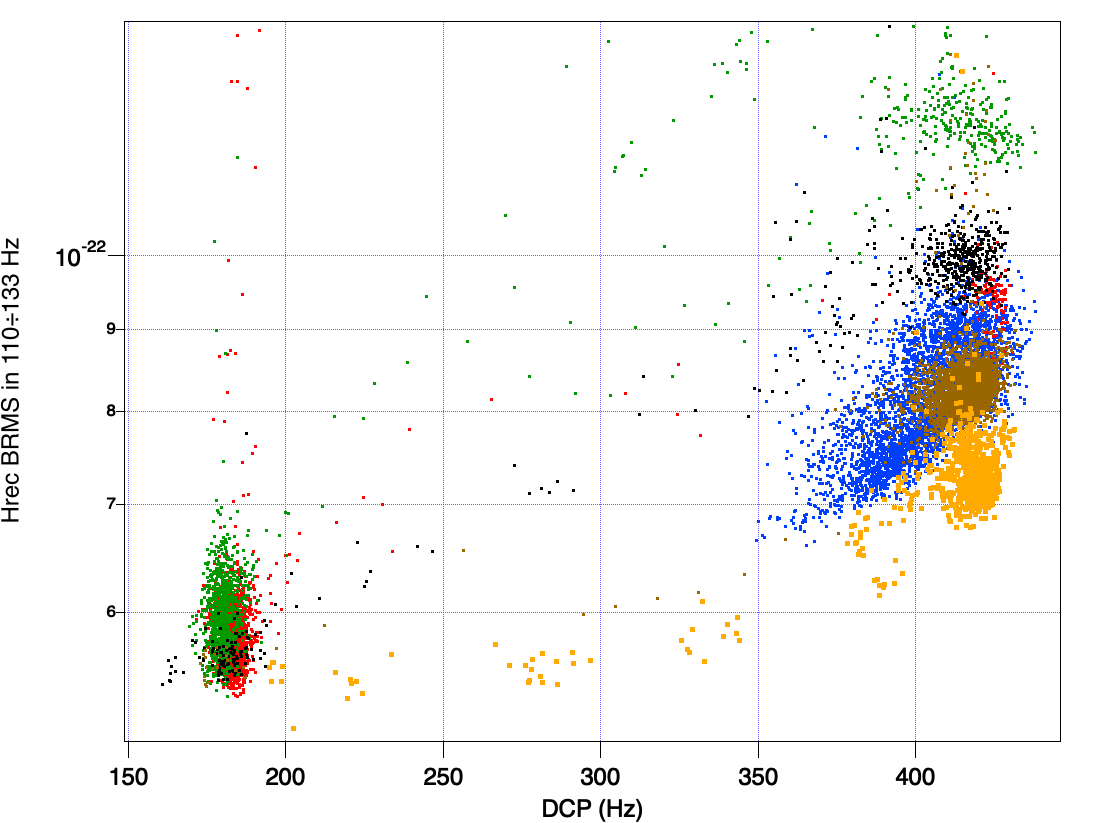
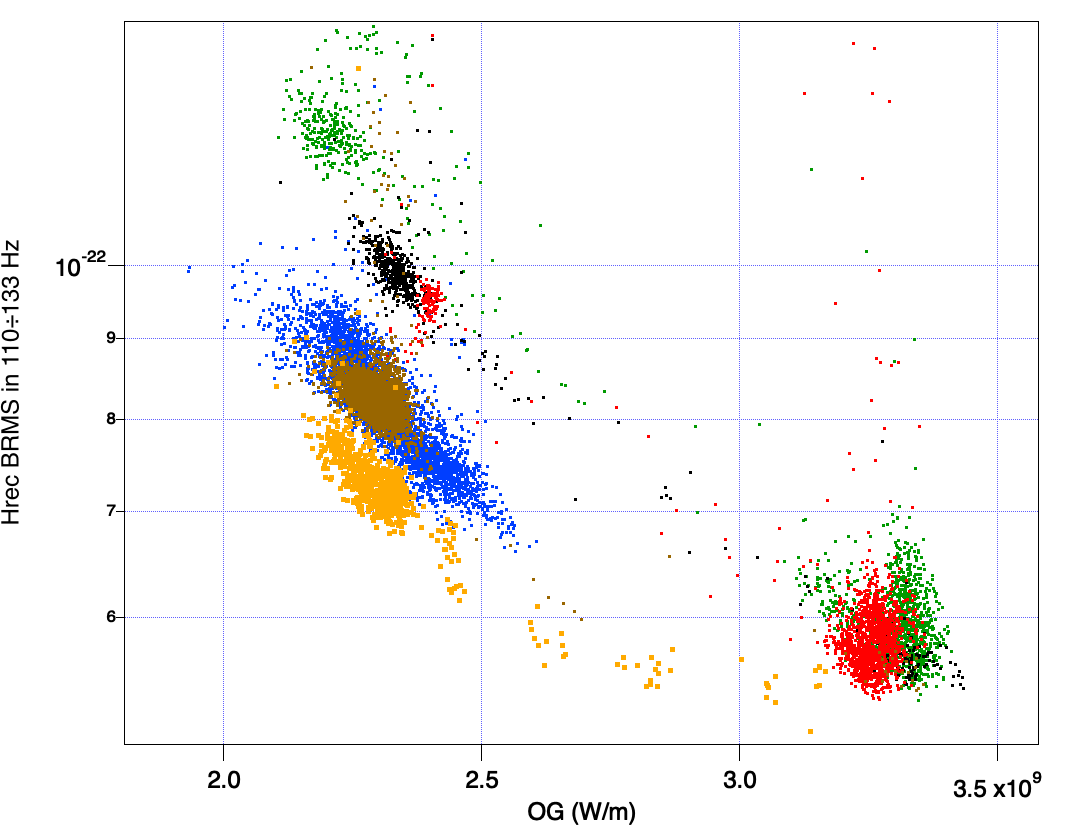
In the attached pictures I plotted some data with aligned and misaligned SR, both before and after the first SR diaphragm installation. Different colors refer to:
- red points: October 2÷4 2025, GPS time range 1443422300 - 1443622200
- green points: December 3÷5 2025, GPS time range 1448779100 - 1448979000
- black points: January 8 2026, GPS time range 1451905220 - 1452105120
- blue points: January 14÷19 2026, GPS time range 1452456018 - 1452955918
- brown points: January 23÷28 2026, GPS time range 1453147218 - 1453647118
Each point is an average over 100 s of data. All sets contain data with aligned and misaligned SRM, except those from Jan 14÷19 when SRM was always aligned.
The first plot shows the Hrec BRMS noise in the 110÷133 Hz band vs the DCP frequency. Noise with misaligned SRM is similar in the various data sets, while noise with aligned SRM has a large spread; the difference between different data sets is much clearer when plotting the noise vs optical gain, see second picture.
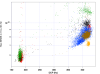
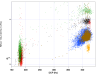
Assuming the broadband noise scales inversely with the optical response, the last two plots show the net broadband noise in relative power units, computed from the Hrec BRMS in the 110÷133 Hz band by:
a) quadratically subtracting the quantum noise (computed from measured optical gain, double cavity pole frequency, and B1_DC power) and Paola's estimate of thermal noise;
b) multiplying by the optical response (computed from measured optical gain and double cavity pole frequency)
c) dividing by the sqrt of the band;
From the plots in relative power units it appears that after the first diaphragm installation, SRM misalignment reduces noise by a smaller factor after SRM diaphragm installation in January then before.


